Circle's Silver Lining: Unpacking USDC's Supply Drop in an Era of Rising Rates
Circle & USDC in an Era of Rising Rates
Get the best data-driven crypto insights and analysis every week:
Circle's Silver Lining: Unpacking USDC's Supply Drop in an Era of Rising Rates
By: Matías Andrade & Kyle Waters
Intro
The growth of stablecoins offers strong evidence of a burgeoning demand for digitized dollars on public blockchains—platforms that operate 24/7 365, and transcend borders and time zones. Among the stablecoin titans, Circle, the entity behind the largest domestic stablecoin USDC, has seen an impressive ascent. Yet, the calendar flip to 2023 brought forth a series of new challenges. The supply of USDC on Ethereum (representing the majority of USDC supply) has dropped from $41.5 billion at the beginning of the year to approximately $23 billion, marking a 44% decline as redemptions outpace new issuance.
In this issue of State of the Network, we set out to analyze USDC's supply loss and its impact on Circle. We segment the current USDC supply into various categories to pinpoint where the attrition is most pronounced. The pressing question remains: Does this supply contraction warrant concern? Going even further, can such a business model remain resilient in a macroeconomic landscape dominated by ascending interest rates?
By fusing on-chain analytics with off-chain financial insights, primarily drawn from public SEC filings and Circle's attestation reports, we present a holistic view of the implications, not just for the blockchain ecosystem but also for Circle as a business entity. This is especially pertinent given Circle's aspirations to go public. Through this off-chain and on-chain data synthesis, we evaluate both the crypto-native aspects and the broader business implications to Circle.
Missing: 18 Billion USDC
USDC’s supply, while currently standing at 23B on Ethereum, is a nuanced picture. This represents nearly a 10x increase still from just three years ago, but it is also a substantial drop from the 2022 high north of 47B. The most turbulent phase of this year's USDC supply loss unfolded in Q1, coinciding with the unraveling of Silicon Valley Bank (SVB)—a development we have previously dissected in-depth. In the wake of this event, USDC supply fell by a staggering 10B in March alone.
But SVB wasn't an isolated incident; mounting governmental and regulatory scrutiny of domestic stablecoin operators (a clampdown some are dubbing "Operation Choke Point 2.0") adds another layer of complexity. Offshore issuers like Tether have benefited, with its supply swelling from $70 billion to $77 billion in the March 2023 timeframe alone.
The current landscape of rising interest rates is another important variable. For USDC holders, this shift poses a tangible opportunity cost. Incumbent stablecoin operators like Circle do not pass on interest accrued from reserves directly to USDC token holders on-chain—a point we delve into later.
However, the hemorrhaging of USDC supply appears to be tapering off, as shown in the chart below. The daily volume of redemptions and issuance, though, remains significantly below the levels observed prior to SVB's collapse.
Source: Coin Metrics Formula Builder
The anatomy of USDC's supply contraction this year presents a multifaceted narrative, but a few trends stick out. Here, we dissect the supply by categorizing it in different segments:
1. By EOAs vs. Smart Contracts
First, we compare USDC held in smart contracts against those in regular Ethereum accounts, also known as externally-owned accounts (EOAs) in the Ethereum lingo. Currently, about $7.6B—or roughly one-third—of USDC is held in smart contracts. This marks a 44% drop from $13B at the start of 2023. EOAs have experienced a similar contraction, falling from $28B to $15B. Interestingly, since the immediate fallout from the SVB crisis subsided, a greater proportion of the supply loss originates from smart contracts.
Source: Coin Metrics Formula Builder
2. By Address Balance Size
We can also break down the USDC supply across varied wallet sizes. The segment sustaining the heaviest loss is predictably on the larger end. Wallets holding over $10M in USDC currently account for $12.5B, down from $22.5B earlier this year. While this decline is partly a function of the skewed distribution of wallet holdings, even on a percentage basis, the largest wallets have witnessed the most significant contractions. In contrast, wallets holding between $100 and $1,000 have seen their collective holdings of USDC supply rise by 28% year-to-date. The bulk of the losses in the large wallet category occurred during the SVB collapse, which is logical given large holders incentives to diversify.
Source: Coin Metrics Network Data
3. By Top Holders
Zooming in further, we examine the top echelon of USDC holders. The top 1% and top 10% of addresses now command a larger share of the total USDC supply than they did at the outset of 2023. This concentration spiked around the SVB crisis, likely a function of USDC being funneled into decentralized exchange pools or exchange wallets. Yet, the overall number of accounts holding USDC has climbed this year from 1.6M to 1.8M.
Source: Coin Metrics Network Data
The USDC supply landscape in 2023 is mired in complexity but is primarily driven by two overarching trends: a migration to offshore stablecoins post-SVB and climbing interest rates incentivizing capital to chase higher yields. While the supply side may cast a shadow of uncertainty, rising rates are buoying Circle's business operations.
Circle’s Treasury
One of the advantages of a stablecoin’s design is the supply transparency, which is auditable in real-time (at least as far as the data on the blockchain is concerned). However, if we also consider Circle’s financial statements and monthly attestations, we can start to build a model of Circle’s USDC treasury and how it functions, and particularly how profitable it may be.
If we take a look at BlackRock’s Circle Reserve Fund, we find it lists the composition of the portfolio segmented by the maturity of the investment asset, with all assets with a maturity under 2-months, as well as 65% of assets with a maturity of 1–7 days. This estimate is based on constant proportion portfolio allocations to both overnight reverse repo (RRP) and 4–week bills, with 70% and 30% respectively.
The size of the portfolio is estimated to be exactly the current supply of USDC, which again may not be exactly representative of Circle’s treasury operations—particularly redemption operations—but should be proportional and consistent. However, this should constitute a naïve estimate of the expected daily rate of return on these investments, since it ignores transaction costs, rollover costs, and management fees that are incurred in the management of this portfolio.
Based on data from FRED, we can estimate the yield that these securities will produce, using the effective Fed Funding Rate to estimate the yield on overnight reverse repo (RRP) investments and the 4–week Treasury Bill rate for the remainder of these assets, at 70% and 30% respectively.
Source: Coin Metrics Formula Builder
As we can see from the chart above, the daily measure of return is highly correlated with interest rates. Even though USDC supply peaked in early 2022, estimated daily revenues actually peaked in early 2023—after supply had decreased by nearly $7B. Even today, with supply off $18B YTD, interest revenues are well above levels from 2021 when USDC supply was comparable to the present level. This is exemplary of fiat collateralized stablecoins’ business model, showing that interest rate sensitivity is increasingly the driving factor behind their profitability.
Source: Coin Metrics Formula Builder
Using the quarterly data from our chart above, we can compare these figures to Circle’s stated reserve interest income as disclosed by Circle. We can see that they report $274M interest income in Q3 of 2022, which is similar to our estimated figure of $240M—however, this simple model appears to break down when we consider data from the current year and all USDC redemptions that have happened in this timeframe. The absence of publicly available financial statements post-2022 hampers our model verification. Nonetheless, it's noteworthy that Circle reportedly garnered more revenue (considering all of Circle’s operations) in the first half of the present year than it did throughout the entirety of the previous year, tallying $779 million against $772 million, respectively.
Even as the interest in stablecoins is rising following news of a Paypal stablecoin, the structural factors enabling the adoption of stablecoins are changing, foremost among these the rising interest rates. An increasing opportunity cost to holding cash might drive stablecoin users towards yield-bearing investments, such as money market funds, which are offering a substantive >5% returns compared to previous years when annualized yield was less than 2%. Moreover, yield-bearing stablecoins have started to gain adoption, such as sDAI and sFRAX. But Circle and Coinbase—a close partner and minority investor—are not oblivious to this. In fact, Coinbase is offering 5% on USDC held on the exchange.
Conclusion
The dramatic shifts in USDC's supply throughout 2023, including the fallout from the SVB crisis and growing regulatory scrutiny, have contributed to a challenging environment for business. Despite a notable decline in its supply, Circle has managed to turn the tide by leveraging the very same interest rate dynamics to buoy its business operations. Although there's an upward trajectory in the interest surrounding stablecoins, the changing macroeconomic conditions and evolving stablecoin landscape, highlighted by yield-bearing alternatives, suggest a need for adaptability and innovation. Circle's strategic partnership with Coinbase, which offers competitive returns on USDC, exemplifies the proactive measures that are all but necessary in this rapidly-developing environment. As Circle contemplates its public offering, its resilience in navigating these turbulent waters will be a testament to its business acumen and vision for the future of digitized currency.
Network Data Insights
Summary Metrics
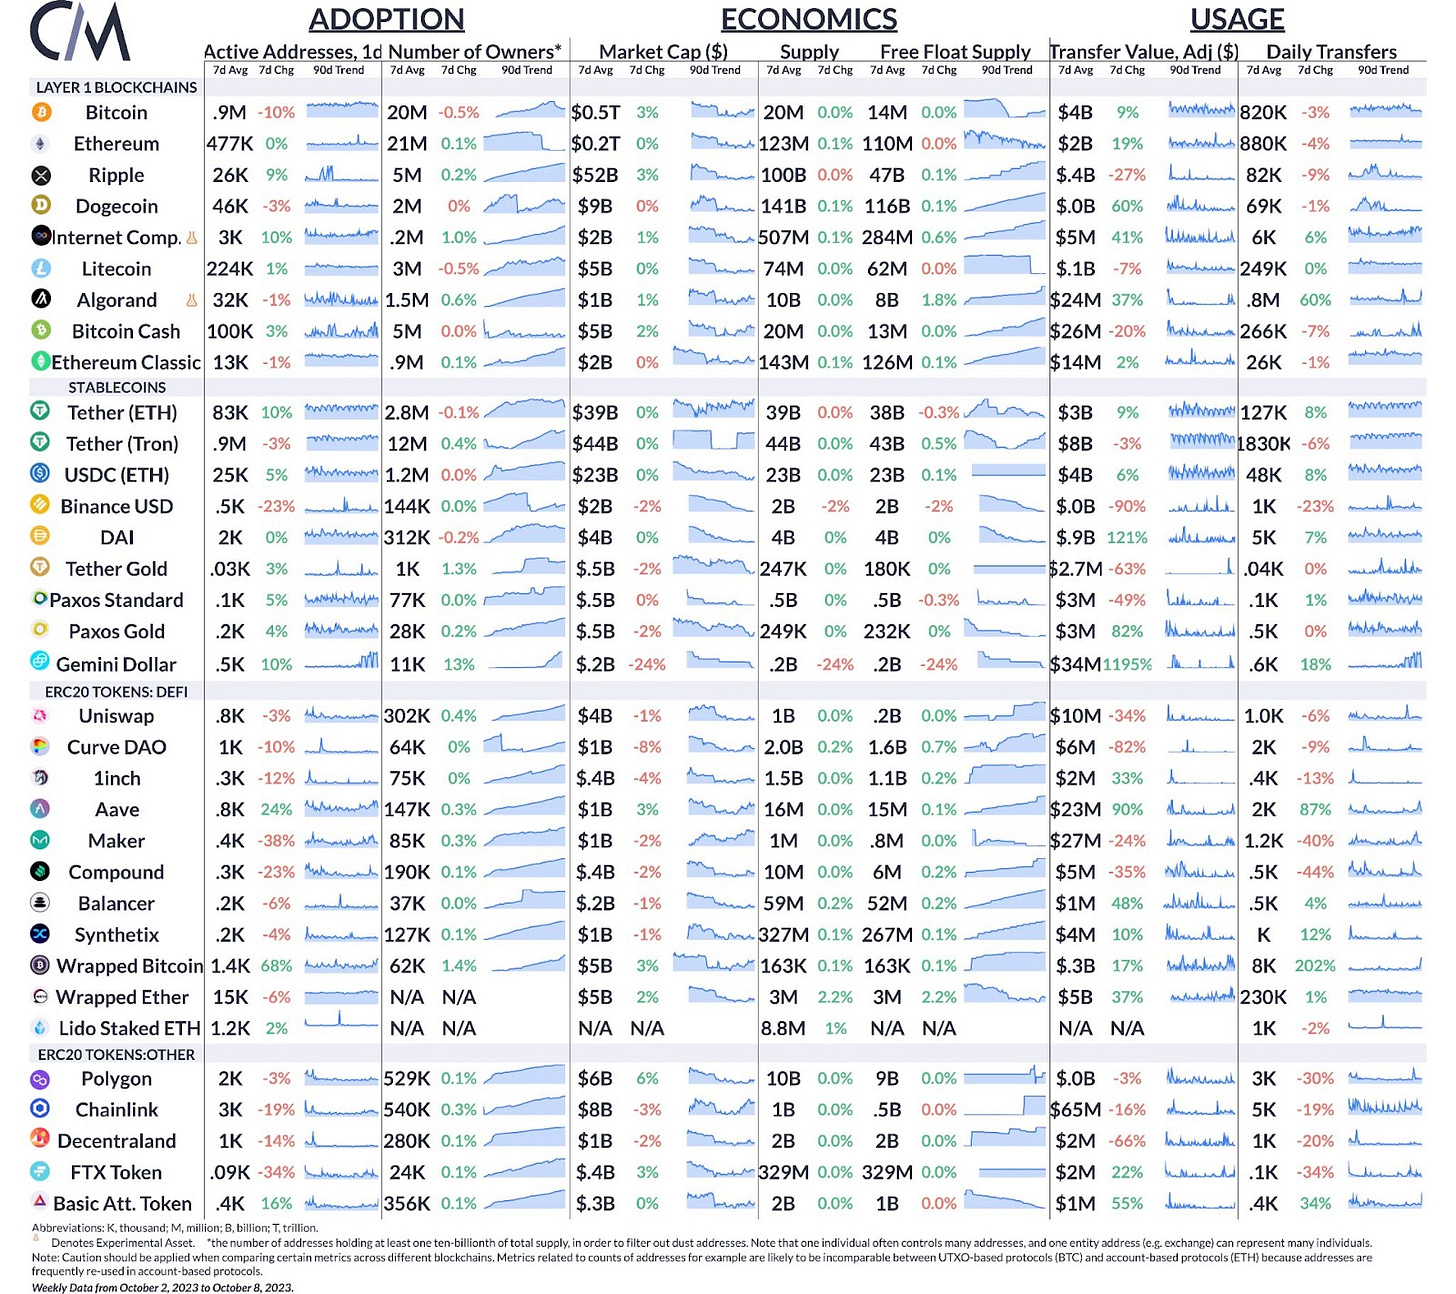
Source: Coin Metrics Network Data Pro
Bitcoin active addresses declined 10% while Ethereum active addresses remained flat over the week. Active addresses of Tether on Ethereum rose 10% to average 83K per day, the highest level since June.
Coin Metrics Updates
This week’s updates from the Coin Metrics team:
Follow Coin Metrics’ State of the Market newsletter which contextualizes the week’s crypto market movements with concise commentary from the Coin Metrics team, rich visuals, and timely data.
As always, if you have any feedback or requests please let us know here.
Subscribe and Past Issues
Coin Metrics’ State of the Network, is an unbiased, weekly view of the crypto market informed by our own network (on-chain) and market data.
If you'd like to get State of the Network in your inbox, please subscribe here. You can see previous issues of State of the Network here.


