
The Signal and the Nonce: Hunting for ASICs in Nonce Distributions
The Great ASIC Debate
Since the early days of Bitcoin, the community has argued about whether to fight against increasingly powerful mining hardware.
In Bitcoin’s early days, mining was performed by CPUs, which are the standard processing units found in most computers. This gave practically anyone the chance to mine BTC since no specialized computer hardware was needed.
As time went on, some miners started using more and more powerful hardware in order to gain an edge over the competition. Miners eventually started using GPUs, the more powerful “graphics processing unit,” which are typically used for gaming and 3D rendering but can be used for many general purposes. GPUs are more expensive than CPUs but are still generally affordable for the average individual.
Then came ASICs. ASICs, which stands for “application-specific integrated circuits,” are pieces of specialized mining hardware that are optimized to mine specific hashing algorithms. ASICs are designed to mine crypto, and only to mine crypto. They are significantly more powerful than GPUs in terms of raw hash power.
With ASICs came a shift in mining economics. Simply put, the companies that manufacture new ASICs have a large advantage over the rest of the mining community since they inherently have a hash power edge (at least temporarily, until other ASIC manufacturers catch up), and also control the supply of new ASICs being released to the market. The large capital upfront investment necessary to manufacture a new line of ASIC hardware also reduces the number of people able to participate in this business. There are large economies of scale for large miners, which makes it harder for the average miner to compete.
Because of this, many projects have tried to protect against ASICs. Notably, after Bitmain and others announced they were developing a Monero-specific ASIC in early 2018, Monero hard-forked to remain “ASIC-resistant,” to keep the mining community as decentralized as possible. Monero has had several hard forks since then to try to stay ahead of ASICs and disincentivize their further development.
Similarly, Ethereum has been “ASIC-resistant” for most of its history (since version 1.0, Ethereum’s hashing algorithm Ethash has been designed to be ASIC-resistant) but ASIC manufacturers are now starting to catch up. As a result, many within the Ethereum community are now arguing for the implementation of ProgPow, a revision of Ethash to make Ethereum once again ASIC-resistant.
Although these projects continue to fight to remain ASIC-resistant, it is hard to consistently stay ahead. Large miners are incentivized to develop ASICs since mining specialized hardware on ASIC-resistant blockchains can yield a large advantage over other smaller miners. This means that there is a constant game of cat and mouse between ASIC miners and blockchain developers.
Into the Nonces
Fascinatingly, examining nonce distributions gives a potential look into the rise of ASIC mining on certain chains and the subsequent attempts to keep them at bay.
Proof of Work mining consists of hashing a block’s header over and over again until its hash is less than a protocol-defined target value. This is done by taking the block header as an input, and then running it through a cryptographic hashing algorithm, which for Bitcoin is Secure Hash Algorithm 256 (SHA-256, applied twice in a row).
In order to get a different hash for each attempt without having to fully rebuild a new block header, a special field is provided to miners as part of the header: the nonce field. This is an arbitrary number that miners can change in order to modify the header and produce a hash that is less than the target hash value. The nonce is a number that can vary from 0 to whatever the upper limit set by each protocol.
Given that, in theory, any nonce can result in a winning hash, it’s not unreasonable to expect that nonces are chosen randomly and therefore distributed uniformly. However, analysis of many blockchains shows that only few follow that expectation. Explanations for this are varied, but changes in nonce-picking strategies can often be linked with the introduction of new mining hardware suggesting that different mining hardware have different nonce-picking strategies.
This pattern was seemingly first noticed for Bitcoin by Twitter user @100TrillionUSD in early January 2019. Further analysis has shown some strange patterns in other chains like Monero, Ethereum, and Litecoin.
Bitcoin

The most famous nonce distribution is Bitcoin’s. At the start of its history, it presents a common pattern: a lot of nonces are close to 0. This can be explained by a simple strategy that consists of incrementing the nonce for each hash. As hashrate was very low in Bitcoin’s early history, mining was performed using CPUs only and a winning hash was commonly found before going over all the possible nonce values. Sergio Lerner exploited this fact to give the most serious attempt at identifying Satoshi’s coins.
After GPUs were introduced, the nonce space became seemingly random. But around height 400,000, a new pattern, yet unexplained, emerged leaving thin stripes of nonce values that are picked less frequently by miners.
BitMEX research wrote extensively about this pattern but found no clear explanation for it.
Looking at a histogram of Bitcoin block’s nonces (over the course of its entire history) clearly highlights that pattern, as well as the prominence of low nonces.

The red line is the expected value assuming a uniform distribution
For even more granular analysis, one can look at the distribution of bits. The nonce field in Bitcoin is comprised of 4 bytes or 32 bits. An analysis of the average value of each of the 32 bits of the nonce shows some interesting patterns:
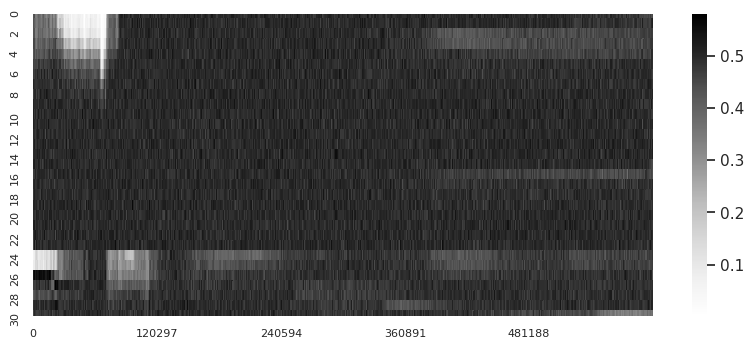
The darker a cell, the more often the nonce bit is set to 1 instead of 0; X-axis is time in blocks
At the beginning of Bitcoin’s history, the higher bits were often set to 0 as miners’ nonce-picking strategy was to simply increment it. The lower byte (the last 8 bits at the bottom of the chart) seem to have always been used with some sort of patterns but only recently have changes in patterns been observed in the lower bits.
Monero
One of the most interesting assets to apply nonce analysis to is Monero. It’s also one of the most analyzed, with various articles and tools looking into it.
Monero upgrades by hard-fork every 6 months and some of the past few upgrades have been accompanied by tweaks to the proof of work algorithm in order to circumvent dedicated mining hardware, but not general-purpose hardware. The first of those hard forks was somewhat contentious as it resulted in several forked projects/assets.
We can therefore study the impact of these changes on the nonce distribution.

At first glance, we can notice several interesting patterns, but things get more interesting when we overlay network difficulty and the scheduled hard forks (that tweaked the PoW algorithm) on top of this chart.

Red lines indicate the timing of hard forks whereas black lines represent network difficulty
We can see that all 3 PoW upgrades lead to some drop in difficulty and that 2 of them stopped pre-existing nonce patterns. Interestingly, the introduction of those same nonce patterns was also associated with a sharp rise in network difficulty.
Simply by observing these nonce distribution patterns against difficulty and PoW-adjusted forks, we can potentially see the effectiveness of the first fork in stopping the first generation of dedicated hardware. Additionally, we can see the rapidity at which some miners came back with a second generation of hardware after the second fork, which was again thwarted with a third fork.
Ethereum
At first glance, Ethereum’s nonce space shows barely any nonce distribution patterns or irregularities.

Looking closer, we can see some darker horizontal lines at the bottom of the space after block number 7,000,000. And if you zoom in, you can spot slanted lines starting from the bottom of the space between numbers 2,000,000 and 4,000,000. Those are likely the signature of a simple nonce-picking strategy: starting at 0 and incrementing the nonce at each try.
A histogram of the block’s nonce shows that there’s a slight preponderance of lower value nonces over time:

However, a very interesting pattern is visible if we look at the average value of each bit of the nonce over time (note that Ethereum’s nonce is comprised of 64 bits, not 32 as in Bitcoin):
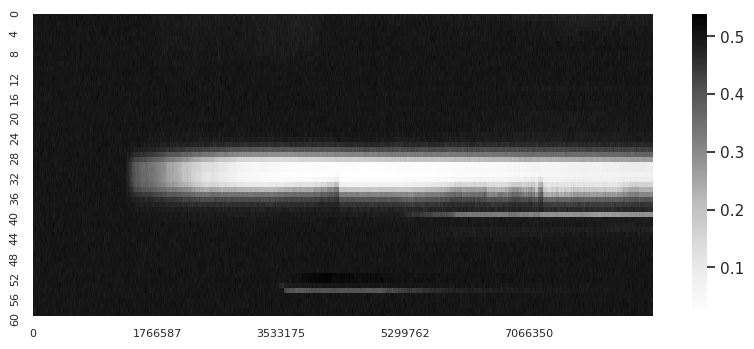
The darker a cell, the more often the nonce bit is set to 1 instead of 0; X-axis is time in blocks
Starting at around block 1,380,000 the middle bits of the nonce started to get set to 0 much more often than the other bits. Over time, other bits started having non-random uses too. What makes this interesting is that a cursory glance at the overall nonce distribution or histogram doesn’t reveal this pattern because tweaking the middle bits doesn’t visibly affect the nonce’s histogram.
Interestingly, Ethereum Classic’s nonce bit distribution shows the exact same pattern:

The darker a cell, the more often the nonce bit is set to 1 instead of 0; X-axis is time in blocks
The white vertical stripes at the top indicate some miners were incrementing the nonce from 0.
Bitmain announced the first publicly known Ethash ASIC miner in April 2018 and said first deliveries were expected in mid-July of that same year. Annotating the previous chart with both dates shows something very interesting:

Dotted red line: E3 announcement, solid red line: E3 first known deliveries
From a first glance, the average value of bit 41 for Ethereum and Ethereum classic blocks dropped around the time of the Antminer E3 announcement. Focusing on this specific bit on both Ethereum and Ethereum classic, the pattern is even more striking:

Dotted red line: E3 announcement, solid red line: E3 first known deliveries
Prior to mid-March 2018, the average value of bit 41 hovered around 0.5 (which is the expected value assuming uniform distribution as represented by the grey horizontal dashed line). However, it started to be set increasingly to 0 from that point onwards on both chains and at the same rate. Its average value then dropped drastically right at the time the first deliveries were scheduled to happen (July 16th, 2018, red solid horizontal line) but only for Ethereum. On both Ethereum and Ethereum classic, bit 41’s average value settled in mid-June 2018, one month before the first announced deliveries of E3 miners, but its value further dropped only for Ethereum.
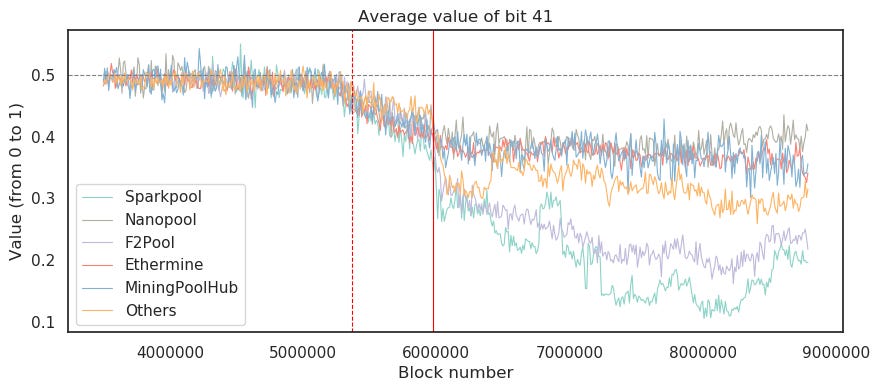
Dotted red line: E3 announcement, solid red line: E3 first known deliveries
Looking at Ethereum’s top 5 mining pool at the time, we can see that the average value of bit 41 started dropping across all pools but that from July 16th onwards, the date of the first announced deliveries of E3 miners, its value further dropped for only 2 major pools: Sparkpool and F2Pool, both administered in China.
The Battle Continues
As ProgPow looms and Monero continues to hard-fork to try to stay ahead of ASICs, the battle against specialized hardware is likely not going away anytime soon. As the war wages on we’ll be watching closely, and continue the hunt for the signal in the nonce.
Network Data Insights
Summary Metrics

BTC rallied over the past week, with a 3.5% rise in market cap. Comparatively, ETH had a down week, with market cap dropping 2% from the previous week.
BTC daily transaction fees are beginning to pull significantly back ahead of ETH, after ETH threatened to flip BTC fees over the last few months. BTC’s average fees grew by 42.2% week over week, while ETH’s grew by 18.4%. BTC had a daily average of over $268K fees over the last seven days, while ETH only averaged $93.5K.
Interestingly, although BTC led ETH in most other metrics, ETH had a 4.6% increase in daily transaction count, while BTC’s daily average decreased by 0.1%. ETH’s transfers (i.e. transactions that include a monetary exchange), however, decreased by 2.9%, while BTC transfers increased by 2.2%. This suggests that Ethereum Dapp (i.e. decentralized application) usage may be increasing, since Dapps often produce non-monetary transactions.
Network Highlights
USDT ETH adjusted transfer value rose significantly over the past week, and has now taken a commanding lead over USDT Omni. As we’ve covered in past issues, Tether exists on multiple different protocols, the two biggest of which are Bitcoin based USDT OMNI and Ethereum based USDT ETH. Over the last several months, usage has been shifting from the Omni to the Ethereum based version of Tether. Notably, Tron based Tether is also reportedly on the rise.

On October 25th, BTC had one of its biggest upward price movements in 2019. However, the movement was relatively quick, with the price rocketing up and then falling back down over a period of 12 hours. This led to the highest 12 hour BTC rolling return since 2017. But in terms of end of day, 24-hour change, it was the second-highest of 2019. The below chart shows the daily growth (from the previous day) of BTC price over the course of 2019, with October 25th highlighted with an orange dot.
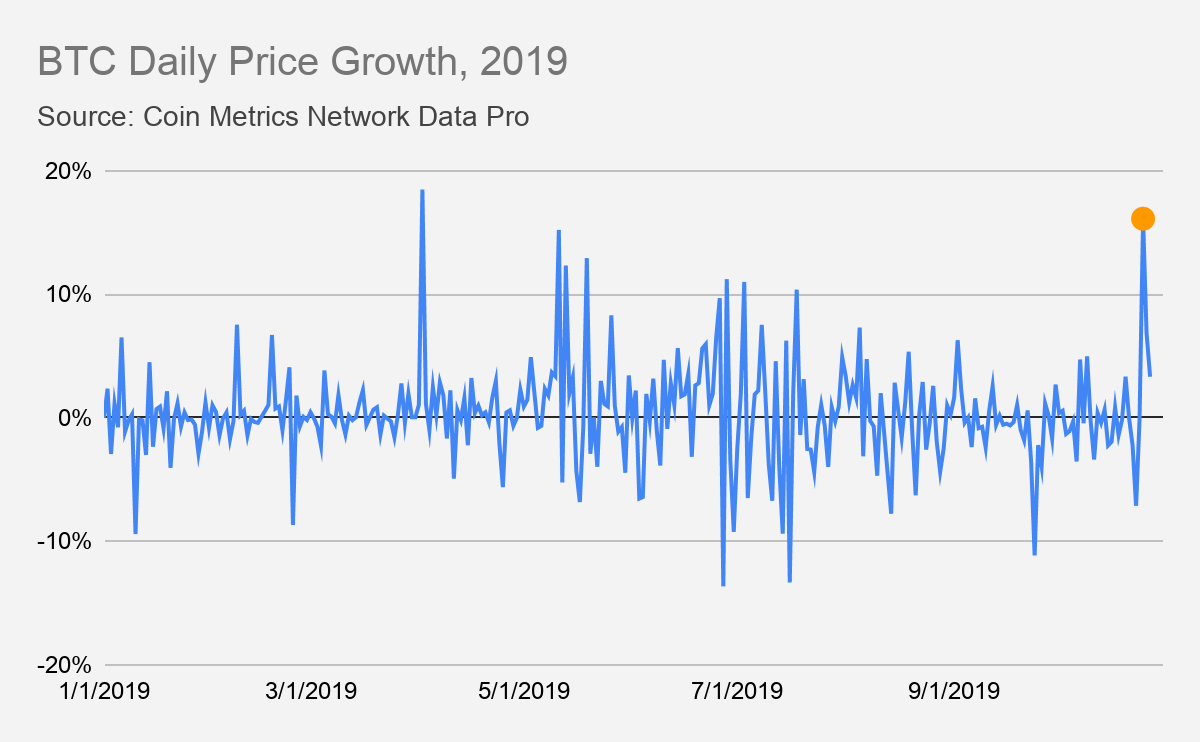
Although the 25th was a big day in terms of price, many other on-chain metrics did not follow suit. Adjusted transfer value only grew by 14.6% on October 25th, which is far below 2019 highs.

Similarly, BTC active addresses (which is the unique number of addresses either sending or receiving a transaction over a 24 hour period) only grew by 9% on the 25th, which is a little below the average of 10% daily growth over the course of 2019.

Market Data Insights
Despite experiencing one of the largest 24-hour returns in the history of Bitcoin, price is up a more modest 16 percent when measured on a weekly basis. Prices continue to experience high directional correlation but wide dispersion in returns with some major assets nearly flat for the week.
Among major assets, Bitcoin Cash SV led the market with a 48 percent return. Bitcoin Cash SV remains one of the most volatile large-capitalization assets with three-month rolling volatility running at over 100 percent annualized. We previously wrote that fork uptake (the number of native units that have moved after a fork event) is particularly low and only roughly 8 million units of Bitcoin Cash SV have been claimed post-fork. With the low claimed supply and being delisted from major trading venues, the amount of Bitcoin Cash SV available for price discovery remains low.

The direct catalyst for the large movement in prices remains unclear, although some market participants believe that remarks from Chinese President Xi Jinping urging greater development in blockchain technologies as the cause. In support of this thesis, major China-based blockchain projects TRON, NEO, Ontology, Qtum, and others have rallied much sharper than the rest of the market.
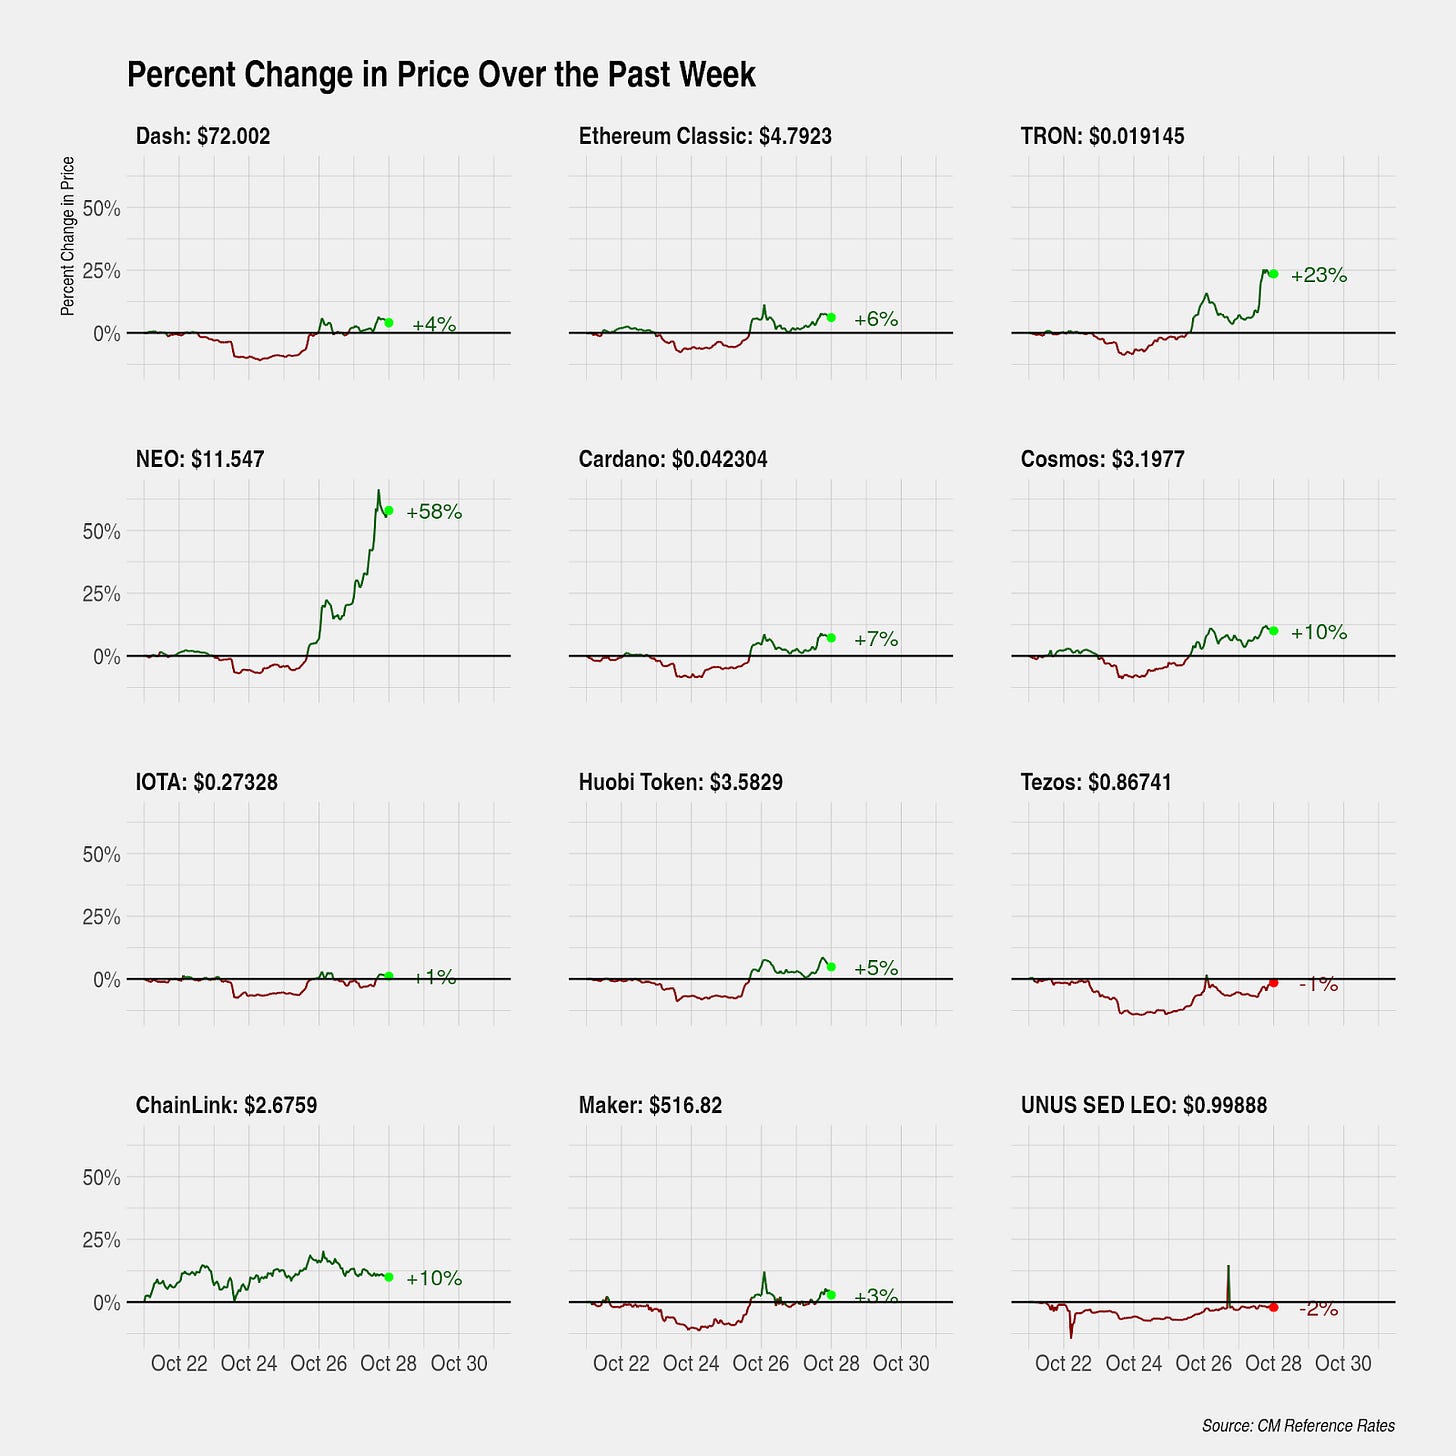
Although certain previous movements have shown limitations in the market microstructure of crypto markets or instances of suspected price manipulation, orderly markets were observed over the past week. Despite extremely rapid price movement, spreads between major exchanges remained small indicating that market participants have the ability to quickly transport liquidity across markets. A similar analysis performed on BitMEX’s perpetual futures contract and major markets quoted in Tether also show orderly trading.

The large movement has meaningfully changed the distribution of Bitcoin by price at the time of last on-chain movement, a proxy for estimating each unit of Bitcoin’s cost basis. The current snapshot shows very little Bitcoin with a cost basis above $13,000. Large amounts of Bitcoin are distributed in the $2,000 to $13,000 range and nearly 4 million Bitcoin or 22 percent of total supply has a cost basis below $500.

Here we show the change in the distribution between October 24 (immediately before the large price movement) and October 26 (immediately after). Extremely little activity was detected from holders with a cost basis above $13,000 or below $7,000 suggesting that the increase in price was not yet sufficient to incentivize these holders to sell. Instead, it is most likely Bitcoin between the $7,000 and $8,500 range was sold, although these amounts may be slightly overstated due to normal exchange hot wallet activity. A small amount of Bitcoin in the $9,000 to $12,000 range did show some on-chain movement, however.

CM Bletchley Indexes (CMBI) Insights
After the market activity in the second half of last week, all Bletchley Indexes performed strongly, returning between 9% and 13%. Not many assets performed as well as Bitcoin over the weekend, which lead to the Bletchley 10 and Bletchley Total performing best week-on-week. This is further highlighted by the underperformance of all indexes in comparison to Bitcoin.

Interestingly, the end of week performance figures do not tell the full picture of what occurred across markets during the week. As demonstrated below, all indexes were down close to 10% mid week, with Bitcoin down more than any index.

Coin Metrics Updates
This week’s updates from the Coin Metrics team:
Coin Metrics is hiring! We recently opened up 7 new roles, including Blockchain Data Engineer and Data Quality and Operations Lead. Please check out our Careers page to view the openings.
As always, if you have any feedback or requests, don’t hesitate to reach out at info@coinmetrics.io.
Subscribe and Past Issues
Coin Metrics’ State of the Network, is an unbiased, weekly view of the crypto market informed by our own network (on-chain) and market data.
If you'd like to get State of the Network in your inbox, please subscribe here. You can see previous issues of State of the Network here.
Check out the Coin Metrics Blog for more in-depth research and analysis.


