Coin Metrics' State of the Network: Issue 49
Tuesday, May 5th, 2020
Get the best data-driven crypto insights and analysis every week:
Designing The Tools For Hash Rate Futures: Introducing the CMBI Bitcoin Hash Rate Index and ‘Observed Work’
By Ben Celermajer and the Coin Metrics Team
Key Takeaways
To date, the critical role of Bitcoin miners has been unhedged and solely dependent on the price of Bitcoin. However, as the mining market continues to mature with the inclusion of traditional market participants, these companies will seek mechanisms to hedge their exposure and operations much like they do with other traditional assets.
The current way of estimating hash rate, which involves a calculation process that includes a set lookback period (e.g. 48 hours), makes it difficult to design financial products that could help miners hedge their risk.
Coin Metrics has designed the CMBI Bitcoin Index and ‘Observed Work’ as a more reactive, responsive and manipulation resistant way to measure the realities of mining activity when compared to traditional hash rate estimations.
Observed Work and Coin Metrics’ CMBI Bitcoin Hash Rate Index can potentially serve as the foundational pieces of financial products that can provide markets with the required tools to effectively and efficiently trade and/or hedge Bitcoin’s hash rate.
We welcome your feedback on how to refine these foundational pieces and pave the way for new crypto financial products. If you are a financial service provider that would like to discuss the CMBI Bitcoin Hash Rate and/or Observed Work, please reach out to cmbi@coinmetrics.io.
Introduction
With the upcoming Bitcoin halving, there has been much speculation about the impact it will have on hash rate. For the majority of the crypto community, this is a fun, speculative exercise with relatively low stakes. However, for the mining community, the outcome can not only dictate profitability but it can dictate the probability of survival.
This is largely due to the absence of a robust, market-wide accepted methodology for hedging mining operation uncertainties. In this week’s SOTN feature, we propose two new tools that will enable financial derivative markets to effectively provide a mechanism to hedge and speculate on Bitcoin’s hash rate:
The CMBI Bitcoin Hash Rate Index
Observed Work
But first, a quick recap on the importance of Bitcoin’s hash rate to the cryptoasset ecosystem.
The Importance of Bitcoin’s Hash Rate
The activity of cryptoasset mining is one of Bitcoin's core functions and was one of Satoshi Nakamoto’s key innovative ideas. Simply put, without mining, neither Bitcoin nor cryptocurrencies in general would likely exist today. Mining helps to:
Secure the network, prevent corruption and disincentivize bad actors from tampering with the public ledger.
Mint new Bitcoin to go into circulation.
Order and broadcast all transactions that have occurred on the ledger.
Validate and append new transaction information to the ledger to allow users to transact in a trustless manner.
Miners can generally understand their costs, which are predominantly a function of Hardware / Facilities (Capex) and electricity to run the mining rigs (Opex), which, given a fixed amount of hash rate on the network, allows them to determine their ability to make a profit under particular Bitcoin price conditions. However, the total number of hashes (computing power) performed on the Bitcoin network is not constant or predictable. Rather hash power fluctuates significantly over time, and not always in line with the price of Bitcoin.
For this reason, the ability for miners to hedge their hash rate and improve their ability to maintain profitability through a broader array of price and hash rate scenarios is critical.
For example, consider a large institutional mining operation that is deciding whether or not to enter the market. They have the budget to acquire equipment that today will give them enough mining power to capture 1% of mining / hash rate. With this, they can expect to receive, on average, 18 BTC per day. At a price of $8,000 per Bitcoin, if the operational costs are more than $144,000 per day (at today’s reward level), a miner will not make any profits and therefore should not enter the market. However, if their operating costs are $100,000 per day, they will have a nice profit margin and should consider entering the market.
Three months later the mining rigs arrive at the facility and Bitcoin has gone up to $10,000 per coin, but Bitcoin’s hash rate has doubled. Now they will only have 0.5% of the total hash rate, representing a reward, on average, of 9 BTC per day. At $10,000 per BTC, they will clear $90,000 per day in revenue, for a net loss of $10,000 per day, assuming a maintained operational cost of $100,000 per day. This does not bode well for the longevity of their business.
However, if they were able to hedge their exposure to mining operations by trading hash rate derivative products, they could minimize their exposure to macro shifts in hash rate.
Note: The example utilizes illustrative figures and ignores the impact of the upcoming halving for simplicity’s sake.
Designing the Tools Required for a Hash Rate Financial Product
In a distributed process like mining, it is near impossible to obtain reliable hash rate figures from the universe of miners. Therefore, the current best practice of deriving hash rate is to generate an implied value from the rate at which blocks are produced at a given difficulty level. This approach might be like saying traders of oil futures used the price observable at gas stations to calculate the amount of oil being pumped globally. Essentially, this is deriving a price (or hash rate) right now, from historical data.
For hash rate, this introduces many undesirable issues when creating a financial product. Coin Metrics identified three key issues with a simple hash rate index that had to be overcome:
The predictability of the short term levels. Since the hash rate calculation depends on past data, the majority of the data used to generate short term future levels is already known. For example, if the hash rate is computed using a 48hr lookback window, you already have 47hrs out of the 48hrs of data points that will be used to calculate hash rate in an hour. Therefore, this short term future hash rate is relatively predictable.
Given the random block generation process, implied hash rate tends to follow an oscillating pattern (as can be observed below). This poses two types of settlement risk for contracts. Firstly, there is randomness as to whether or not a contract would settle at the top or bottom of an oscillation, which could significantly impact the outcome of a trade. Secondly, this rate is highly manipulatable by some of the large miners that control significant portions of hash rate.
A fixed contract length on hash rate does not account for what happens between the contract open and close. Imagine a 3-month contract opens and closes at the same level. If a miner wanted to hedge their position by longing this contract they would make $0 at settlement. But if the hash rate average over the period was 20% higher than the open/close rate, they also would have realized lower revenue than expected. This is a lesser consideration since, in theory, one could trade throughout the contract to overcome this, but one that could be overcome through some innovative design.
Another approach to developing derivative financial products to speculate and hedge hash rate is through the use of difficulty. While difficulty provides some benefits above a hash rate derived index, it too has some issues that need to be overcome:
Difficulty only adjusts every 2,016 blocks (~2 weeks). This means that in the early parts of the contract, it is incredibly difficult to price, as estimating the future difficulty is essentially impossible and subject to significant fluctuations.
Long term difficulty contracts do not consider the difficulty levels throughout the duration of the contract. Difficulty can start and finish at the same level, but if it was higher through the middle of the contract, it does not act as an effective hedge (unless the contract has the liquidity to be managed in real time).
Difficulty can be susceptible to heavy manipulation. Perhaps somewhat surprisingly, in the days before a contract closes miners can significantly impact the outcome of the next difficulty adjustment by deliberately switching off equipment.
Coin Metrics has reduced the impact of many of these issues by designing the following tools, together which can form the basis for an effective derivative market hash rate product.
1: The CMBI Bitcoin Hash Rate Index
There is no definitive way to understand the amount of hash rate that is being contributed to the Bitcoin network. Rather, an implied hash rate can be calculated by looking at the recent historical time it takes miners to produce blocks.
Bitcoin was designed to have an average block time of 10 minutes, and every two weeks, Bitcoin’s difficulty adjusts to maintain a 10-minute average block time. Since solving for Bitcoin blocks is a random process that follows a Poisson distribution, the time between blocks can vary greatly.
This can lead to volatility in the determination of hash rate on the network. The industry standard to date has been to view hash rate using a 24hr lookback. However, for a structured financial product, Coin Metrics deems this to be too unpredictable and volatile. For that reason, we have introduced and will leverage a 48hr lookback for the CMBI Bitcoin Hash Rate Index.
This was especially evident when 3 blocks in a 24hr period took over 50 minutes to mine in September, resulting in the industry-standard implied 24hr hash rate to drop over 30%. However, this was just likely the result of a random, low probability but explainable outcome. Whilst the 48hr lookback period was also impacted, its <20% fall was less severe. We discuss this and more in issue 19 of SOTN.
More generally, in the image above you can observe that the 48hr lookback follows a lot less volatile movements than its 24hr counterpart.
2: Observed Work
As discussed above, it was not enough to release a hash rate index given the predictability, undesired randomness (from the oscillations) and tradability issues of traditional hash rate calculations. For this reason, we created Observed Work.
The traditional chainwork calculation assigns a fixed number of hashes per block based on the current difficulty (i.e. between difficulty adjustments, regardless of whether a block takes one second or one hour to find, chainwork will assign the same value).
To better reflect the work that is done by miners and the number of hashes conducted over a fixed period of time, Coin Metrics’ Observed Work is calculated as follows:
By introducing both the implied hash rate level and the time taken to find the most recent block, this representation of work conducted is more reactive and responsive to the realities of mining activity when compared with chainwork.
Coin Metrics’ Proposed Observed Work Futures Contract
Recall from above that a miner knows the number of hashes that their equipment can produce, but not what other miners can and will produce in the future. Based on the implied hash rate, a miner understands their current share of total hash rate and thus their expected revenue / share of block rewards.
Observed Work has been developed for financial service providers to build structured financial products:
For market participants to speculate on hash rate.
For miners to effectively manage their hash rate exposure by being able to hedge against the total observed number of hashes over a period of time.
Bitcoin’s difficulty level provides great insight into the network’s expectations of hash rate over each 2,016 block epoch. For this reason, a financial product that utilizes Observed Work would allow users to effectively trade expectations of the number of hashes with the unknown reality of hash rate movements over fixed timeframes.
Below is a theoretical example of an Observed Work 50-minute contract (3,000 seconds), assuming:
The market expects the hash rate to be 100 exahashes per second at time t=0
Bitcoin blocks are expected to take 600 seconds per block as defined in the Bitcoin whitepaper
Note: The implied hash rate values are directionally correct but for simplicity use rounded and easily digestible values.
At the opening time of the contract, a reasonable expectation of settlement price would be 300,000 exahashes (3,000 seconds ✖ 100 exahashes per second). However, as evidenced below, despite the implied hash rate closing at the same level that it opened, the contract would adjust over time and close higher than expected at 308,050 exahashes.
Walking through this result block by block:
Block 1 takes the expected 600 seconds to be found, thus there is no change to the implied hash rate and the observed work of 60,000 exahashes equals the expected work.
Block 2 is found in 10 seconds, which will increase the implied hash rate as block time was less than the protocol defined 600 seconds. At time 0, the expected work in 10 seconds was 1,000 exahashes (10 seconds * 100 exahashes per second). However, since the hash rate went up, the observed work increased to 1,050.
Similarly, block 3 was a fast block and therefore the implied hash rate increased and observed work was higher than what was expected at time 0.
Block 4 is the first slow block, taking over 600 seconds and thus reducing the implied hash rate to 105 exahashes per second. This is still higher than the 100 exahashes per second that we expected at time 0, which results in this block too having a higher observed work than expected.
Block 5 is another slow block, resulting in an implied hash rate of 100 exahashes per second, the same rate at which hash rate started. Given this, the observed work for this block equals the expected work, producing 119,000 exahashes.
This scenario is not uncommon in the Bitcoin protocol. One recent period that demonstrated this result very clearly was in mid-January this year (depicted below). As can be observed, the implied hash rate began and ended the 2,016 block period at approximately the same value. Despite this, the difficulty rose 5% since hash rate spent the majority of the period above expected levels. If a miner were to have taken a long hash rate position during this contract term, they would have not achieved the returns forecasted at the start of the period from their mining operation, as the average hash rate was higher than expected. Additionally, they would have made very little profit on the long hash rate futures contract because hash rate closed around the level that it opened.
However, exploring how a two week observed work futures contract over this period would have performed, it is evident from the below that:
The total amount of work conducted by miners throughout the period was higher than expected.
A miner with a fixed rate of hashes per second would have received less yield through the period than they expected.
If the miner was long this contract, they would have profited from the increase in observed work throughout the period.
This can further be modeled over longer contract lengths to provide long-term exposure and hedging to hash rate as may be required (e.g. hedging between ordering and receiving equipment). Below is an example 3-Month Observed Work Contract from the first difficulty adjustment of 2020. It can be visually observed how such a contract’s expectations would change over time as more information came to light and the contract settlement date got closer.
Conclusion
From the above examples, we can observe that such a structured financial product would overcome many of the issues that have hindered successful hash rate products as discussed earlier:
Predictability - the work conducted during a contract is always increasing, making it less susceptible to the predictability issues that hash rate faces due to its oscillating pattern. Further, whilst expected work is well understood, the observed work that takes place is highly dependent on the randomness of block times coupled with fluctuations in hash rate. To this extent, the divergence between expectation and observed work is less predictable than short term hash rate movements.
Measure performance over the duration of the contract - hash rate contracts could close at the top or bottom of an oscillation, which introduced an unwanted random risk to traders. Further, hash rate levels do not reflect the behavior of the metric over the duration of the contract. Observed work reflects the whole history of ‘work’ over the contract, and isn’t as impacted by the oscillating pattern of hash rate.
Manipulability - Given the large amount of hash rate that some miners possess, they could significantly and rapidly impact both hash rate and difficulty. Observed work can improve the manipulation resistance of hash rate products by adding time-weighted dimensions that follow a random Poisson distribution.
Mining is one of Bitcoin’s core functions and innovations that has allowed us all to benefit from a decentralized, distributed and sovereignless currency. As such, hash rate is a very important on-chain metric that provides markets and network participants with an indication of network strength and security.
To date, the critical role of miners has been unhedged and solely dependent on the price of Bitcoin. However, as the mining market continues to mature with the inclusion of VC-backed operations and traditional market participants, these companies will seek mechanisms to hedge their exposure and operations much like they do with other traditional assets.
Together, the CMBI Bitcoin Hash Rate Index and Observed Work hope to be the foundations of financial products that can finally provide markets with the required tools to effectively and efficiently trade and/or hedge Bitcoin’s hash rate. We welcome your feedback on how to refine these foundational pieces and pave the way for new crypto financial products.
If you are a financial service provider that would like to discuss the CMBI Bitcoin Hash Rate and/or Observed Work, please reach out to cmbi@coinmetrics.io.
Network Data Insights
Summary Metrics
Source: Coin Metrics Network Data Pro
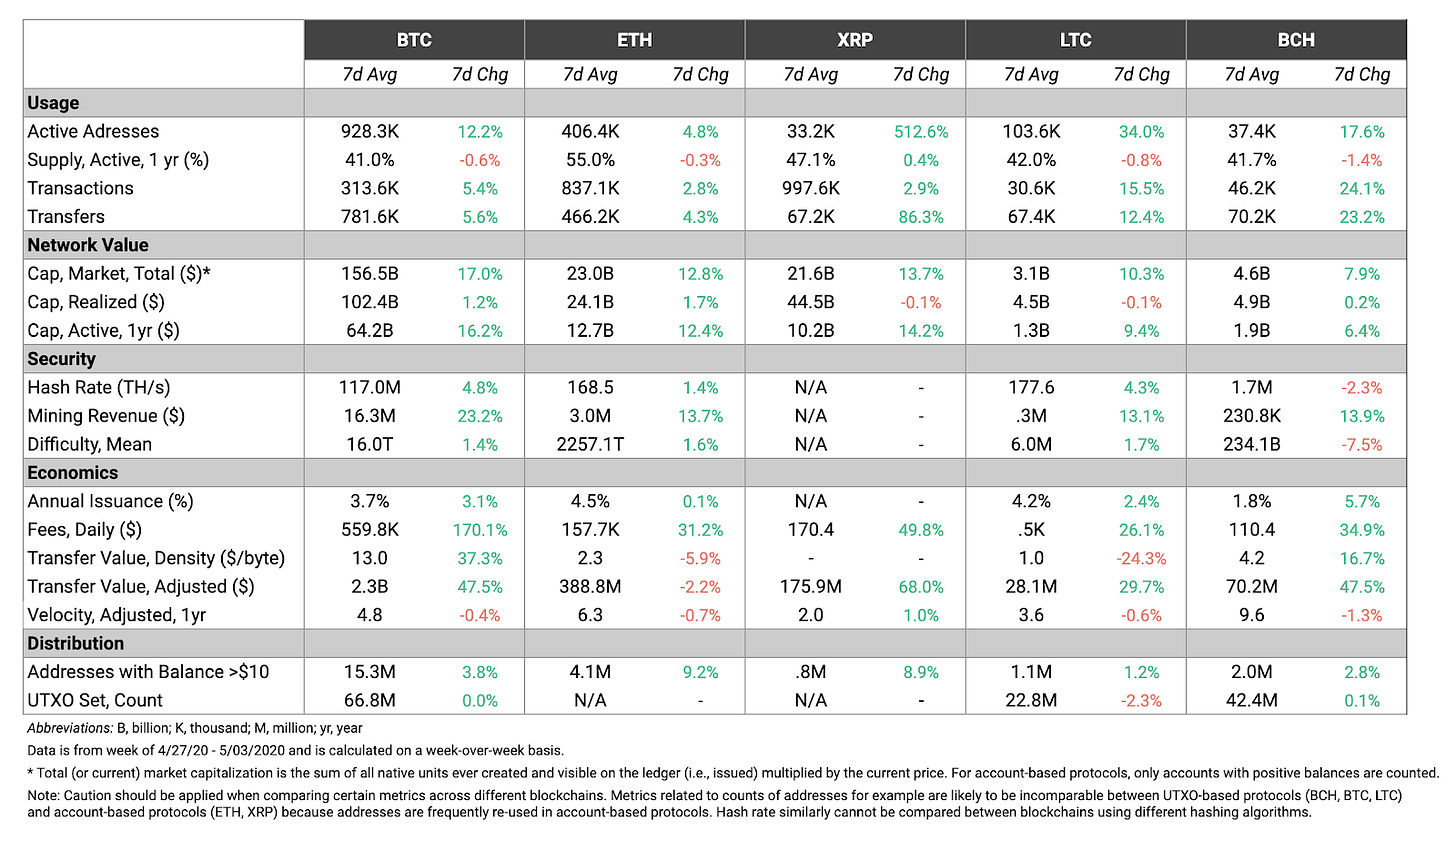
The major cryptoassets had their strongest week since the Mach 12th crash, with Bitcoin (BTC) leading the way. BTC market cap grew 17% week-over-week, breaking the recent trend of Ethereum (ETH) outperforming BTC. Despite this, ETH also had a relatively strong week, with market cap growing 12.8%.
BTC and ETH usage also continued to trend upwards and recover after the crash. BTC fees are up 170% week-over-week, which signals a large surge in network demand. As a result, BTC’s fee-to-revenue ratio (a key indicator of network health) reached over 6% on April 30th, its highest level since June 2019.
Network Highlights
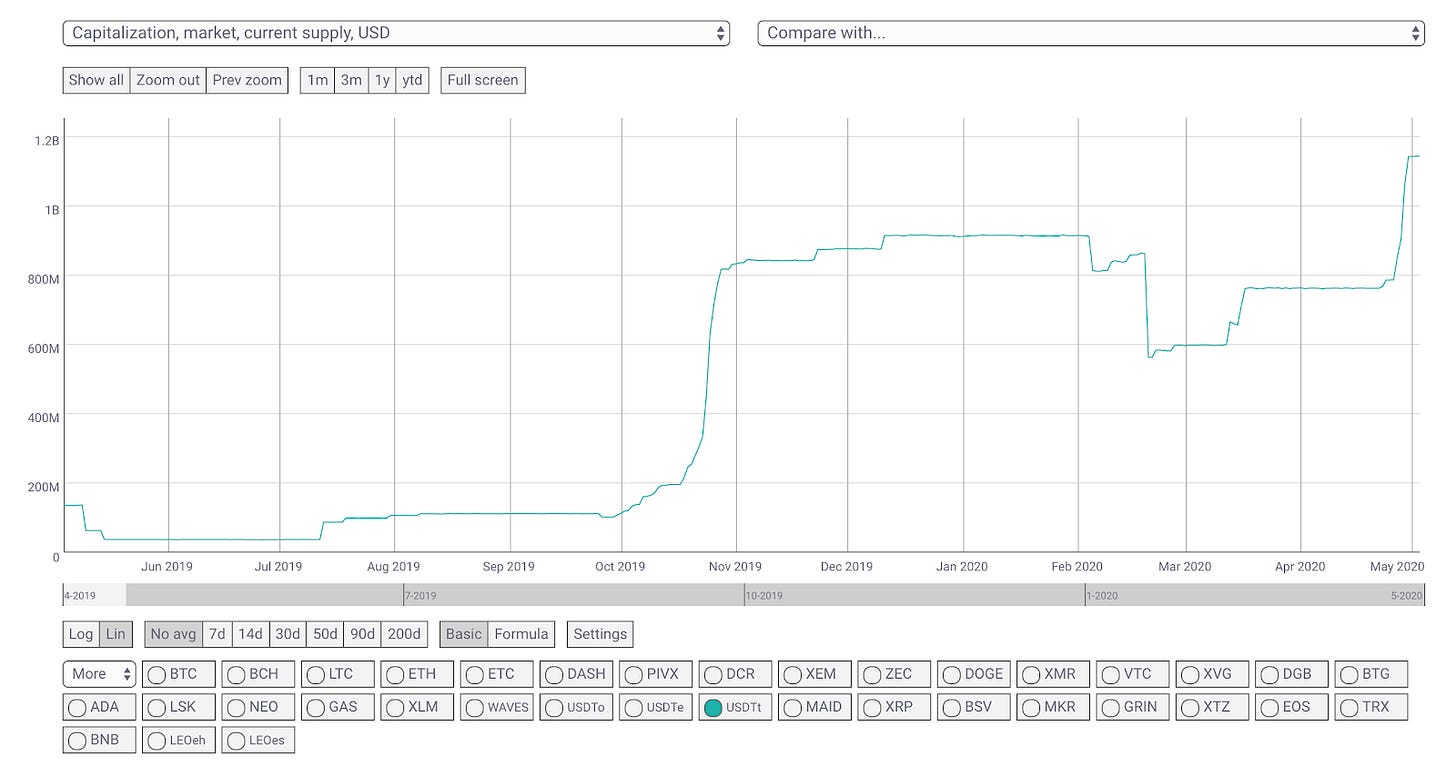
There is now over $1 billion of Tether issued on Tron (USDT-TRX). Over $350 million USDT-TRX has been issued since April 1st.
The following chart was generated using our free community charting tool.
Source: Coin Metrics Community Data
Additionally, there is now over $5.6 billion Tether issued on Ethereum (USDT-ETH), and $1.34 billion on Omni (USDT). If considered separately, USDT-ETH, USDT, and USDT-TRX are the first, second, and third biggest stablecoins by market cap.
The following chart was generated using our free community charting tool.

Source: Coin Metrics Community Data
Market Data Insights
The Portfolio Allocation Challenge
One of the interesting things about the crypto asset management industry is that there is no consensus on what to benchmark returns to. Three logical candidates have emerged: use Bitcoin only, use Ethereum as a proxy for altcoin returns, or use a market capitalization weighted index.
Asset management in crypto is hard because not only do fund managers need to be right on how much long or short exposure to have, they also need to be right on the mix and weighting of the assets in the portfolio. Cryptoassets tend to fall into certain market regimes where one of the three candidates vastly outperforms the others, and correctly predicting which regime we are in is one of the key alpha producing decisions a fund manager can make. Depending on which benchmark you decide to use to assess fund performance, the dispersion in returns can be so large between these three candidates that it can be tough to tell if a fund is outperforming or underperforming.

Source: Coin Metrics Reference Rates
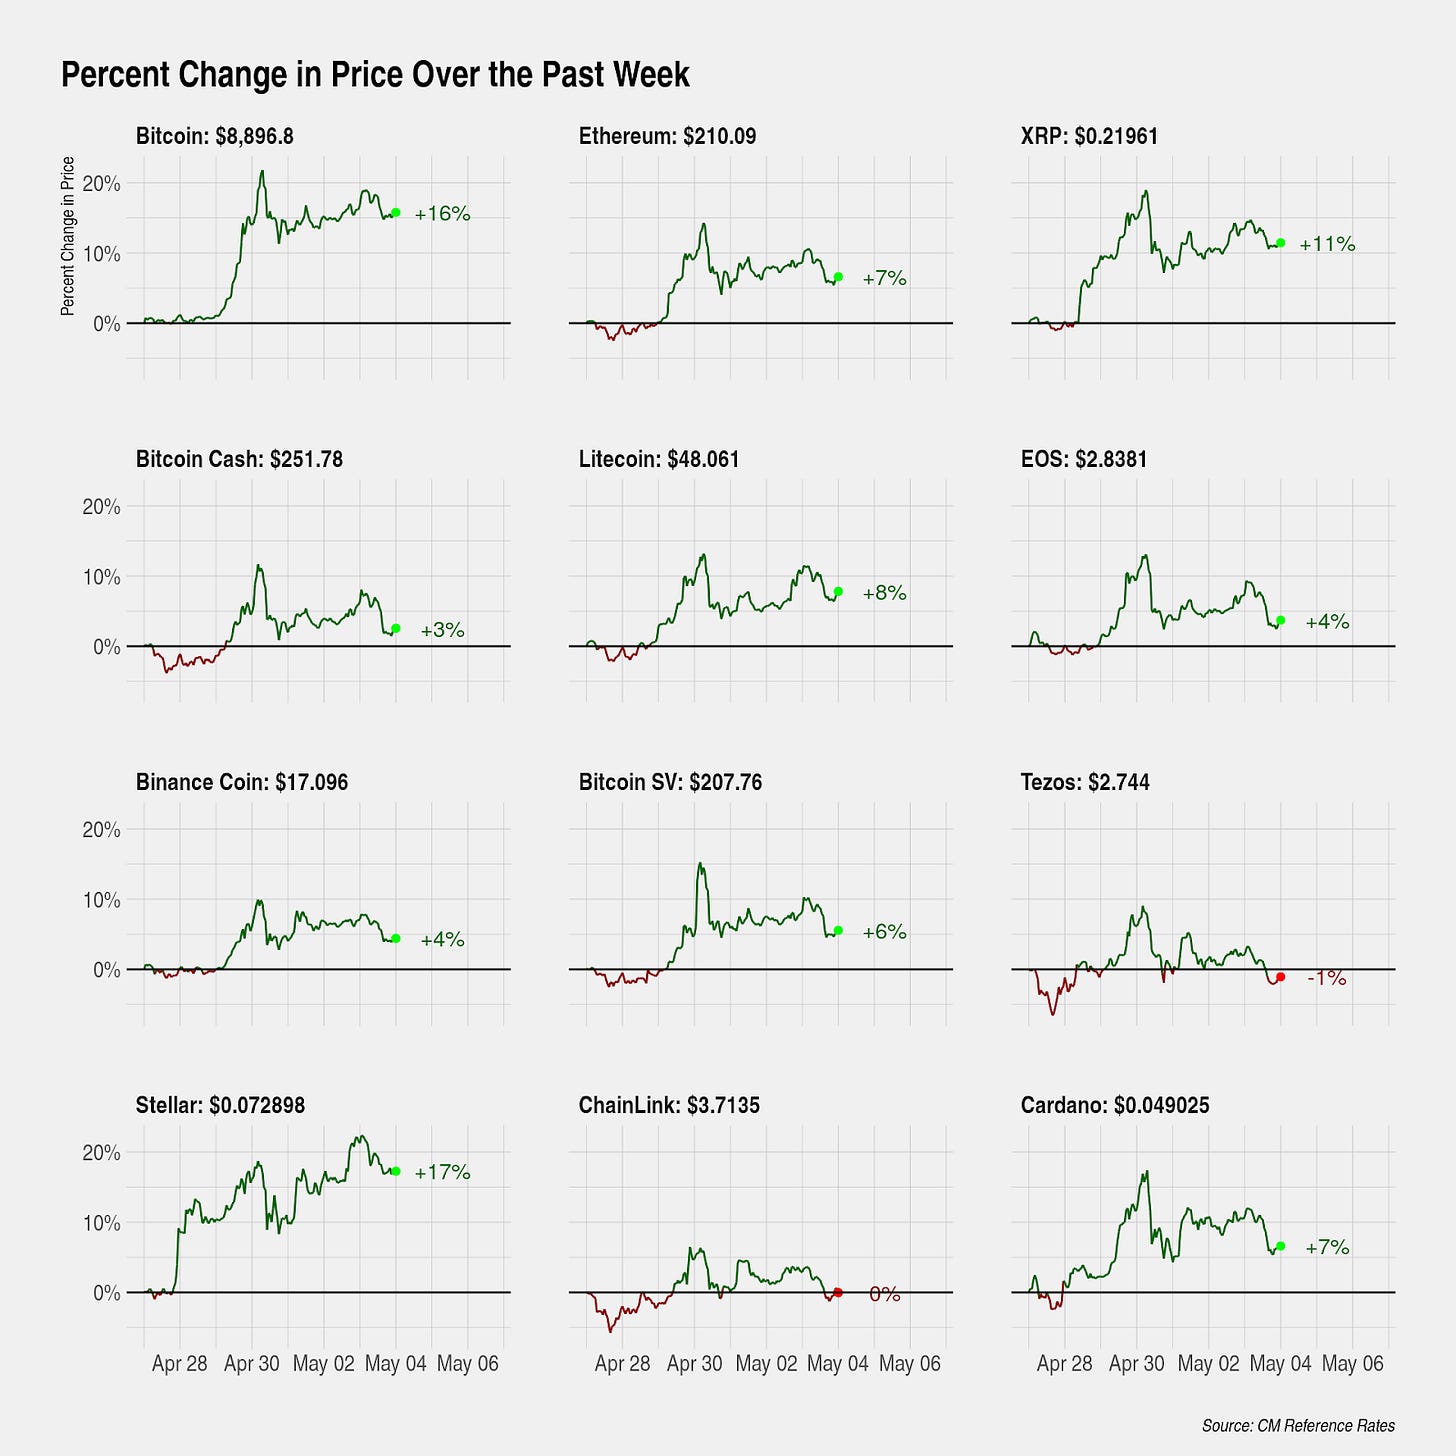
This previous week is one instance where Bitcoin (+16%) vastly outperformed most other large capitalization cryptoassets. For the past several months, Bitcoin, Ethereum, and the long tail of altcoins have more or less performed similarly, but we are starting to be in the phase of the cycle where large divergences could be possible.
During the last cycle that ended in January 2018, it was Bitcoin that led to first run up. After wealth was made in Bitcoin, capital was shifted to Ethereum and altcoins. Eventually, the bubble crashed in part because all remaining buyers were exhausted and because the launch of so many altcoins raised the global supply of cryptoassets to unsustainable levels.
Tether Market Share Grows
Many respected industry observers expected Tether to fail, but it continues to defy its critics. The most salient criticisms assert that Tether would eventually crumble under its own weight due to its lack of transparency, investigations by government regulatory organizations, and its troubled banking relationships.
What was underappreciated by the market is how these characteristics actually make Tether more useful to certain market participants. By operating in a legal gray zone and taking a stance that it will not operate in a regulatory-compliant and transparent manner, it has attracted all sorts of traders that need these protections. Tether issuance is through the roof and its lead in the stablecoin market is still unrivaled.
Here we show Tether’s volume market share for Binance. Back when Binance launched, most volume was still denominated in Bitcoin or Ethereum. We see some declines in Tether market share in late 2018 as competing stablecoins such as USD Coin and Paxos Standard launched. But since then, Tether has crowded out almost all other cryptoassets, and the trend shows no signs of slowing down.

Source: Coin Metrics Market Data Feed
CM Bletchley Indexes (CMBI) Insights
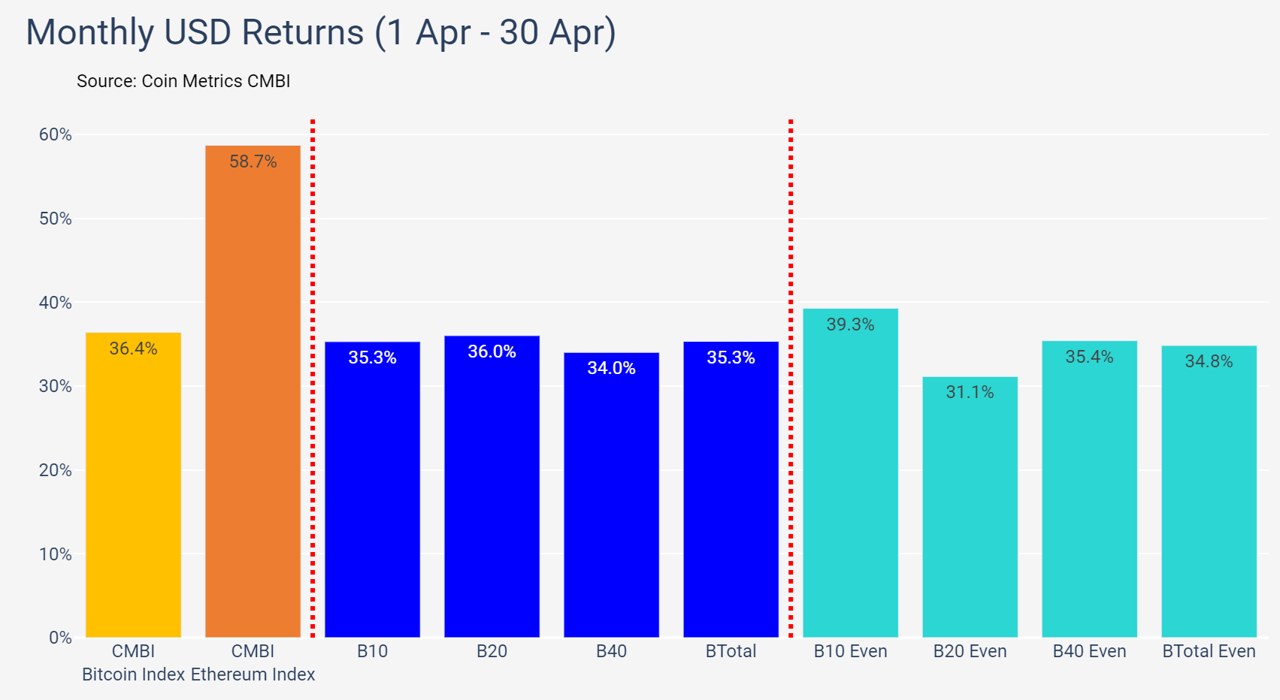
All CMBI and Bletchley Indexes had another good week off the back of continued global market strength. After a month of underperformance, the more risky low-cap assets performed the best this week, returning almost 13%. The CMBI Bitcoin Index and CMBI Ethereum Index also had strong weeks, returning 6.9% and 7.6% respectively.

After a March to forget, cryptoassets bounced back strong in May with an almost uncanny uniform performance across the top 70 assets, with the Bletchley 10, 20, 40 and Total all returning between 34% and 36%. However, it was the CMBI Ethereum Index that outpaced all other indexes, returning 58.7% in what was its second-best month in the past two years.

Coin Metrics Updates
This week’s updates from the Coin Metrics team:
Coin Metrics is hiring! Please check out our Careers page to view the openings.
As always, if you have any feedback or requests, don’t hesitate to reach out at info@coinmetrics.io.
Subscribe and Past Issues
Coin Metrics’ State of the Network, is an unbiased, weekly view of the crypto market informed by our own network (on-chain) and market data.
If you'd like to get State of the Network in your inbox, please subscribe here. You can see previous issues of State of the Network here.
Check out the Coin Metrics Blog for more in depth research and analysis.


