Coin Metrics' State of the Network: Issue 42 - Data Shows Cryptoasset Sell-off Was Driven by Short-term Holders
Tuesday, March 17, 2020
Get the best data-driven crypto insights and analysis every week:
Data Shows Cryptoasset Sell-off Was Driven by Short-term Holders
by Nate Maddrey and the Coin Metrics Team
On March 12th, amidst growing concerns over the COVID-19 pandemic, Bitcoin (BTC) suffered one of its largest one-day price drops in history. The rest of crypto followed, with most major assets down over 30% on the week.
Source: Coin Metrics Reference Rates
In this special edition of State of the Network, we take a deep dive into on-chain and market data to analyze the aftermath of the historic crash.
BTC & S&P Correlation Reaches New All-Time High
BTC’s historic price drop was concurrent with the equity markets’ worst day since 1987.
On March 12th, the Pearson correlation between BTC and the S&P 500 soared to a new all-time high of 0.52. The previous all-time high was 0.32. This suggests cryptoasset markets are becoming more intertwined with existing markets, and are reacting to external events more than we have ever seen before.
The following charts are sourced from our community charting tools which you can access for free here.
Source: Coin Metrics Community Data
Over the past week, BTC price has seemingly reacted to several key events, including President Trump’s announcement of a thirty day travel ban between the United States and Europe, as well as the Federal Reserve’s announcement that interest rates would be cut to 0.00%-0.25%.
Source: Coin Metrics Reference Rates
BTC Sellers Appear to Mostly be Short-term Holders
On-chain data shows that recent price movements were likely mostly driven by shorter-term and relatively new holders.
Coin Metrics’ revived supply tracks how many old coins come back into circulation after being untouched for a specific period of time. For example, thirty day revived supply tracks how much supply is moved on-chain (i.e. transacated) after being untouched for at least thirty days.
On March 11th, about 281k BTC that had been untouched for at least thirty days were revived. But only 4,131 BTC that had been untouched for at least one year were revived. This signals that a vast majority of the activity on March 11th and March 12th involved BTC that had been held for less than a year.
Source: Coin Metrics Network Data Pro
March 11th was the fourth largest spike in BTC thirty day revived supply over the last eight years.
Source: Coin Metrics Network Data Pro
But long term holders appear unfazed in spite of the severe market downturn. March 11th’s one-year revived supply was not unusually large, as seen in the below chart.
Source: Coin Metrics Network Data Pro
Transfer value days destroyed paints a similar picture. Transfer value days destroyed multiplies transfer value by the amount of days that the coins being transferred last moved on-chain. This gives older coins a much higher weight. For example, a coin that had not been transacted in 100 days is weighted 100x more than a coin that had been transacted 1 day ago.
There was not a significant spike in BTC transfer value days destroyed on March 11th or March 12th. This signals that there was not a relatively high amount of long-held coins moved prior to the recent price action.
Source: Coin Metrics Network Data Pro
Additionally, BTC SOPR dropped to 0.843 on March 12th, the lowest it’s been since February of 2012. In essence, SOPR is a network-wide indicator of profit/loss. It is the ratio of price sold (the price of BTC at the time new outputs are created) over the price paid (the price of BTC at the time a transaction’s inputs were created). Therefore a SOPR below one signals that investors are selling at a loss.
Source: Coin Metrics Network Data Pro
BTC MVRV Drops Below One
For only the fourth time in history, BTC market value to realized value (MVRV) dropped below 1.0. MVRV compares a cryptoasset’s market cap to its realized cap. Realized cap can be thought of as an estimation of the asset’s aggregate cost basis.
As we wrote about in State of the Network Issue 41, an MVRV above one can signal that speculators have a higher average market valuation than holders. An MVRV below one, on the other hand, can signal that holders have (or had) a higher market valuation than current speculators. Holders are tested when MVRV swings below one, as it becomes less and less likely they will be able to immediately sell their holdings at a profit.
BTC MVRV fell by 0.5 on the 12th, which is the largest one-day drop since December 2013. In hindsight, the past periods where MVRV dropped below one have been the best times to accumulate BTC at a relatively discounted price.
Source: Coin Metrics Network Data Pro
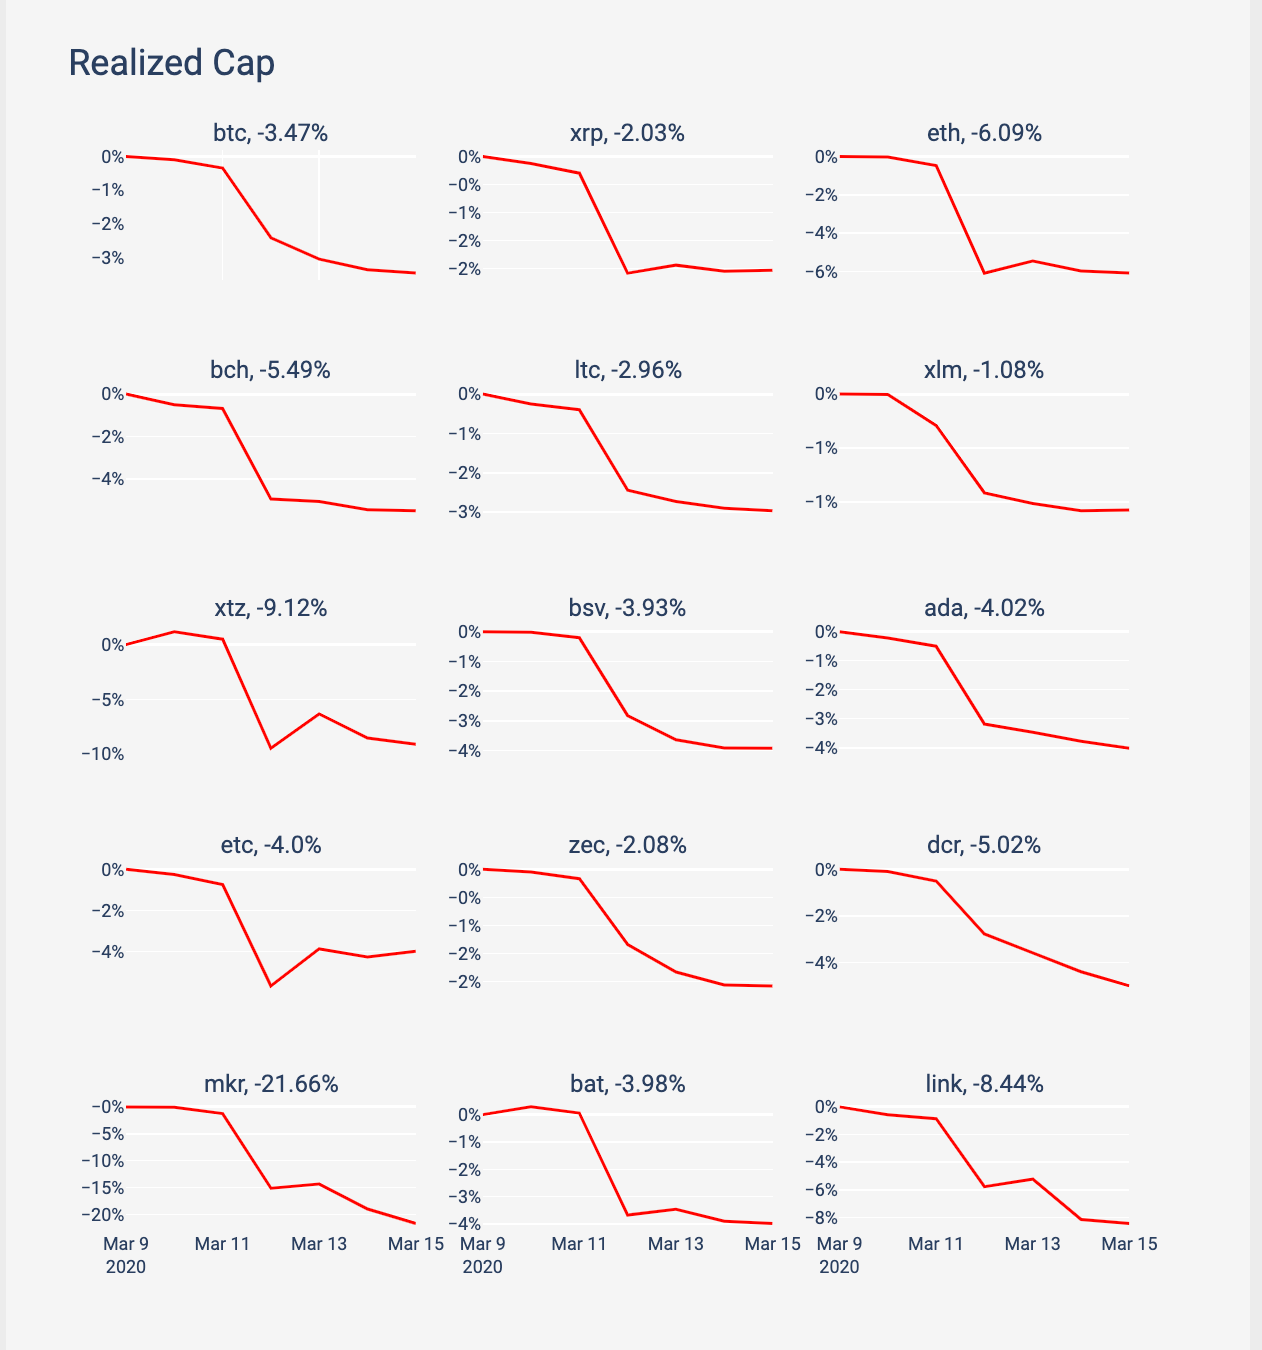
The large drop in MVRV was caused by BTC’s market cap dropping by over 30% since March 9th, while realized cap has only dropped by about 3% (again suggesting that older coins were not being sold).
Source: Coin Metrics Network Data Pro
Realized cap dropped for all major cryptoassets. Ethereum (ETH) and Tezos (XTZ) were hit especially hard, with 6.09% and 9.12% drops, respectively, since March 9th. Maker (MKR) was the biggest loser with a massive 21% realized cap drop after MakerDAO was forced to weigh an emergency shutdown after the drastic decrease in ETH price.

Source: Coin Metrics Network Data Pro
Money Pours Into Exchanges and Stablecoins
While market cap for most cryptoassets fell, the market cap for most stablecoins increased. This potentially signals that investors are piling into “cash,” or at least crypto cash equivalents.
Ethereum-issued Tether (USDT_ETH) market cap increased by about $300M from March 10th through March 15th. USD Coin (USDC), which is used on Coinbase as well as other platforms, also had a huge gain, growing close to $150M in market cap since March 10th.

Source: Coin Metrics Network Data Pro
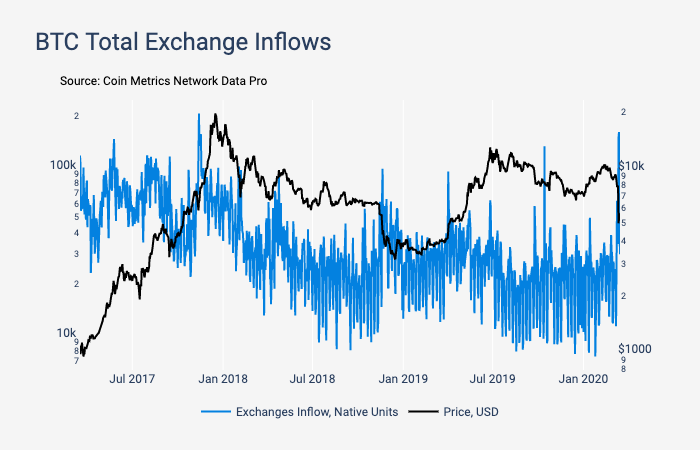
On March 13th, over 160k BTC flowed into the exchanges in our coverage universe, which includes Binance, Bitfinex, BitMEX, Bitstamp, Bittrex, Gemini, Huobi, Kraken, and Poloniex. This was the largest one-day inflow since November 13th, 2017.

Source: Coin Metrics Network Data Pro
Similarly, over 171k BTC flowed out of exchanges on March 13th, which was the largest daily total since November 2017.

Source: Coin Metrics Network Data Pro
BitMEX, which is a leading destination for futures trading, had the most inflows out of the exchanges in our coverage, with 43.2k and 37.5k of BTC inflow on March 12th and 13th, respectively.

Source: Coin Metrics Network Data Pro
Both Binance and Huobi, however, had more daily outflows than BitMEX.

Source: Coin Metrics Network Data Pro
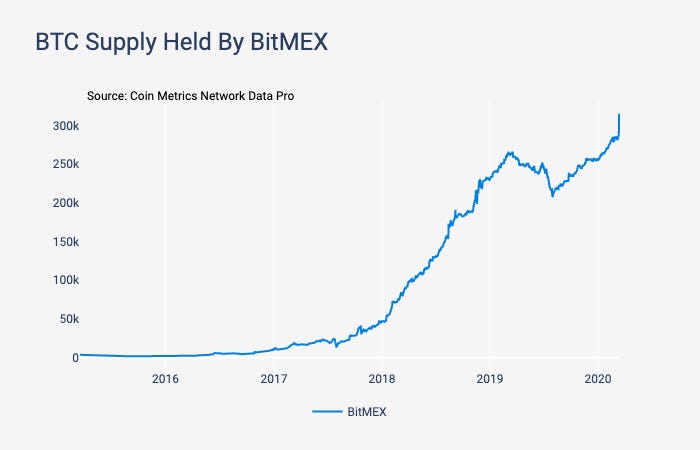
As a consequence, the amount of supply held by BitMEX soared to an all-time high. On March 13th, the amount of BTC held by BitMEX peaked at 315.7k.

Source: Coin Metrics Network Data Pro
A large spread of around 16% was observed between BitMEX and Coinbase during the sell-off. This is likely because forced liquidations from leveraged perpetual swap futures tend to exaggerate the direction of any move. The market recovered after BitMEX went down for 23 minutes reportedly due to unscheduled maintenance. BitMEX recently published an update detailing two DDoS attacks.

Source: Coin Metrics Market Data Feed
Conclusion
After a crazy week, the initial data from the aftermath is somewhat reassuring. Most of the sell-off appears to have been driven by relatively short-term holders, and longer-term holders seem to be holding strong, at least for now. BTC has also entered a historically attractive price zone, with an MVRV below one.
But the markets are still volatile, and it is unclear what lies ahead. We will continue to track events very closely through this unprecedented time, and will provide updates and new analysis over the upcoming weeks.
CM Bletchley Indexes (CMBI) Insights
All of the CMBI and Bletchley Indexes had a week to forget after global financial markets fell sharply on fears as to the impact COVID-19 may have on the broader economy. All indexes lost over a third of their value, with the CMBI Bitcoin Index falling 36% and the CMBI Ethereum Index falling 42%. Whilst this was a market wide capitulation, the large-caps were the ‘least’ impacted in a shocking week, as evidenced by the Bletchley 10’s positive performance against BTC and the negative performance of all other indexes against BTC.

Source: Coin Metrics CMBI Index
Coin Metrics Updates
This week’s updates from the Coin Metrics team:
This is a special edition of State of the Network as a response to the recent market crash. Regular State of the Network sections including Network Data Summary and Market Data Insights will be back next week.
Coin Metrics is hiring! We recently opened up 4 new roles, including Blockchain Data Engineer and Data Quality and Operations Lead. Please check out our Careers page to view the openings.
As always, if you have any feedback or requests, don’t hesitate to reach out at info@coinmetrics.io.
Subscribe and Past Issues
Coin Metrics’ State of the Network, is an unbiased, weekly view of the crypto market informed by our own network (on-chain) and market data.
If you'd like to get State of the Network in your inbox, please subscribe here. You can see previous issues of State of the Network here.
Check out the Coin Metrics Blog for more in depth research and analysis.


