Coin Metrics' State of the Network: Issue 85
Tuesday, January 12th, 2021
Get the best data-driven crypto insights and analysis every week:
Weekly Research Focus
Bitcoin Highs and Lows
By Nate Maddrey and the Coin Metrics Team
It was a crazy week for bitcoin and for the world. On January 6th the United States was thrown into civil unrest after Trump supporters stormed the Capitol Building. While historically bitcoin didn’t necessarily have a quick reaction to world events, that has changed over the last year. Bitcoin has increasingly shown immediate reactions to external events and Wednesday was no different.
At around 11:00 EST (16:00 GMT) Trump began to speak at his “Save America” rally in Washington DC, calling on the crowd to march on the Capitol. By 2:00 EST (19:00 GMT) reports began to surface that rioters were entering the Capitol Building. By 2:30 the Capitol breach escalated dramatically, with reports of tear gas being released within the building. Soon after, around 2:30 EST, bitcoin went into a temporary freefall. But at 3:15 it reached bottom and quickly started to rebound.
By 4:00 EST (21:00 GMT) bitcoin’s price surged towards new highs of $36.5K. At 6:00 EST a curfew went into effect in Washington DC, and the rioters mostly dispersed. By the end of the day bitcoin’s price would reach $37K. The following day it surged again, reaching $40K for the first time and setting a new all-time high.
Source: Coin Metrics Reference Rates
Bitcoin’s quick reaction to events on January 6th shows its continued maturation as an asset that responds to global events. It also potentially adds evidence to the narrative that bitcoin is sometimes viewed as a hedge against global unrest. But the run up to $40K also occurred on the tailwind of a strong run to start the year so it can be difficult to untangle the exact impact of January 6th’s events.
Crypto as a whole surged in the later half of the week. By Saturday, Ethereum reached over $1,300, close to its all-time high. But the run did not last for long. By Sunday, January 10th price began to tumble. BTC fell from over $40K on Saturday to less than $31K on Monday. Similarly, ETH’s price broke $1,320 on Saturday but dipped down to under $1,000 by Monday morning.
The dramatic price swing can be seen in the weekend’s futures liquidations. The following chart shows ETH perpetual contract liquidations from January 9th through 11th. The blue “buys” represent short sellers who were forced to cover their positions and the orange “sells” are margin traders who were forced into selling their long positions due to large losses.
As ETH price ramped up between $1,200 and $1,300, a cluster of short sellers were forced out of their positions. But as price began to fall back down an even larger amount of longs were liquidated. The selloff became especially painful in the $1,100 - $1,000 range, which contributed to the further price collapse.
Source: Coin Metrics Market Data Feed
But despite the rapid price action, fundamentals still look strong. Amidst the price volatility Bitcoin and Ethereum hash rate are both at all-time highs. This signals that network security is healthy, and that miners continue to support both networks.
Source: Coin Metrics Network Data Charts
Active addresses for both BTC and ETH are also both near all-time highs. We define active addresses as the daily number of unique addresses that either send or receive a transaction.
Active addresses are often used as a way to measure overall blockchain usage. However, it’s important to note that one active address does not necessarily equate to one active user. Individual users can create and operate multiple addresses, and a single address may belong to multiple users. But with that in mind, active addresses serve as a good proxy for overall usage. The increase in BTC and ETH active addresses signals that on-chain activity is increasing for both networks.
Source: Coin Metrics Network Data Charts
Lastly, the amount of addresses holding at least 1,000 BTC has increased significantly since the start of 2021. Addresses holding large amounts of BTC can be seen as a proxy for institutional adoption (although the same caveats as above apply). This large jump in addresses holding at least 1,000 BTC is potentially further evidence that institutions are here to stay.
Source: Coin Metrics Network Data Charts
It has already been a crazy start to the year for crypto, and things are bound to get crazier. But overall, bitcoin and the rest of crypto is still in a relatively strong position and is ready to keep growing throughout 2021.
Network Data Insights
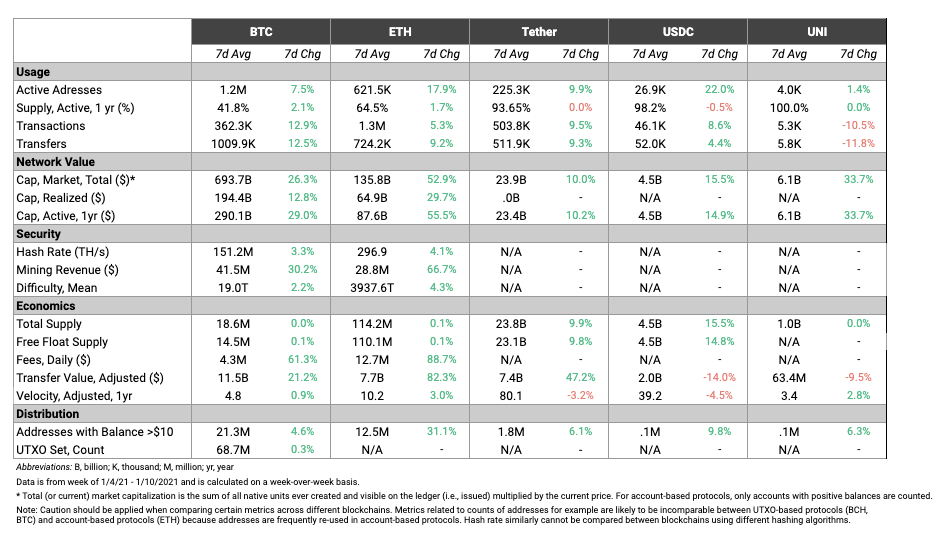
Summary Metrics
Source: Coin Metrics Network Data Pro
Most network metrics were positive on the week despite the dip over the weekend. In addition to hash rate and active addresses, adjusted transfer value has reached new all-time highs for both BTC and ETH. ETH in particular had a huge surge, with adjusted transfer value growing 82.3% week-over-week.
ETH transaction fees have also climbed to new all-time highs. Total fees increased over 88% on the week, for a daily average of $12.7M. ETH daily fees are now almost three times as much as BTC’s, signaling high demand for usage on the Ethereum blockchain.
Network Highlights
The balance of power between major crypto exchanges has shifted since early 2020. Binance now holds more BTC than any other exchange in our coverage, which includes all of the major exchanges except for Coinbase. The BTC holdings of Huobi, BitMEX, and Bitfinex have all dropped dramatically over the past year, after all three exchanges faced various investigations and legal issues.
Source: Coin Metrics Network Data Charts
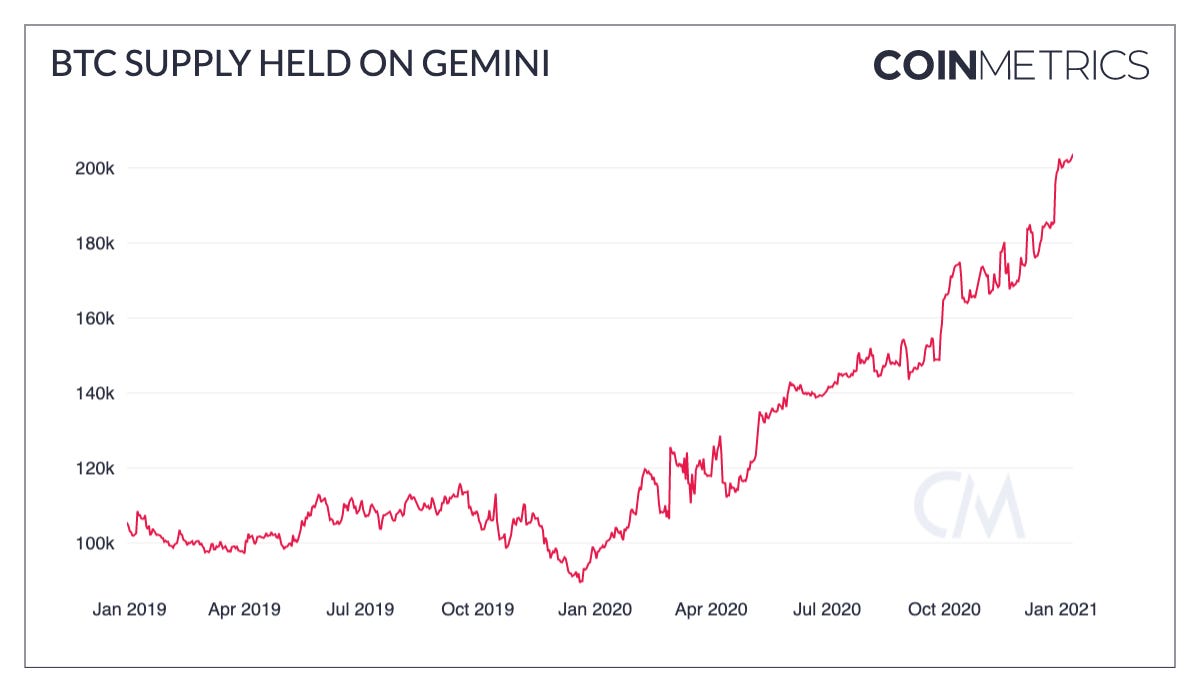
Gemini appears to be one of the big winners going into 2021. The amount of BTC held on Gemini has doubled since January 2019.
Source: Coin Metrics Network Data Charts
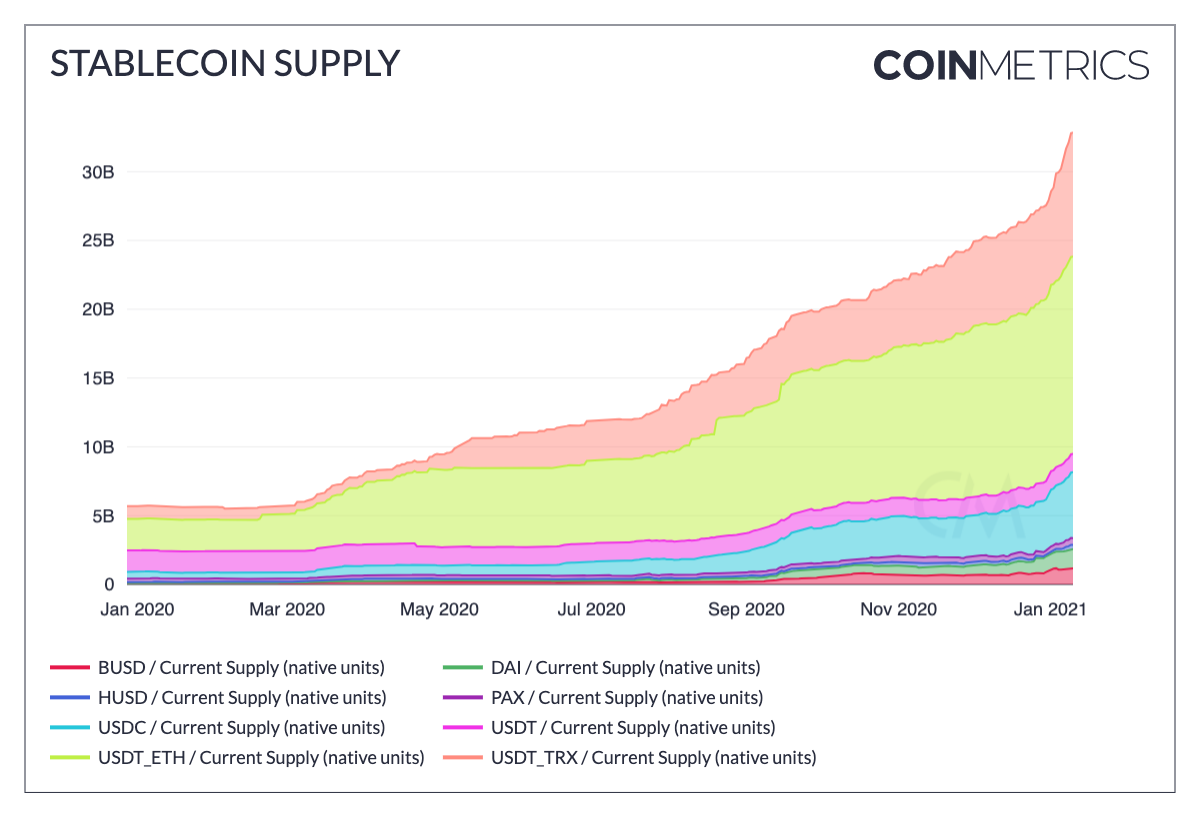
Stablecoins are back on the rise. Total stablecoin supply has already grown by more than 4 billion since January 1st, 2021. Much of that growth has come from Tether - specifically, Tether issued on Tron(USDT_TRX), which has grown by over 2 billion since the start of the year.
Source: Coin Metrics Network Data Charts
But Tether isn’t the only stablecoin that has gotten off to a quick start in 2021. USDC supply has grown by over 500 million since the start of the year. Total USDC supply is quickly approaching 5 billion.
Source: Coin Metrics Network Data Charts
As a result, Tether’s share of total stablecoin supply is decreasing. Although Tether is still by far the most dominant stablecoin, it’s down to only about 75% of the total market. This is its lowest share of total supply since January 2019.
Source: Coin Metrics Network Data Charts
Coin Metrics Updates
This week’s updates from the Coin Metrics team:
We’re excited to announce the new Coin Metrics mobile app. View real-time cryptoasset pricing and relevant on-chain data in a single app! Download for free here: https://coinmetrics.io/mobile-app/
As always, if you have any feedback or requests, don’t hesitate to reach out at info@coinmetrics.io.
Subscribe and Past Issues
Coin Metrics’ State of the Network, is an unbiased, weekly view of the crypto market informed by our own network (on-chain) and market data.
If you'd like to get State of the Network in your inbox, please subscribe here. You can see previous issues of State of the Network here.
Check out the Coin Metrics Blog for more in depth research and analysis.


