Coin Metrics' State of the Network: Issue 58
Tuesday, July 7th, 2020

Weekly Feature
When Markets Misalign: Mispricings and Reference Rates
by Karim Helmy and the Coin Metrics Team
Key Takeaways
Price discrepancies between exchanges can emerge for a variety of reasons, including market manipulation, exchange downtime, and trader error. These dislocations are aggravated by market inefficiencies that may prevent arbitrage.
While market dislocations are particularly common for small exchanges and illiquid assets, even liquid markets on major exchanges are impacted reasonably often. The presence of market dislocations makes relying on price feeds from a single exchange unreliable for portfolio valuation and contract settlement.
Creating reference rates that are robust to market dislocations is surprisingly complex. Coin Metrics offers Hourly and Real-Time Reference Rates for many of the assets covered by the CM Market Data Feed.
Messy Markets
Liquidity in cryptocurrency markets is fragmented across a handful of major exchanges and scores of minor ones. Due to market inefficiencies, manipulation, and trader error, prices on these exchanges often diverge, with at least one venue mispricing the asset and failing to reflect the global market price. This issue is especially acute for illiquid and smaller-capitalization assets, which may have weaker settlement assurances and are more prone to manipulation.
Beyond creating arbitrage opportunities, this lack of a robust cardinal market price leads to difficulties in portfolio valuation and contract settlement. Derivatives like futures and options require a price against which to settle, necessitating the use of a reference rate that accurately reflects the conditions across markets.
To address the growing need for cardinal prices, Coin Metrics has developed Hourly and Real-Time Reference Rates for many of the assets covered by the CM Market Data Feed. These rates calculate the market price of an asset against a lookback period of one hour and one second, respectively, combining data from several marketplaces to create a price feed that is robust against market inefficiencies. Our live reference rates are available as part of our free community data.
Ineffective Inefficiency
Markets are typically modeled as efficient, reflecting in their prices all known information. In an efficient market, mispricings tend to be short-lived, since any price discrepancies are closed through arbitrage. These markets are said to obey the law of one price, which argues that identical goods should be sold for the same price across marketplaces.
In the presence of transaction costs and operational risks, however, even rational markets may not behave efficiently. In an inefficient market, price divergences may be sustained so long as friction persists.
The most substantial sustained price dislocation in the cryptoasset market has been between spot prices on Bitfinex and on other exchanges. Due to concerns over the exchange’s solvency, Bitcoin on Bitfinex has frequently traded at a premium to the rest of the market, most prominently during late 2018 and early 2019.
Since the spread was first observed by Coin Metrics in April of 2017, Bitfinex’s BTC/USD market has not been factored into Coin Metrics’ Hourly or Real-Time Reference Rates. A snapshot from a typical trading day in late 2018 shows a spread of about 1.3% between the Bitfinex BTC/USD market and the markets used to compute these rates.

Source: Coin Metrics Reference Rates, Coin Metrics Market Data Feed
In addition to concerns over a counterparty’s cash flows, dislocations may be sustained due to concerns over the settlement assurances of the asset being traded.
The primary function of a public blockchain is to provide a settlement layer for the transfer of assets, and the proper execution of this function requires that transactions be probabilistically irreversible given a sufficient number of confirmations. This immutability can be compromised in several ways, most infamously through 51% attacks, in which an attacker with control of the majority of a network’s hashpower reorders the blockchain.
Recipients of poorly-secured assets may therefore require a large number of confirmations in order to recognize a transfer as valid. Exchange operators must be particularly cautious, due to the volume of deposits they receive and therefore stand to lose in the event of a reorganization. This has led exchanges to raise the wait time and number of confirmations required to deposit some assets. Increased wait times, in turn, increase the amount of risk taken on by traders seeking to profit from market inefficiencies in these assets, aggravating existing illiquidity and potentially leading to sustained market dislocations.
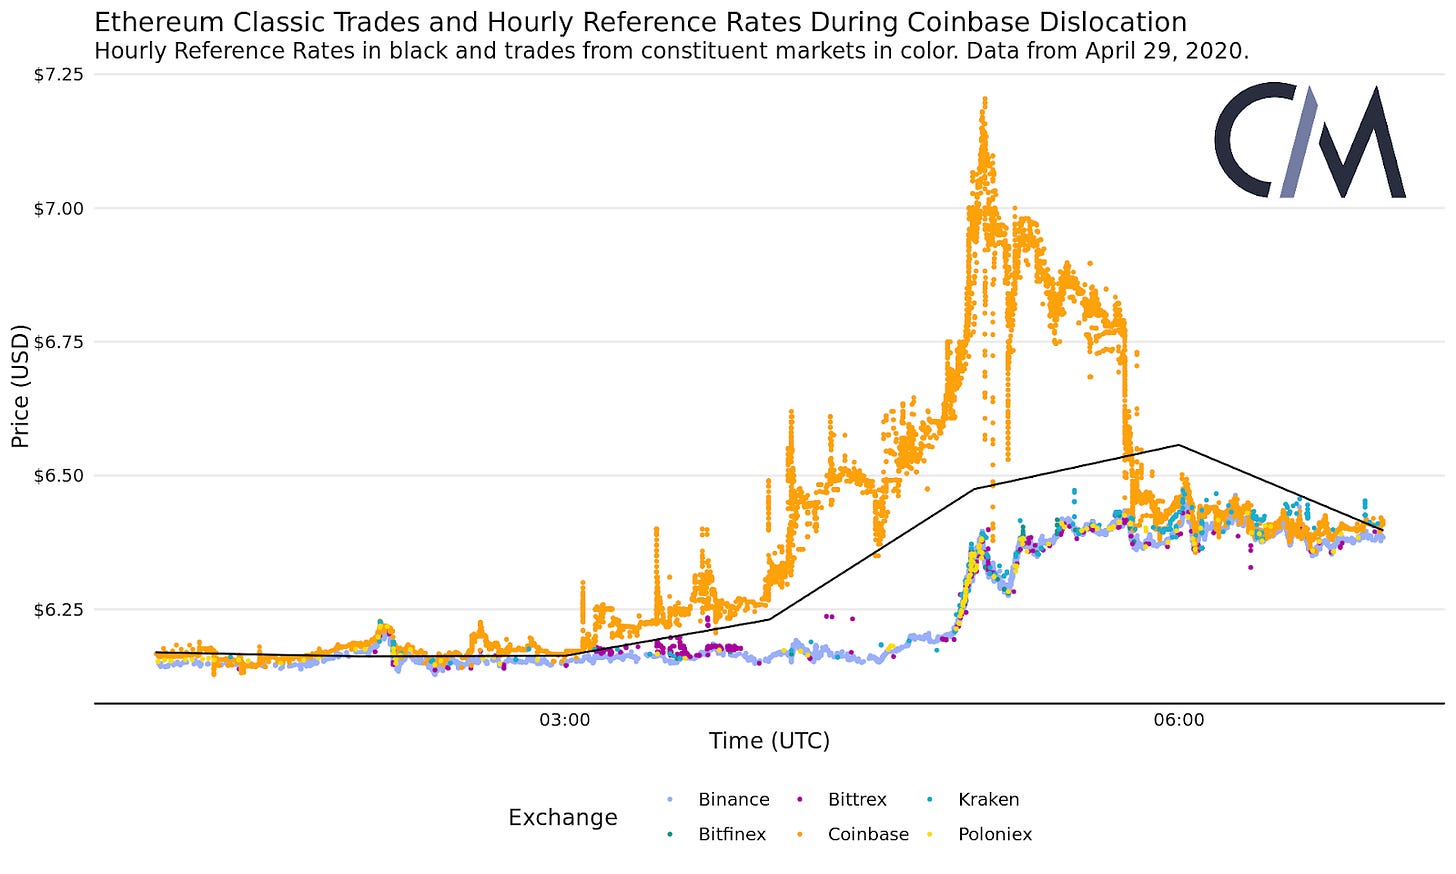
The most notable incident of this type occurred on April 29, 2020, when Coinbase’s Ethereum Classic (ETC) markets diverged significantly from those on other exchanges. The dislocation was wide and lasted several hours, in part due to the large number of confirmations required by exchanges for ETC deposits following several 51% attacks on the chain.

Source: Coin Metrics Reference Rates, Coin Metrics Market Data Feed
Complicating this dislocation is the fact that Coinbase is the primary marketplace on which ETC is traded, reducing clarity on which price should be considered the market price and highlighting the need for transparently calculated reference rates.
Capital controls are another source of market friction, introducing barriers in foreign exchange markets that have echoes in cryptocurrency markets. These barriers were largely responsible for the so-called “Kimchi premium” between spot markets quoted in Korean won and those quoted in other fiat currencies.
Capital controls fall into the broader category of restrictions on fiat transfers that impact liquidity in cryptocurrency markets. Delays in fiat deposits or withdrawals caused by exchange downtime or strained relationships with banking partners are another, related source of friction.
Because supply and demand are not guaranteed to be homogeneous across exchanges, prices can diverge in an inefficient but rational market. In reality, market participants are prone to error and irrationality, introducing further sources of misalignment.
Fat Fingers
In one common type of error, known as a fat-finger error, a trader mistakenly submits an incorrectly typed trade. These errors may result in flash crashes, or rapid downward market movements that are quickly corrected.
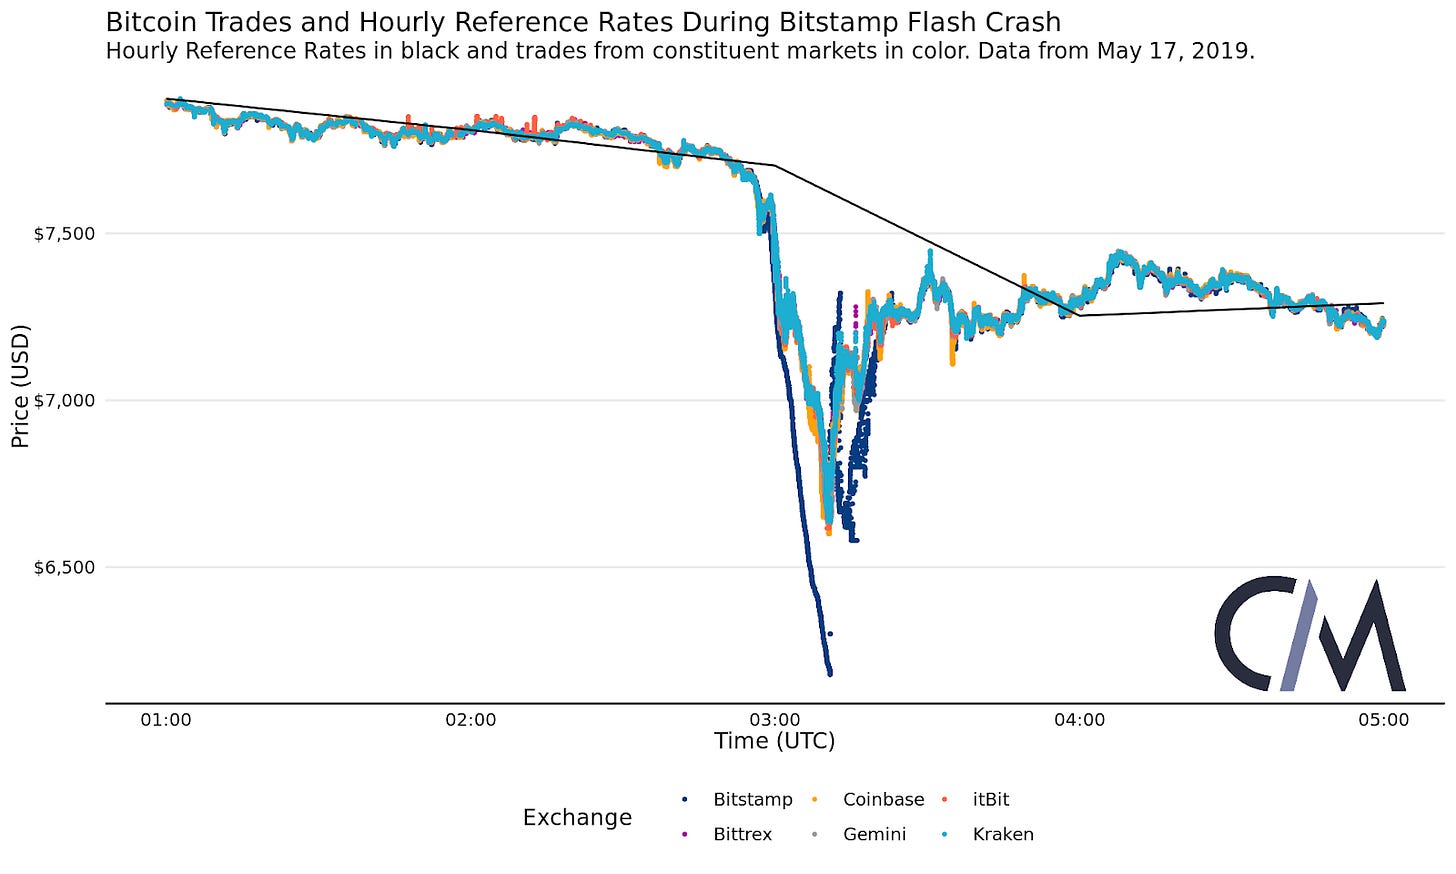
On May 17, 2019, the Bitcoin market experienced a flash crash caused by a single large sell order that may have been placed in error. The effects of the crash were felt particularly strongly on Bitstamp, the exchange where it originated.

Source: Coin Metrics Reference Rates, Coin Metrics Market Data Feed
As a result of their long computation window, Coin Metrics’ Hourly Reference Rates were unaffected. Coin Metrics’ Real-Time Reference Rates correctly tracked the market price, excluding the additional downward movement on Bitstamp.

Source: Coin Metrics Reference Rates, Coin Metrics Market Data Feed
Continue Reading
Continue reading “When Markets Misalign” here.
Network Data Insights
Summary Metrics

Source: Coin Metrics Network Data Pro
Despite a drop in market caps, it was a relatively good week for Bitcoin (BTC) and Ethereum (ETH) fundamentals. BTC security is looking healthy, with hash rate and mining revenue both increasing. Hash rate grew by 6.6% week-over-week and should soon pass pre-halving levels.
ETH transactions dropped by 3.5% week-over-week, while BTC transactions grew by 3.7%. But despite the dip in transactions, ETH active addresses increased by 8.1%, compared to a 5.8% increase for BTC. The reasons for ETH’s continued active address growth are explored in this week’s Network Highlights.
Network Highlights
ETH had over 500K active addresses each of the last seven days. This has only happened during one other period in ETH’s history - January 2018, when ETH’s price soared to new all-time highs of over $1,400. The current active address surge, however, is not driven by an ETH price peak, as ETH’s price has remained under $250 since February. Instead, it appears to be driven by rapid growth of Ethereum-based stablecoins and decentralized finance (DeFi).
ERC-20 tokens, which are issued on the Ethereum blockchain, can be used as a proxy to measure activity on Ethereum. Although far from a full picture, the activity of popular ERC-20s can shed light on the usage trends of the overall network.
The following chart shows active address counts for three Ethereum-issued stablecoins: Tether (USDT_ETH), USD Coin (USDC), and Paxos (PAX). All three have seen large increases in active addresses since March, with USDT_ETH leading the way by a huge margin.
But despite the fast growth, USDT_ETH active addresses appear to have peaked in June (at least temporarily), and are decreasing entering July. PAX active addresses also peaked in early June and have been decreasing since. However, not all stablecoins are declining. USDC active addresses have grown relatively steadily since March and are now reaching new all-time highs.

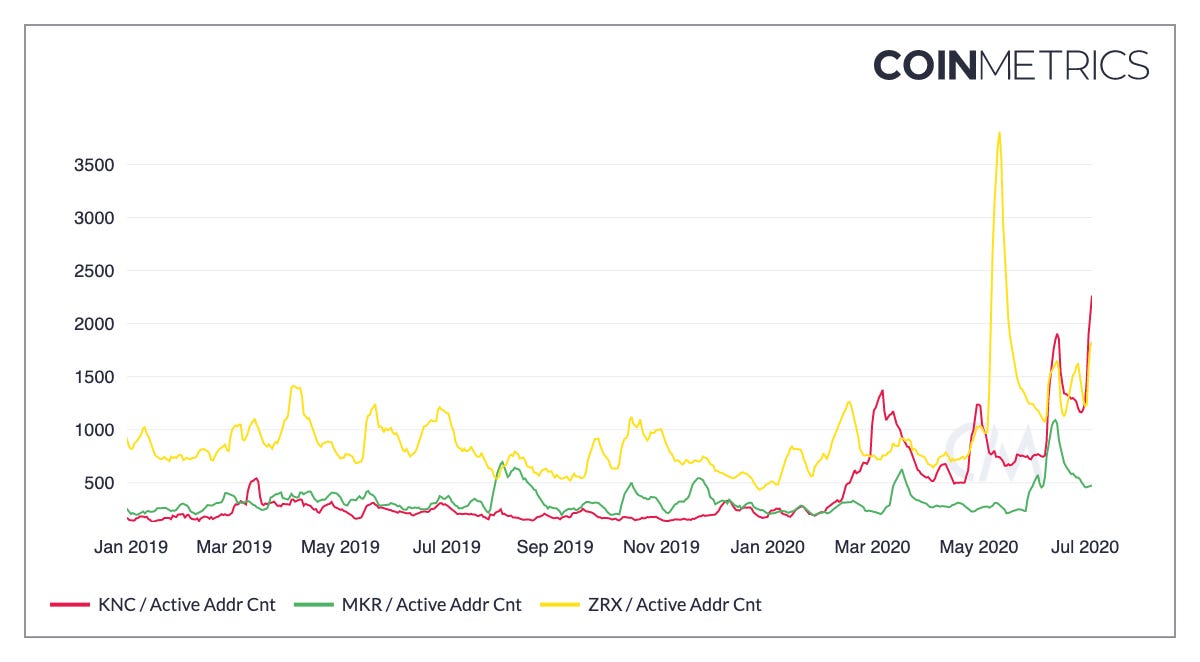
Below we look at three DeFi related ERC-20 tokens: 0x (ZRX), Maker (MKR), and Kyber Network (KNC). KNC is hitting new all-time highs entering July in anticipation of its Katalyst and KyberDAO updates which will introduce new staking rewards - once the update goes live KNC holders will be able to participate in protocol governance by staking their tokens, while earning ETH rewards in return. ZRX active addresses are also growing in early July after a large spike in May. MKR addresses have declined since a peak in mid-June, but are still relatively elevated.

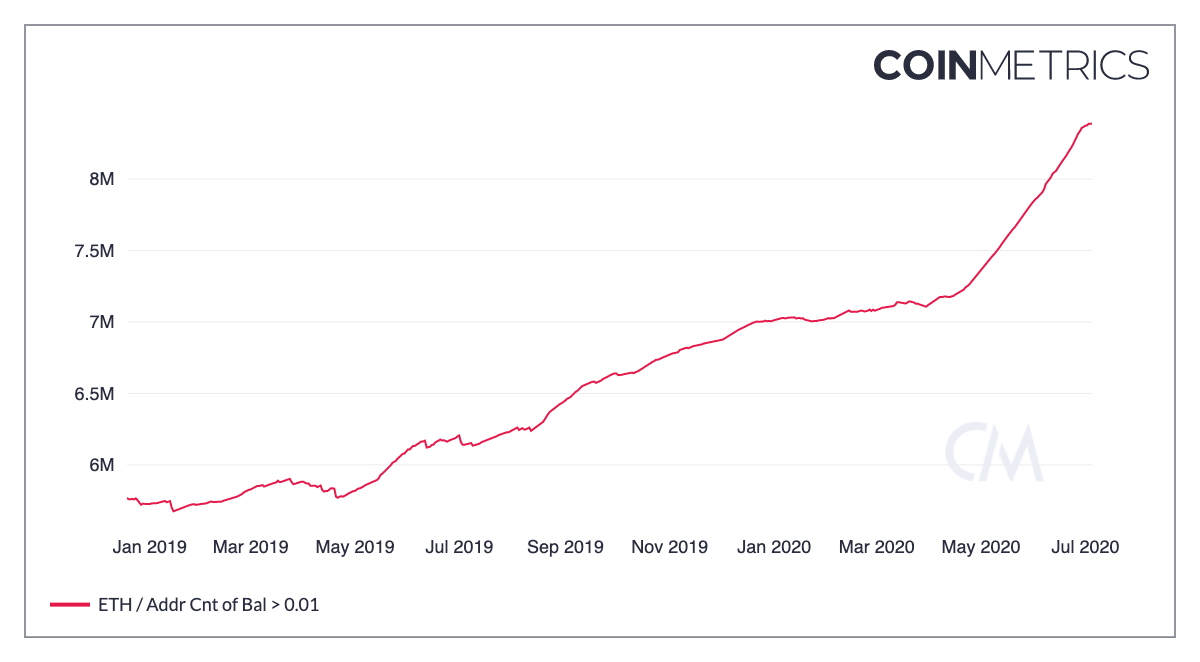
In addition to a surge in active addresses, the number of addresses holding at least 0.01 ETH has shot up since April. On April 1st there were 7.12M addresses holding at least 0.01 ETH. By July 1st there were over 8.37M, a growth of about 1.25M addresses.

Market Data Insights
Over the past 3 months we have entered a period of consistent correlation between the S&P 500’s daily returns and Bitcoin’s daily returns. This is a trend worth noting due to the fact that immediately prior to the sell off in March the markets were negatively correlated.

This is not the first time that the two markets have become positively correlated, although it has been one of the longest and most stable correlations. Below we take a look at the 30 and 90 day correlations of the two markets dating back to January 2015. Following the sell off in March, we reached a level of 90 day correlation of above 0.4. Since then, correlation has remained above 0.3 for the longest duration to date.

A positive correlation between these asset classes is largely due to the swift selloff and sustained recovery following the market reactions surrounding COVID-19. Many attribute this risk-off in both assets to the general sentiment that ‘in a selloff, the beta of all assets goes to 1’ also applies to Bitcoin. This period is making some individuals focusing on the Bitcoin industry nervous as Bitcoin’s prior lack of correlation with the broader equity market is often touted as one of its greatest selling points. Only time will tell if correlation returns to pre-March levels or remains elevated for a longer period.
CM Bletchley Indexes (CMBI) Insights
Another relatively flat week for most of the CMBI and Bletchley Indexes. The Bletchley 20 (mid-cap assets) experienced the strongest returns, finishing the week up almost 10%. This performance is largely due to the performance of Cardano, The B20’s highest weighted constituent, which finished the week up almost 20%.
The CMBI Bitcoin Index and CMBI Ethereum Index finished the week down slightly, returning -1.1% and -0.2%, respectively. Index volatility continues to trend down towards a historically low range, with both the CMBI Bitcoin Index and the CMBI Ethereum Index returning less than ±2.5% for each of the previous five weeks.

Coin Metrics Updates
This week’s updates from the Coin Metrics team:
Coin Metrics is hiring! Please check out our Careers page to view the openings.
As always, if you have any feedback or requests, don’t hesitate to reach out at info@coinmetrics.io.
Subscribe and Past Issues
Coin Metrics’ State of the Network, is an unbiased, weekly view of the crypto market informed by our own network (on-chain) and market data.
If you'd like to get State of the Network in your inbox, please subscribe here. You can see previous issues of State of the Network here.
Check out the Coin Metrics Blog for more in depth research and analysis.
