Coin Metrics' State of the Network: Issue 8
Tuesday, July 16, 2019

Intro and Updates
Dear crypto data enthusiasts,
Welcome back to this week’s edition of Coin Metrics’ State of the Network, an unbiased, focused view of the crypto market informed by our own network (on-chain) and market data.
This week’s housekeeping items:
Coin Metrics’ legacy Community API was deprecated on July 15th and replaced with our new Community API. If you are an existing legacy Community API user, you must switch to the new API. You can find more info here.
Coin Metrics is hiring! Please check out our Careers page to view the openings.
As always, if you have any feedback or requests, don’t hesitate to reach out at info@coinmetrics.io.
Weekly Feature
A Majority of BSV Transactions are Coming From a Weather App
Recently, we have been researching the on-chain activity of Bitcoin (BTC), Bitcoin Cash (BCH), and Bitcoin SV (BSV) as part of an upcoming report on Bitcoin forks. As part of that research, we found that over 94% of daily BSV transactions (as of July 14th) are being generated by a weather app.
BSV’s overall transaction count has been growing. The following chart shows the total daily transaction count for BTC, BCH, and BSV (on a log scale):

However we found that a majority of these transactions include OP_RETURNS.
OP_RETURN is a Bitcoin script opcode that is commonly used to write arbitrary data onto the blockchain. Any outputs with OP_RETURNS are unspendable. Therefore OP_RETURNS can be used to record metadata on-chain, but cannot be used to effectively exchange value.
BSV transactions are increasingly including OP_RETURNS. The below chart shows the daily count of BSV transaction with OP_RETURN, vs BSV transactions without OP_RETURN:

On July 14th, over 96% of BSV transactions included an OP_RETURN:

Any app or user can use OP_RETURNS to record arbitrary data on-chain, for a variety of different reasons. A large portion of BSV’s OP_RETURNS, for example, come from a weather app called “WeatherSV.” WeatherSV records and retrieves climate data on the BSV ledger. According to the WeatherSV website, a weather channel “can be activated for $5 AUD and includes approximately 142 days of hourly broadcasts, based on current fees.”
The following chart shows the percent of total BSV OP_RETURN transactions sent by individual applications. Since May, a majority of BSV OP_RETURN transactions have been sent by WeatherSV:

In fact, a majority of BSV’s overall transactions (including transactions with and without OP_RETURNS) are now coming from WeatherSV. As of July 14th, over 94% of all BSV transactions are being sent by WeatherSV:

We will be releasing more on this and comparing BSV directly to BTC and BCH in our upcoming report on Bitcoin forks.
Network Data Insights
Summary Metrics

BTC’s realized cap continued to rise over the last week (realized cap is calculated by valuing each unit of the supply at the price at the last time it moved on-chain). After hitting an all-time high on July 9th, BTC realized cap reached another all-time high of $93.55B on July 13th. Realized cap represents a proxy of the total amount of USD currently invested in an asset, so its growth represents a positive signal for the overall market.
BTC, ETH, and LTC adjusted transfer value (which we define as the USD value of the sum of native units transferred that day removing noise and certain artifacts like self-sends or deliberate spammy behavior) bounced back this week, after being down 21%, 40%, and 61%, respectively, the previous week.
Total transactions, however, fell by 6% for both BTC and ETH. This is likely what led to a decrease in daily transaction fees for each; more transactions leads to fuller blocks, which leads to higher fees.
Network Highlights
BCH and BSV’s combined hash rate as a percentage of total Bitcoin-related hash rate reached a 2019 low on July 12th. BCH and BSV combined now have 5% of the total hash rate between the three assets (BTC, BCH, and BSV).

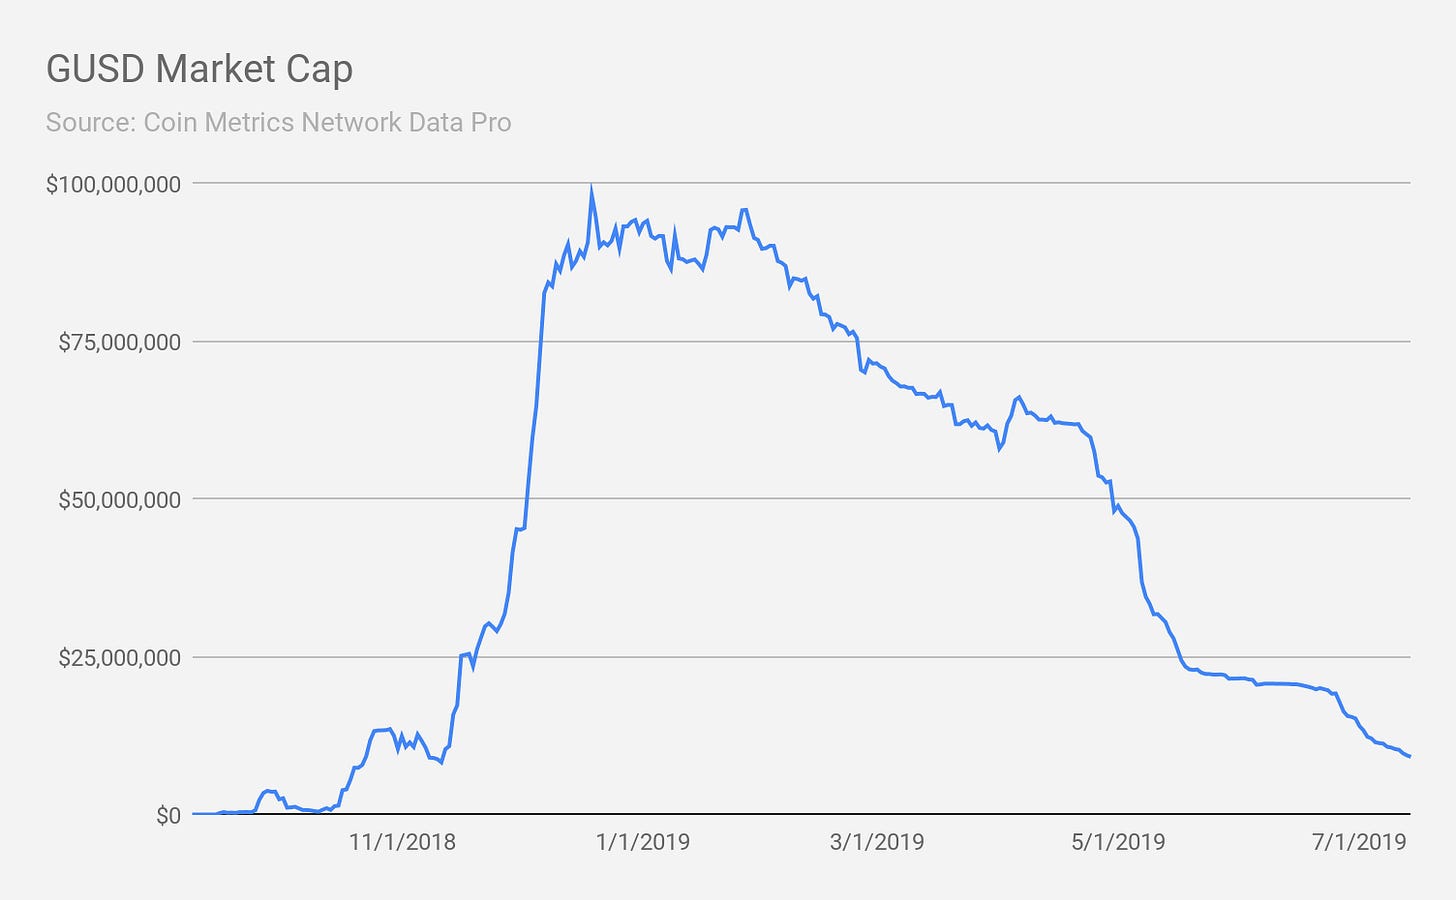
Gemini Dollar’s (GUSD) market cap continues to plummet. It fell to $9,148,128 on July 14th, which is its lowest since November 11th, 2018:

Market Data Insights
On July 14, 2019, a sharp decline in Bitstamp’s ETH-USD was observed that resulted in a $60 spread in dollar terms (equivalent to a 25 percent spread) between Bitstamp and other major exchanges. This event has many similarities to a similar market movement on Bitstamp’s BTC-USD market on May 17, 2019. Although one possible explanation is trader error, this event is more likely another example of deliberate selling designed to trigger forced liquidations on long futures positions, margin calls on long margin positions, and stop losses on spot markets.

Bitstamp is one of three constituents in BitMEX’s Ethereum price index which is the price index that BitMEX’s Ethereum perpetual futures contract is priced on. Due to the presence of up to 100x leverage on BitMEX (and other exchanges that offer cryptocurrency futures products) and the outsized impact that futures products have on spot markets, the incentive to engineer price movements is clear. During a three minute window between 09:51 and 09:54, a total of 10,186 Ethereum was market sold, clearing the order book, and causing a large spread between Bitstamp’s market and other major exchanges. This quantity of Ethereum only amounts to approximately $2.7 million in U.S. dollar terms using prices immediately prior to the event.
Since Bitstamp’s ETH-USD is one of three constituents in BitMEX’s price index, the sudden drop in price caused roughly $17 million in notional value to be forcibly liquidated on BitMEX’s ETH-USD perpetual futures contract. More troubling is that this engineered price movement seemed to be a catalyst of a broader market sell-off which affected other assets including Bitcoin. Major BTC-USD markets simultaneously sold off during this time including forced liquidations of roughly $60 million in notional value in BitMEX’s BTC-USD perpetual futures contract. The overall market would continue to sell-off through the remainder of the day with Bitcoin momentarily reaching below $10,000.

The chain of causation is not immediately clear and there may be some confounding factors, but the following is one possible explanation. Ethereum, along with Bitcoin and Tether, consist of the three major quote-currencies across exchanges in markets for smaller assets. When there is a sharp decline in Ethereum prices, particularly on Bitstamp, smaller assets that are quoted in both Bitcoin and Ethereum present a momentary arbitrage opportunity – the asset is relatively cheap in the Ethereum-quoted market and relatively expensive in the Bitcoin-quoted market. Market participants can capitalize on this opportunity by buying Ethereum using U.S. dollars, selling it for the smaller asset, then selling it for Bitcoin, and selling Bitcoin for U.S. dollars (causing market-wide selling pressure). Since both Bitcoin and Ethereum serve the critical position of major quote-currencies in cryptocurrency markets, weakness in one asset’s U.S.-quoted market can spill over to the other.
An alternative explanation is the nature of BitMEX’s perpetual futures contracts. BitMEX is an exchange that only accepts Bitcoin deposits, and Bitcoin is the only currency that can serve as margin for all futures contracts, regardless of the underlying. BitMEX also offers two types of margin: isolated margin and cross margin. Isolated margin assigns margin to a specific position – maximum losses associated with this specific position are limited to this margin amount. Cross margin, on the other hand, utilizes the full amount of funds in the account, and this margin is shared between all positions. Cross margin is the default margin selection. Therefore, traders on BitMEX who have leveraged long positions on both the BTC and ETH perpetual futures contract with cross margin selected are susceptible to simultaneous forced liquidations in both contracts when one of the assets suddenly drops in price. These forced liquidations places selling pressure on the underlying and can in turn trigger further forced liquidations as the price declines, even if the trader has selected isolated margin.

This market movement is the first known instance that Ethereum markets were targeted. This and the similar market movement on May 17, 2019 (shown above) are perhaps the clearest indication that market participants are intentionally engineering price movements.
CM Bletchley Indexes (CMBI) Insights
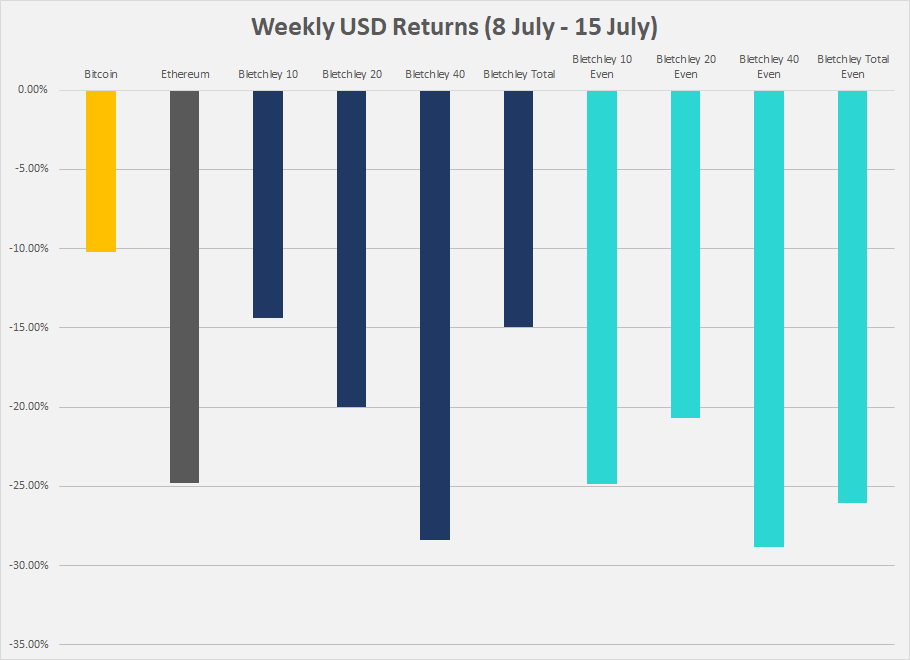
After a stellar first half to the year, Bletchley Indexes retraced 10-20% this week. The whole market continues to be dominated by the movements of Bitcoin, with many alt assets experiencing small gains or slight sell-offs during a bitcoin run, and deep sell-offs during a Bitcoin retrace. This effect can best be observed when comparing the returns of indexes in USD terms and BTC terms.


Subscribe and Past Issues
If you'd like to get State of the Network in your inbox, please subscribe here. You can see previous issues of State of the Network here.
Check out the Coin Metrics Blog for more in depth research and analysis.
