Coin Metrics' State of the Network: Issue 2
Monday, June 3, 2019

Intro and Updates
Dear crypto data enthusiasts,
Welcome back to this week’s edition of Coin Metrics’ State of the Network, an unbiased, focused view of the crypto market informed by our own network (on-chain) and aggregate market data.
Last week, Coin Metrics released historical rates for our CM Reference Rates product and made some updates to the methodology. Check out our blog post about the release. This week, Coin Metrics expects to release version 4.0 of our CM Network Data Pro product. Stay tuned for an update when the release is complete.
As always, if you have any feedback or requests, don’t hesitate to reach out at info@coinmetrics.io.
Weekly Feature
Thoughts on Supply Distribution
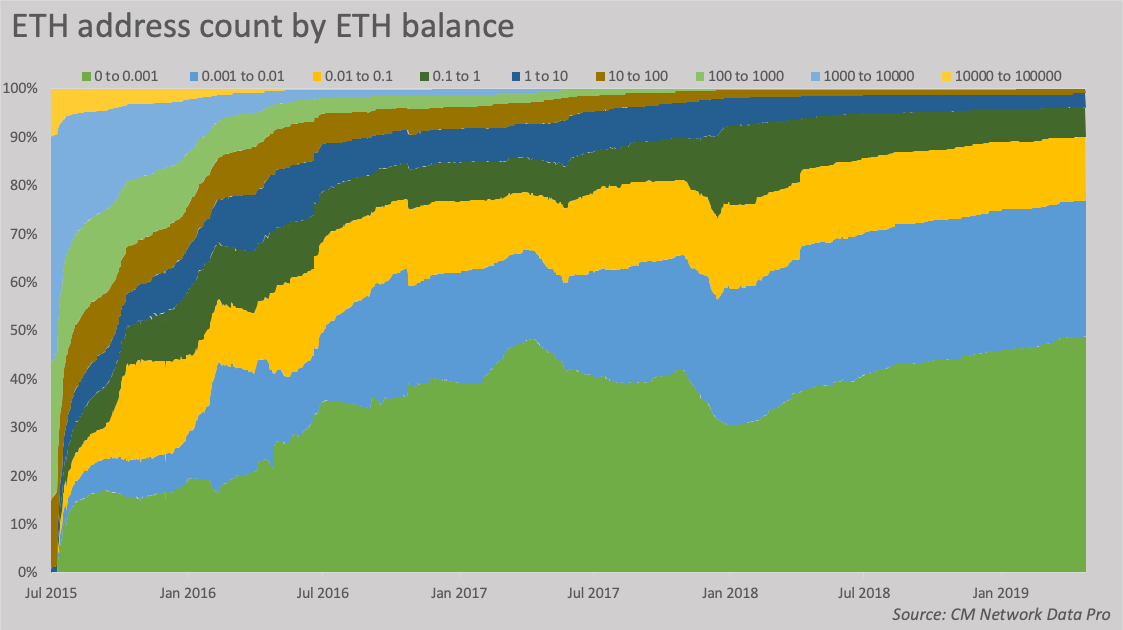
Today, 96% of all of the 26 million Ether addresses with a balance hold one or fewer units of ETH. It wasn’t always this way. At the time of the crowdsale, 85% of ETH addresses held between 100 and 10,000 ETH. This stands to reason—crowdsale participants were buying ETH in larger lots, as the sale price at the time was just $0.31. The charts below illustrate the distribution of Ethereum accounts by the number of ETH held. The growth in accounts of such small size likely speaks to the rise of “dust” (small amounts of native units left behind in addresses that are smaller than the fees or effort needed to move them).
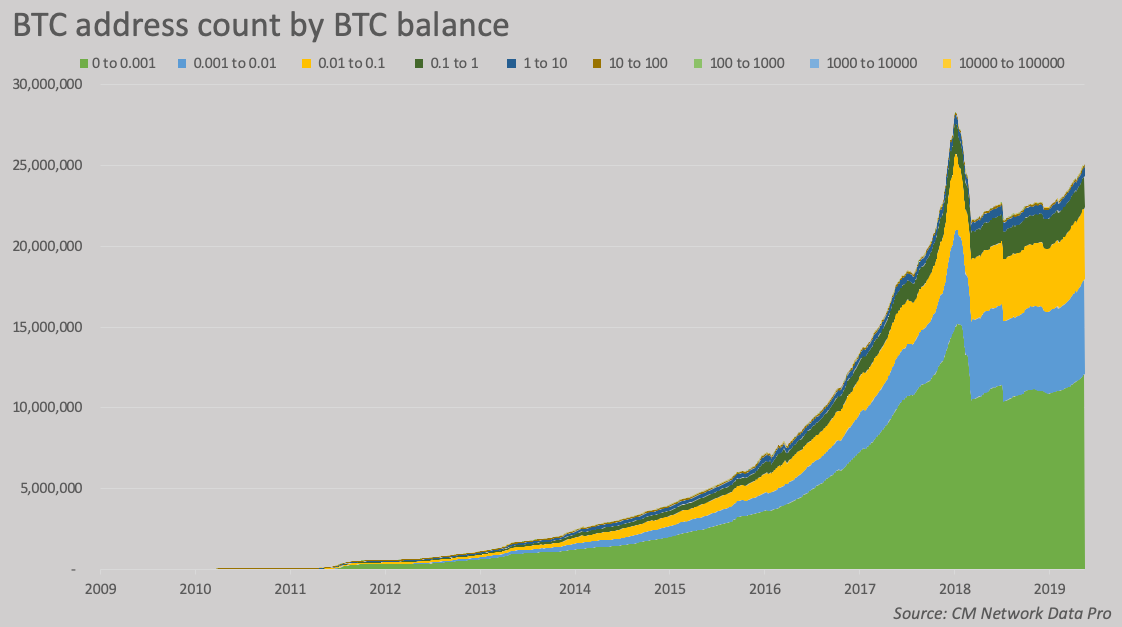
We’ve also included the absolute view so you can see the growth in the address space over time.


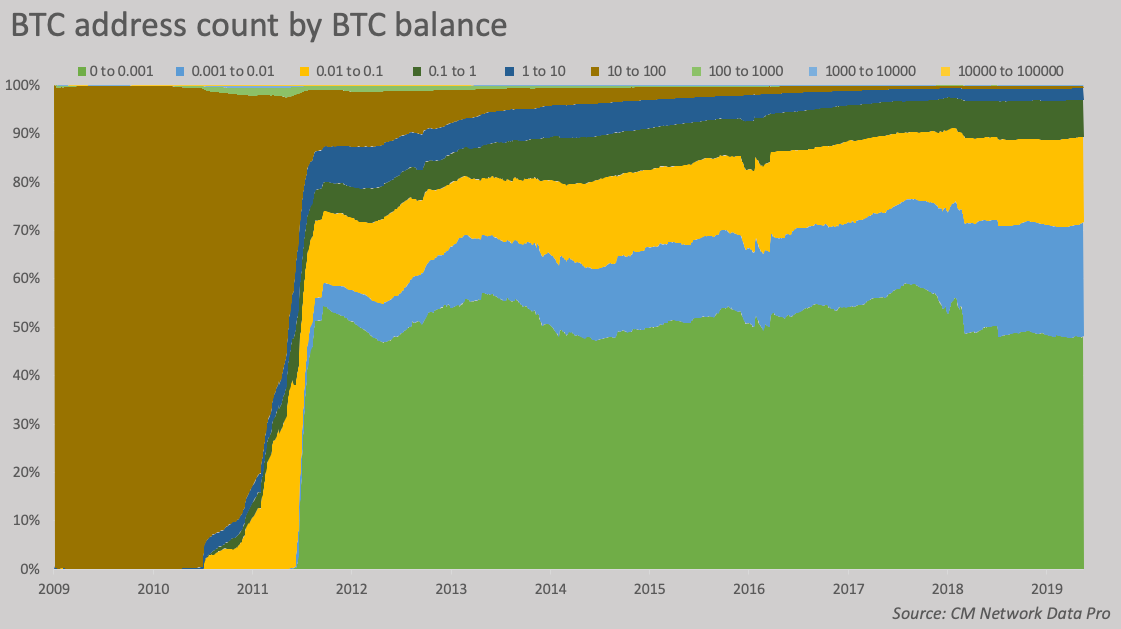
The history of Bitcoin is similarly etched on the distribution of addresses by balance. From inception in early 2009 to mid 2010, virtually no addresses sprang up in denominations outside 10-100 BTC. During that time, bitcoins were mined in lots of 50, and the handful of early users didn’t bother sending anything less than a few BTC. It wasn’t until mid 2011 that the Bitcoin address space came to resemble something close to its present form, with addresses holding <0.1 BTC becoming dominant. Today, 89% of all Bitcoin addresses hold less than one BTC.


However, this doesn’t tell the whole story. Arguably more important if you are interested in the dispersion of supply is the distribution of supply by address size.

You can see that Bitcoin was primarily held in denominations of 10 to 100 early on. Around 2013, most of Bitcoin’s supply came to be held in addresses with well over 100 BTC. For those interested in Bitcoin’s GINI coefficient, the chart also shows an interesting phenomenon: a slow but steady march upwards of the supply held in addresses with 1 to 10 BTC and 0.1 to 1 BTC, more typical of today’s holders. This unabated increase of the supply held in smaller addresses is evidence of Bitcoin’s continuing dispersion. Interestingly, you can see where Coinbase reshuffled their cold storage in December 2018, taking their holdings from addresses larger than 10,000 BTC to smaller addresses.
This pattern of supply settling into smaller denominations is also present for Ethereum, although only 3% of the ETH supply is held in balances of 10 or fewer ETH, compared to 13% for BTC (note however that ETH has a larger supply, BTC has had much longer to become dispersed, and BTC’s UTXO accounting model means addresses are rarely reused after transacting).

Note that all of these dispersion figures can be manipulated, say by a whale taking their 100,000 BTC wallet and splitting it into thousands of 10 BTC wallets, although that would be very cumbersome and costly. If this were to happen, we’d also notice a dramatic shift in the supply distribution that we do not currently see.
These supply repartitions also tell us about the effect of various catalysts like forks. Here we’ve taken the distribution of supply for BTC and BCH since the August 2017 BCH fork. You can see that BCH supply came to settle in larger address sizes, in particular addresses with a balance of 10,000 to 100,000 BCH. The share of supply held in wallets with 10 or fewer BCH actually shrank, from 10.6% at the time of the fork to 7.3% today (it’s 13% for BTC). This is conditional evidence that minority forks tend to be concentrative, as many holders of the parent asset sell their forked coins, and a few large entities scoop up the supply.


The fully stacked area plots don’t give you the full picture of adoption; they only show you the relative change.
To get a view of the changing level of dispersion in real world terms, scrutinizing the growth of meaningful addresses can be helpful. We informally define a “meaningful” address as one with at least one billionth of supply—for Bitcoin this would be the equivalent of $178. The chart below plots the number of meaningful addresses over time for Bitcoin and its forks. It can be understood as measuring dispersion over time, in particular into the hands of smaller holders. The concentrative trend visible here is evident for every fork of BTC so far – as Bitcoin has continued to disperse itself into the hands of more owners, the minority forks have failed to find traction in this way.

Here’s the same chart for a variety of top cryptocurrencies. While this should be heavily caveated with the point that addresses aren’t directly comparable—especially between UTXO-based chains (like Bitcoin) and account-based chains (like Ethereum)—the trends over time are nevertheless interesting to take note of. Of particular note: XRP only has about 570k addresses with at least a billionth of supply, well below Bitcoin and Ethereum.

Network Data Insights
Summary Metrics

Top 5

Network Highlights
BTC Difficulty
BTC difficulty is an at all time high. Miners' margins have increased with the BTC price and it looks like either they're reinvesting those increased margins in more hardware or new miners are entering the market.

USDT Transactions
The share of BTC transactions involving USDT (via the Omni protocol) has risen from around 5% to nearly 20% since the beginning of the year (every transaction on Omni results in a transaction on Bitcoin). Despite the current legal woes of Bitfinex and Tether, USDT activity is booming on-chain, both in numbers of transactions, but also in circulating supply (which is currently at an all time high). USDT has also recently launched on the Ethereum, EOS and Tron protocols and has seen rapid growth on Ethereum in particular. This makes the increase in USDT transactions observed on Omni (and therefore on Bitcoin) all the more impressive.

Market Data Insights
The upper bound of volatility has continued to decrease, but the lower end remains elevated
Volatility continues to remain high for crypto as an asset class. The three-month annualized volatility of bitcoin has experienced a wide range of historical values depending on where it is in the market cycle—from a high of 225% early in its history to a low of 25% in early 2016 as prices began recovering from the previous bubble.
The general trend is that bitcoin is becoming less volatile over time as it matures into a legitimate asset class. The market microstructure, trading infrastructure, and price discovery mechanisms continue to improve. These factors and the fact that the trough-to-peak impact of market cycles continue to attenuate has led the high range of volatility to decrease over time. At the peak of the previous bubble, volatility only reached 135%.

While the rolling volatility of bitcoin indicates that the upper range of volatility has continued to come down, the lower bound of volatility continues to remain elevated. The three-month annualized volatility of bitcoin stands at 71%—higher than previous lows. In fact, at the trough of this market cycle, the rolling volatility only briefly dipped below 50%. The previous lows in volatility were in the 25 to 35% range. For comparison, the volatility of U.S. equities is currently at 18%.
Two explanations exist for why the lower bound remains elevated.
One, trading has become more fragmented over time rather than less fragmented. While in the past, trading activity was concentrated in just a handful of exchanges, now price discovery happens on multiple exchanges. Despite the overall increase in liquidity and continued development of institutional-grade trading infrastructure, there is now more dispersion in exchange market share, not less.
Two, the rise of margin trading and futures contracts have an outsized impact on the market. Over the past year, compelled margin calls or liquidations of futures contracts through engineered price movements have become the defining mark of many large short-term moves in crypto markets
Bitcoin continues to be one of the least volatile crypto assets
Among crypto assets, bitcoin continues to maintain its safe-haven status and experiences the lowest realized volatility among the major assets in the chart below.

Capital may be shifting from bitcoin to other crypto assets
During the previous bubble, bitcoin led the rally for in the early stages of the bubble leading to large unrealized gains. This led to an explosion in the global supply of crypto assets as many new ICOs were launched. The intermediate and final phases of the bubble were characterized by a large-scale shift in capital from bitcoin to other crypto assets.
Over the past week, bitcoin dropped by 5%. Many smaller assets outperformed this threshold although still had a negative weekly return while some assets experienced a positive return. This is significant because for many assets over the recent past, bitcoin has either significantly outperformed or risen a similar amount to other crypto assets.
This past week was one of the first instances of bitcoin underperformance. Looking at the distribution of returns for 101 assets in our CM Reference Rates product relative to bitcoin indicate that we may be in the early phases of capital shifting from bitcoin to other crypto assets.

Subscribe and Past Issues
If you'd like to get State of the Network in your inbox, please subscribe here. You can see previous issues of State of the Network here.
Check out the Coin Metrics Blog for more in depth research and analysis.
