Coin Metrics' State of the Network: Issue 61
Tuesday, July 28th, 2020
Get the best data-driven crypto insights and analysis every week:
Weekly Feature
Introducing Coin Metrics’ Trusted Volume Framework
By Jon Geenty and the Coin Metrics Team
This week we want to highlight our work to improve the quality of information in our industry by introducing a framework to better identify exchanges with spot volume reporting that you can trust. Below are some excerpts from our research. You can find the full report here.
Overview
Fake trading volume is a persistent problem on crypto exchanges. With little regulatory oversight, it can be difficult to determine whether reported volume numbers are accurate or exaggerated. At Coin Metrics we’ve taken a data driven approach to the problem and are excited to introduce a “trusted volume” metric to help identify legitimate trading volume.
Our trusted volume metric is an aggregation of the reported volume from exchanges that we consider the most accurate and trustworthy. This is based on a combination of both quantitative and qualitative features. The analysis below is limited to spot exchanges and spot volume. This is a distinction with regards to derivative exchanges such as BitMEX and Deribit.
Our framework for measuring the reporting quality of an exchange is broken down into three broad categories: volume correlation, web traffic analytics and qualitative features. Each of these three categories culminates in a pass/fail test. Exchanges that pass all three measures are included in our trusted volume set of metrics.
Part I: Correlation of Hourly Volume with Regulated Exchanges
During times of high volatility and large price movements, exchanges should see an increase in trading volumes in a similar magnitude to their peers. The same applies in times of low volatility and small price movement. Accordingly, authentic volume should have a higher correlation to other authentic volume. Fake volume should surface as an outlier with lower correlation.
In this test, we took hourly volume from long-standing, regulated exchanges based in the United States and used that as our ‘trusted’ control group. These exchanges all have a relatively long established history of at least five years and legitimacy that has been somewhat bolstered by regulations within the United States. These exchanges also support fiat USD trading, which adds additional credibility. This list includes Bitstamp, Bittrex, Coinbase, Gemini, itBit and Kraken. All data in this section is from trading volume between June 1 and June 30, 2020.
Using a time series of the hourly volume from all markets on all exchanges in our test set, we aggregated the volume by base asset and calculated the correlation between the exchange and the volume for the same base asset on the trusted exchanges. We did this for all assets listed on at least two or more trusted exchanges.
Above is a look at the correlations between the volume from exchanges and the volume from our ‘trusted’ control group for a few of the more well known assets, sorted by the correlation in the Bitcoin markets. We take the correlations (like those seen in the examples above) and look at them in their entirety to get a better sense for the overall dispersion of the exchange’s markets’ correlation to the ‘trusted’ control group.
Above is a series of distributions with each row representing the dispersion of the correlation between an exchange's markets and the trusted markets. The further right the distribution, the more closely correlated it is with the trusted market’s volume. The further to the left, the less correlated. These markets are sorted by the median correlation of all of the exchange’s qualifying markets. However, a median measure across an exchange’s markets is not the best measure for economic activity.
In order to make this measurement better represent the exchanges’ overall volumes we created an aggregated volume weighted correlation based on the relative volumes of the exchanges’ markets. This was accomplished by taking the volumes for the month of June 2020 and calculating the percentage that each base asset made up of the exchange’s total qualified volume. Total qualified volume here is defined as volume in a base asset listed on two or more of the ‘trusted’ exchanges. We then used that percentage to create a volume weighted average of the correlations of each exchange. We believe that the reasonable cutoff for this test is a volume weighted correlation to the ‘trusted’ markets of 80% or greater.
Part II: 24 Hour Volume Over Third Party Web Traffic Metrics
Another way of analyzing fake volume is to look at volume compared to the amount of users visiting an exchange. In theory, the amount of an exchange’s volume should hold some relation to the amount of traders visiting their site. More users should lead to more volume and the inverse should hold as well. An exchange inflating volume numbers should tend to have a higher ratio of volume to traders relative to the other exchanges.
Continue reading the full report...
Network Data Insights
Summary Metrics
Source: Coin Metrics Network Data Pro
After weeks of decentralized finance (DeFi) growth with little movement from Ether (ETH), ETH finally exploded this past week. ETH market cap grew 15.6% week-over-week leading all other major cryptoassets. ETH transaction fees also continued to surge, growing over 76.1% week-over-week. ETH had an average of over $1.5M daily fees over the last week, outpacing Bitcoin (BTC) by about $500K per day. ETH adjusted transfer value surged as well, growing by 77.9%, and averaging close to $1B per day.
BTC’s fees also showed strong growth, gaining 74.1% week-over-week. BTC is starting to rise along with ETH, buoyed by strong security. BTC’s hash rate recently hit a new-all-time high on July 24th and grew 7.4% week-over-week.
Network Highlights
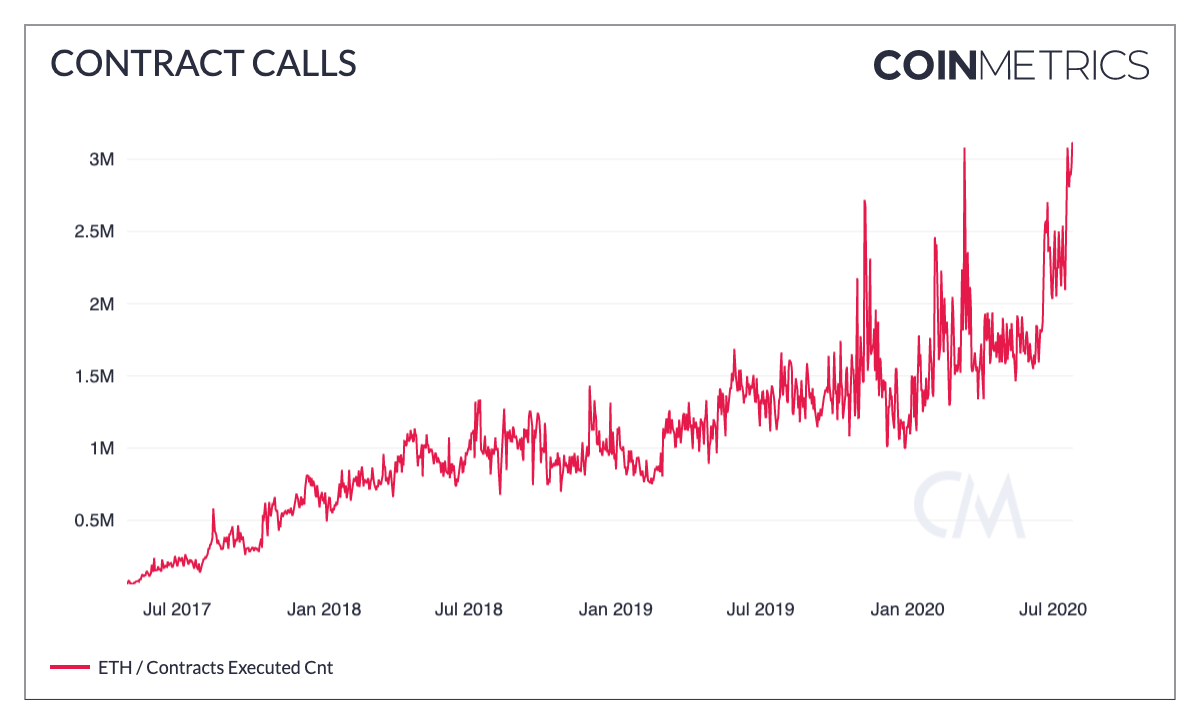
On July 25th, Ethereum contract calls hit a new all-time high of 3.11M. Ethereum contract usage is surging as decentralized finance (DeFi) apps continue their hot streak.
Source: Coin Metrics Network Data Pro
ETH is also gaining momentum on exchanges. While the amount of BTC and ETH transactions involving exchanges (i.e. sent either to or from an exchange) has been relatively equal over the last year, ETH has started to pull ahead in July. The following chart shows the number of daily transactions involving exchanges, smoothed using a 7 day rolling average.
Source: Coin Metrics Network Data Pro
Binance net flows show a similar pattern. Net flows measures the net amount of a cryptoasset flowing in and out of exchanges (i.e. deposits minus withdrawals) as observed on-chain. Over the last year, Binance’s BTC and ETH net flows have mostly mirrored each other, although BTC’s movements have generally been more extreme. But over the last week, BTC and ETH net flows started going in opposite directions: ETH has been flowing into the exchange, while BTC has been flowing out.
Source: Coin Metrics Network Data Pro
Market Data Insights
Volatility in financial markets is a mean reverting process. Prolonged periods of low levels of volatility encourage market participants to take on greater position sizes, engage in increased leverage, set tighter stops, and reduce the thresholds upon which they will respond to new information. This phenomenon is even stronger in crypto markets due to the amount of leverage present in futures markets and the method by which exchanges engage in liquidations as part of their risk management engine.
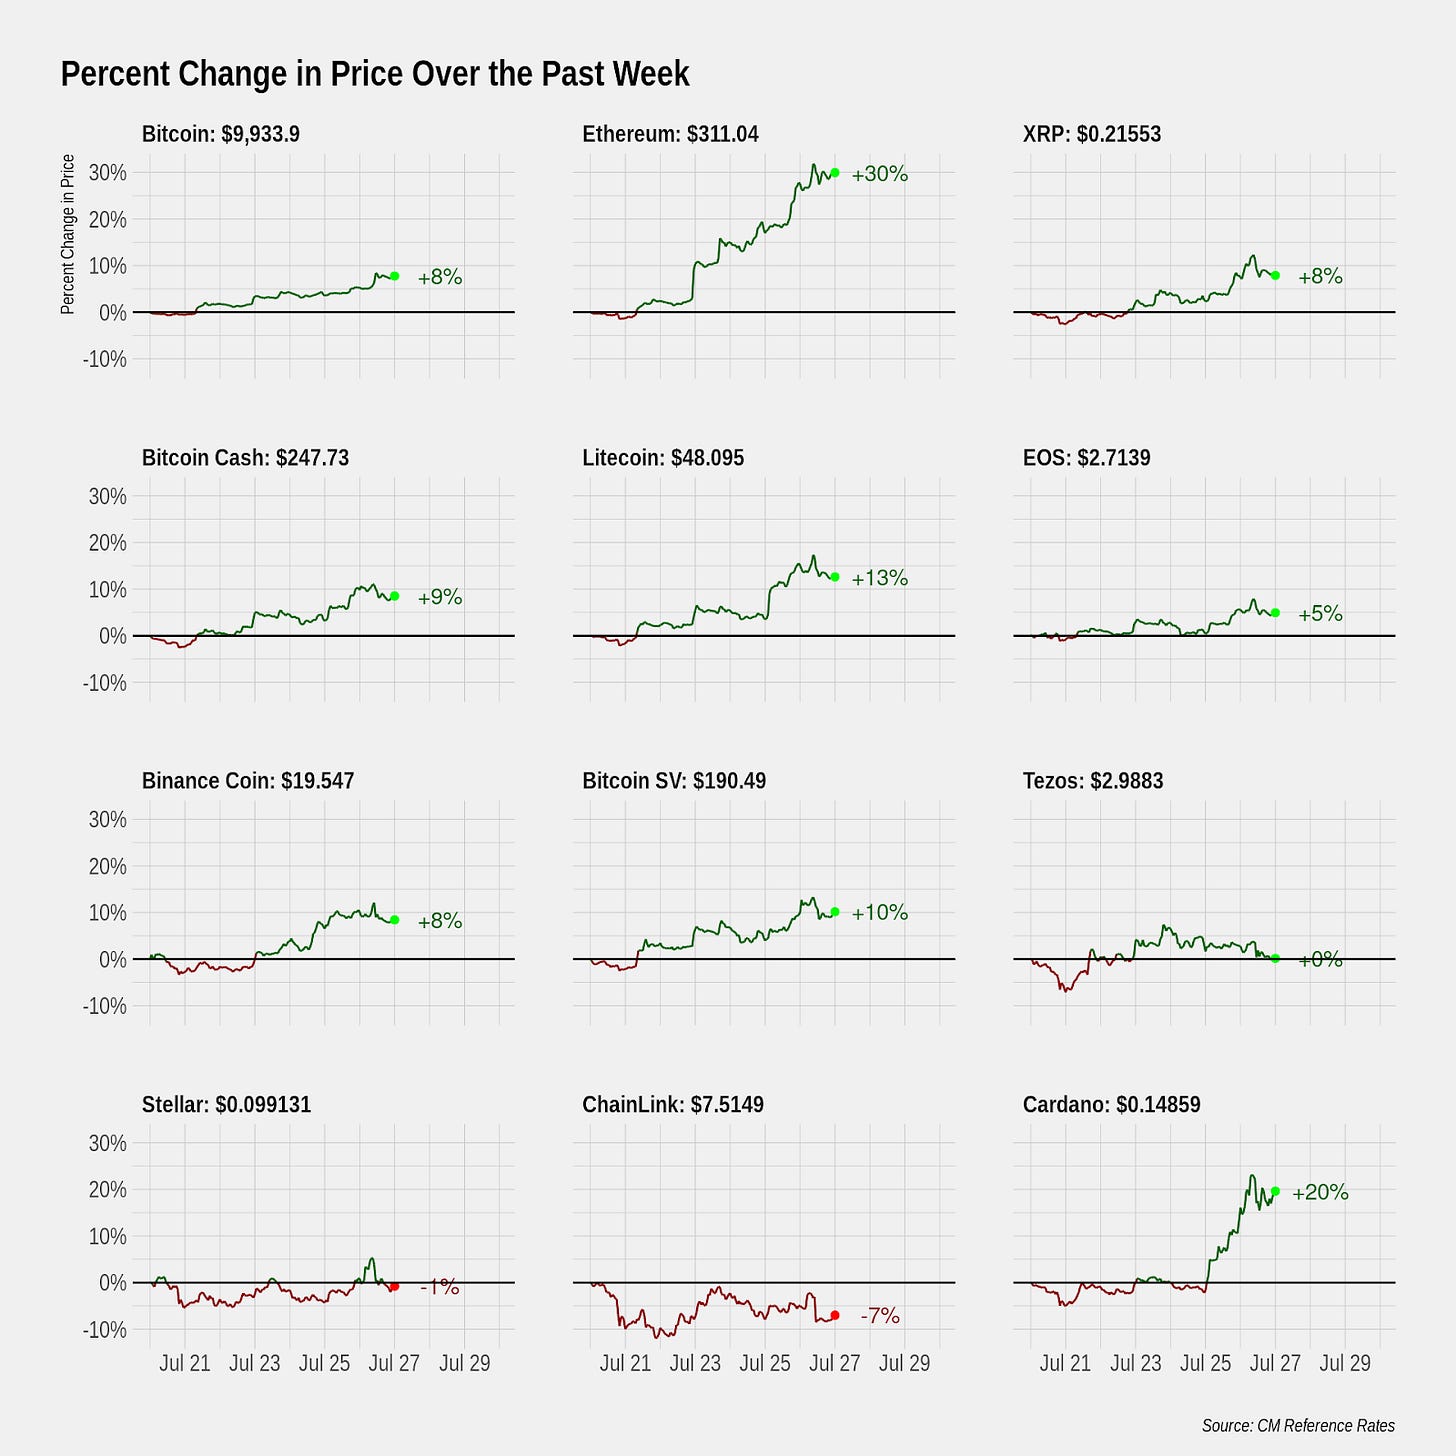
Cryptoassets are showing signs of life again following a period where Bitcoin's 30-day annualized correlation briefly dipped below 25%, a level rarely reached in its ten year history. Ethereum has shown particularly strong gains over the past week -- a rational response to its improving network fundamentals. Critical metrics such as transaction fees and adjusted transfer value have steadily increased as Ethereum benefits as the platform hosting most stablecoin and DeFi activity.
Bitcoin, up until very recently, has shown a somewhat muted response. While it has performed well year-to-date compared to other financial assets, some have questioned why it hasn't performed even better in response to coordinated easing from the world's major central banks. While the below chart only shows data up until midnight UTC on Sunday (to serve as a timestamp to calculate weekly changes), Bitcoin has since broken through the psychologically-important $10,000 level on Monday.
Source: Coin Metrics Reference Rates
Gold has reached all-time highs over the past week and today's move in Bitcoin reinforces its safe haven properties, although Bitcoin's lack of response over the past month was beginning to call in question this theory. Investors should continue to pay attention to real yields (nominal interest rates adjusted for inflation) because it serves as the most straightforward measure of the opportunity cost of holding cash. With the market pricing in low nominal interest rates for the foreseeable future and inflation expectations still moderate but with the potential to rise, holding non-yield producing assets such as gold and Bitcoin are increasingly attractive. Bitcoin is perhaps the purest way to express a market view that long-term realized inflation will come in higher than what is currently priced in.
Some describe owning Bitcoin as an insurance policy against instability of our financial markets. Insurance policies are similar to options and in today's world, Bitcoin is increasingly being used as a call option on inflation. The coronavirus and the monetary and fiscal response have increased the uncertainty in the future path of monetary policy, inflation, and growth, all of which are supportive to Bitcoin's prices.
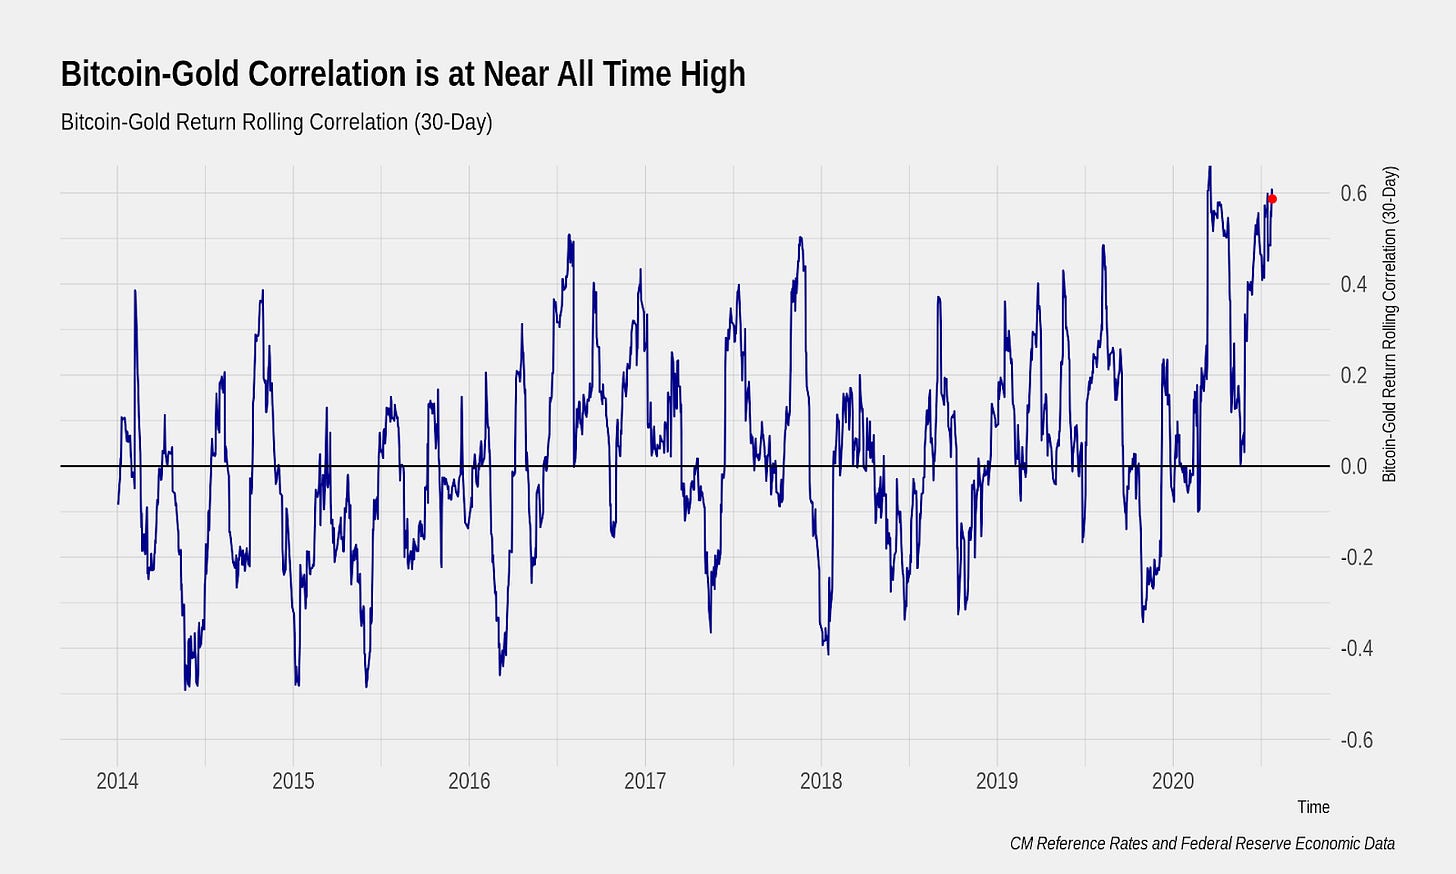
Bitcoin and gold's 30-day correlation are returning to near all-time highs. The all-time high was reached in March when all risk assets sold off due to the rapid need for liquidity driven by coronavirus fears. Previous to 2020, Bitcoin and gold's correlation have normally oscillated around zero while reaching brief moments of high positive and negative correlation. If high positive levels of Bitcoin and gold's correlation can be sustained, it might serve as an indication of a regime shift in Bitcoin's response to geopolitical and macroeconomic developments.
CM Bletchley Indexes (CMBI) Insights
After the majority of returns over the last two months came from small-cap assets, it was the large-caps that experienced the greatest gains this week. The CMBI Ethereum Index was the best performer, returning a staggering 30.8% for the week, with the CMBI Bitcoin Index also performing very well, returning 7.9%.
Of the market cap weighted indexes, it was the Bletchley 10 (large-cap) and Bletchley 20 (mid-cap) that performed the best through the week, returning 9.8% and 7.4% respectively. After months of outperformance, the Bletchley 40 (small-cap) did not experience a similar run, falling 2.3% during the week. The Bletchley Total performed in line with these indexes, returning 9.3%, largely due to the weighting of constituents significantly favoring large-cap and mid-cap assets.
Coin Metrics Updates
This week’s updates from the Coin Metrics team:
Coin Metrics is pleased to announce the release of a new Network Data Visualization offering. Come check it out at https://network-charts.coinmetrics.io
As always, if you have any feedback or requests, don’t hesitate to reach out at info@coinmetrics.io.
Subscribe and Past Issues
Coin Metrics’ State of the Network, is an unbiased, weekly view of the crypto market informed by our own network (on-chain) and market data.
If you'd like to get State of the Network in your inbox, please subscribe here. You can see previous issues of State of the Network here.
Check out the Coin Metrics Blog for more in depth research and analysis.


