Coin Metrics' State of the Network: Issue 48
Tuesday, April 28th, 2020

Creating a Better Supply Measurement: Introducing Free Float Supply
An accurate measure of supply is crucial in determining a cryptoasset’s value. However, the definition and methodologies of calculating supply are not yet widely agreed upon or standardized, which leads to different supply counts across the industry.
One definition of supply is “current supply”, which represents the total amount of native units that are visible on a blockchain’s ledger. This number is publicly available and accessible to any individual that downloads a cryptoasset’s blockchain ledger, which acts as a source of truth.
However, utilizing this metric can grossly misrepresent a cryptoasset's underlying liquidity and capitalization, as most have a certain amount of supply that is effectively out of circulation. This poses an issue for creating investable financial products such as indexes that rely on supply data to determine a constituent’s weight in a multi-asset index.
Understanding what portion of supply is unavailable to markets can help market participants to make smarter and more informed investment decisions. Currently, the market relies primarily on the ‘Reported Supply’, which is generally provided by the asset creator and is visible on the majority of data distributor dashboards. However, in the absence of regulatory requirements or strong incentives, reporting by these entities has historically proven to be infrequent and sometimes lacking in accuracy.
Coin Metrics recently announced the CM Free Float Supply, a new metric that is being developed to more accurately represent the supply of an asset available to the market. By applying a standardized approach, this metric represents a cross blockchain unified portrayal of the crypto market’s liquidity. For greater detail on the rationale for the methodology decisions that make up CM Free Float Supply, please refer to our blog post, Cryptoasset Free Float: An Exploration of Supply Dynamics.
CM Free Float Supply overcomes the challenges of misrepresenting supply by restricting categories of token holders that do not provide liquidity to markets. Coin Metrics’ approach to Free Float Supply determination can be represented as follows:

1 - This approach has been taken for UTXO chains as opposed to the traditional mechanism of assessing individual UTXOs for inactivity. The purpose of this is to develop a more ubiquitous and consistent approach for applying logic across all blockchains.
This approach leverages some of the best practices for supply determination from traditional capital markets and applies them systematically to cryptoassets. Many of the values produced will not be familiar at first glance, but we hope that they help provide a new and more accurate view of cryptoasset liquidity in markets. At Coin Metrics we strive to set the standard for transparent and actionable cryptoasset data, and we believe this new supply metric will aid us in achieving that goal.
Case Studies on the Free Float Supply of Different Asset Groups
Given the varying architectures and token economic models of blockchains, it was essential to create a methodology that can be applied consistently across all cryptoassets, or risk introducing large amounts of subjectivity and expert judgment that could jeopardize the usefulness of the metric. It is therefore very important that our data suite is unbiased and can be interpreted across any asset class.
In this section, we detail how the Coin Metrics Free Float Supply Methodology has been applied across different blockchain architectures and token economic models, including UTXO chains, forked assets, and Ethereum tokens.
Case Study 1: UTXO Blockchains
Bitcoin was the original UTXO blockchain, and many others have followed since. An unspent transaction output (UTXO) blockchain is a way of structuring a ledger whereby all coins (or bundles of coins) are only spent once. A UTXO is an output that a network user receives and has the right to spend at a time in the future.
The early UTXO chains are very simple to audit as most were launched with no pre-mine (i.e. private mining by select participants before the source code is released to the public to mine), no ICO, no foundation, and thus very few restrictions on their supply.
In the calculation of BTC’s free float supply in our free float methodology explanation blog, we considered send and receive transactions as the sign of an active address. However, after further investigation and internal deliberation, we have improved our approach and consistent treatment of the methodology across blockchains by only considering send transactions specifically as signs of activity. The rationale behind this is that for a small cost, supply values could be easily manipulated.
Note, this change has now been applied to all UTXO blockchain supply figures, and as such the below BCH and BSV values have been improved from previously reported values as well.
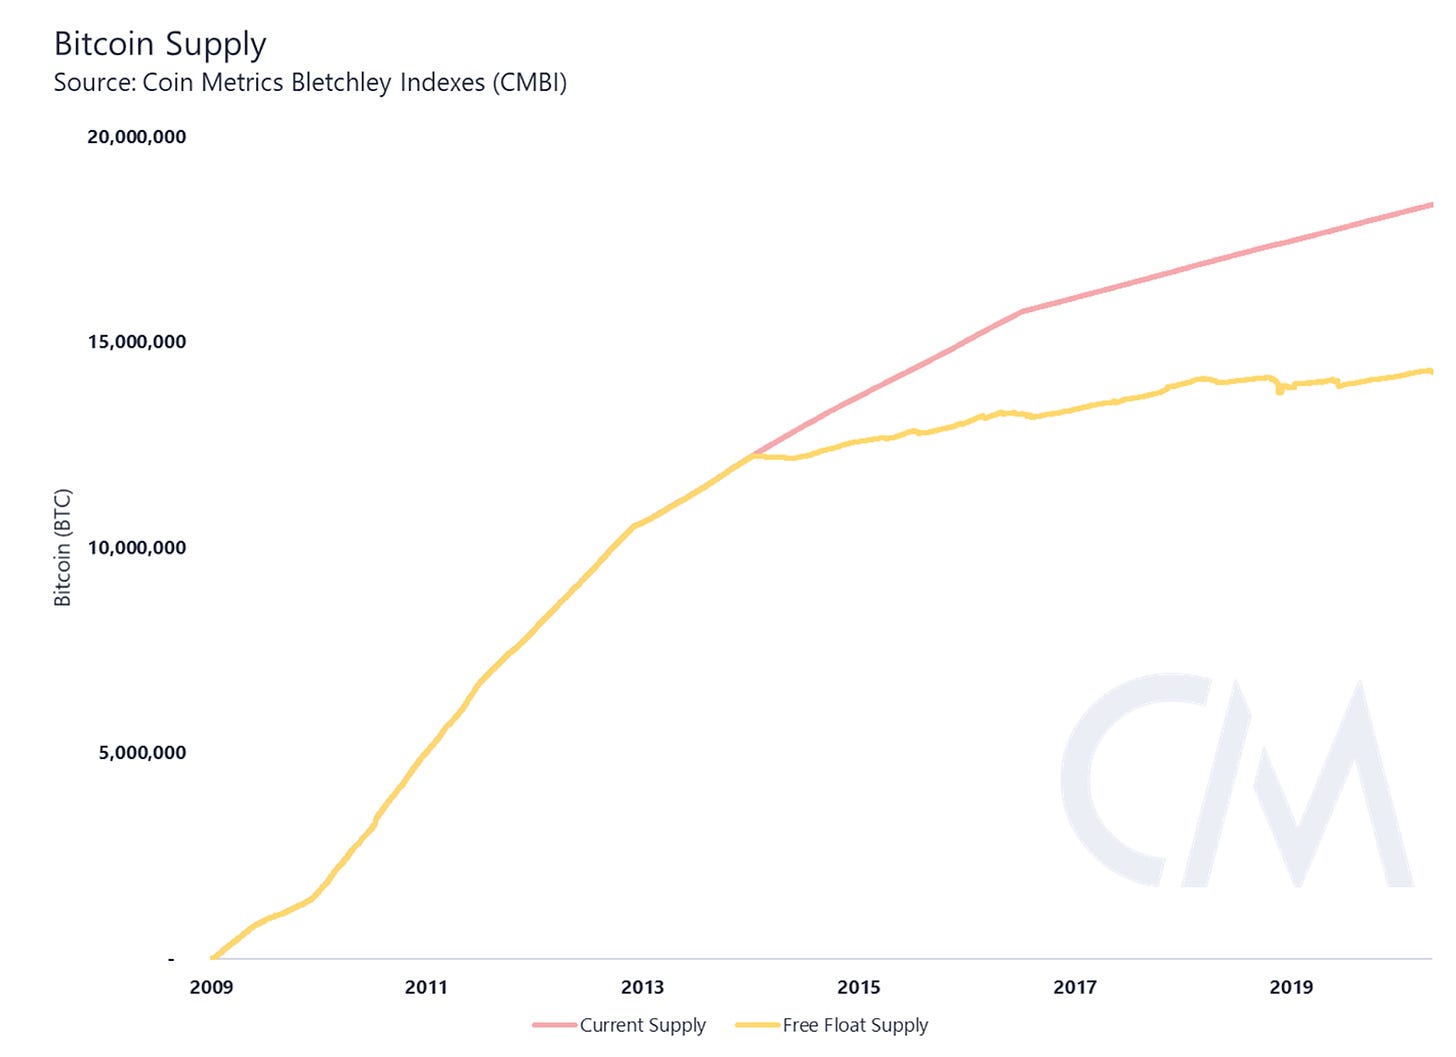
Both Bitcoin and Litecoin had no ICO, issued no founding team tokens and had no pre-mine. But both chains are over five years old and thus have UTXOs that have not been touched in over five years. As such, in both instances, five years into the chain’s existence, you will notice the divergence of Free Float Supply from Current Supply.
Bitcoin has 4.1M BTC unmoved tokens in over five years and Litecoin has 3.0M LTC unmoved in over five years that have been excluded from the CM Free Float Supply.


Note: Reported Supply is currently the most quoted industry value that is generally the value observable on a blockchain or as reported by a foundation where one exists.
Case Study 2: Hard Forked Blockchains
A hard fork can occur when a change in consensus rules results in non-backward compatible software. If any network participants decide to run their own version of the blockchain’s software that creates a different set of consensus rules, a new blockchain with its own native token will be created.
These new native tokens are not only credited to the holders of the parent chain, but they carry the full history of the parent chain as well. Despite this, given the pseudonymity of cryptoassets, it is difficult to understand who these token holders are and predict what their actions will be. For example, are they aware of their right to claim their tokens, and do they know how to claim? As such, assuming the full history and financial ownership of the parent chain may not accurately reflect the realities of the forked chain.
Coin Metrics has taken a conservative approach and excluded all tokens from addresses on the newly forked blockchain that have never been activated since the time of the fork. Activation here is defined as an address that sends any amount of their assets (or UTXOs), thus proving that all tokens in that address are owned and monitored.
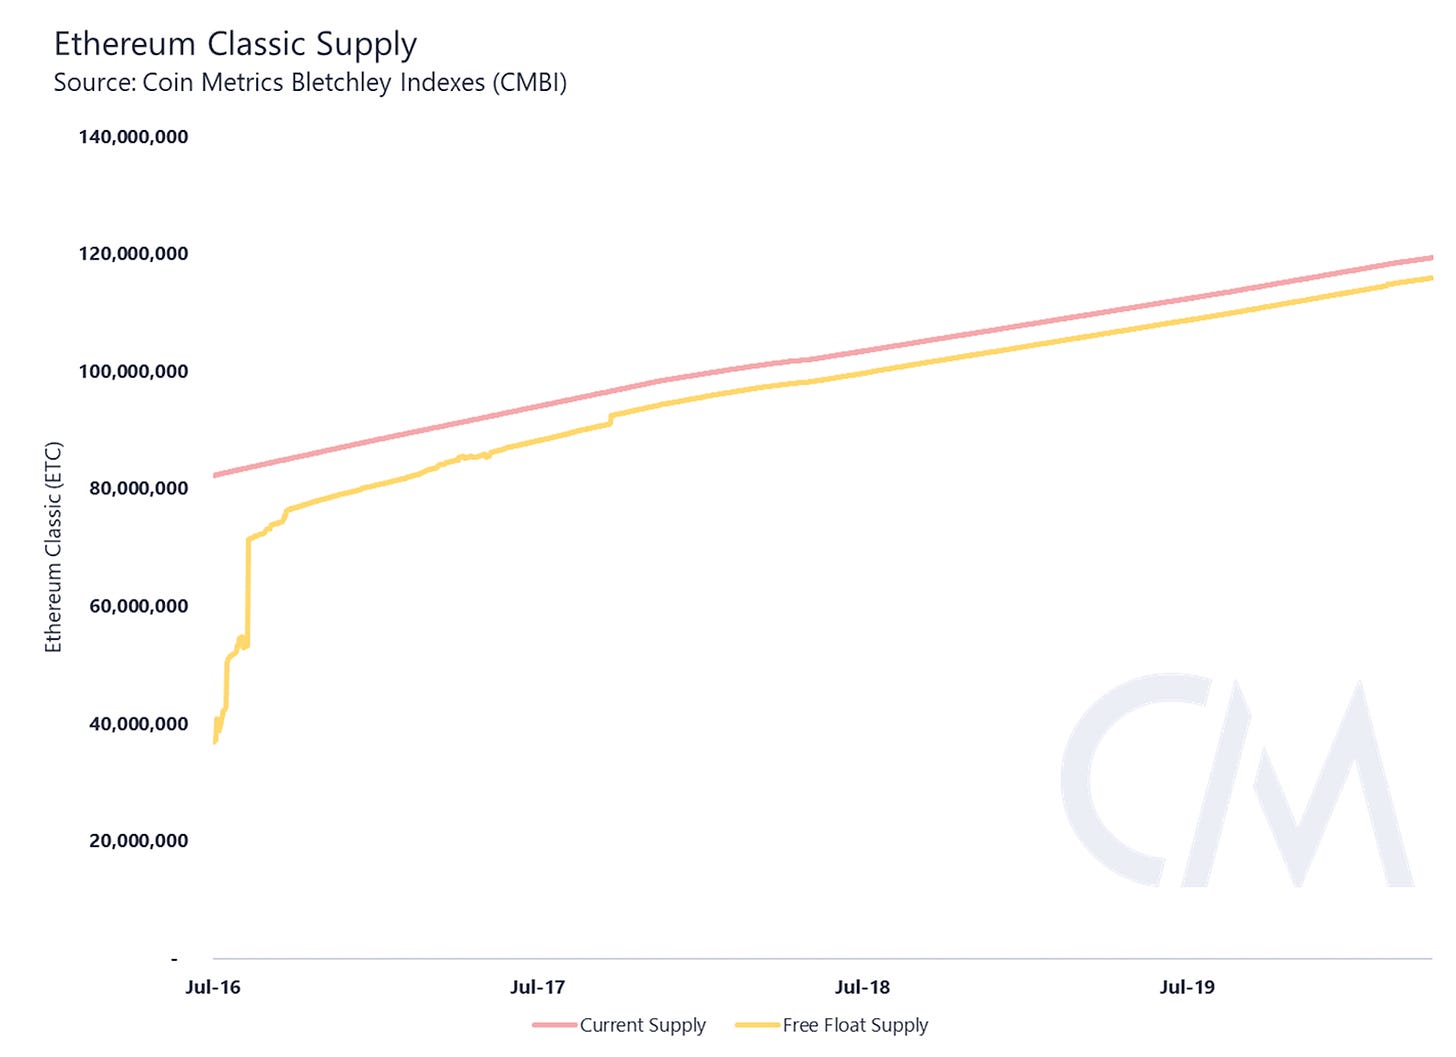
Ethereum Classic (ETC) was the first hard fork that met the criteria as outlined in the Coin Metrics Fork Legitimacy Policy. Interestingly, activation of ETC native units after the fork was extremely high. Currently, addresses that hold over 97% of tokens have been transacted post fork.


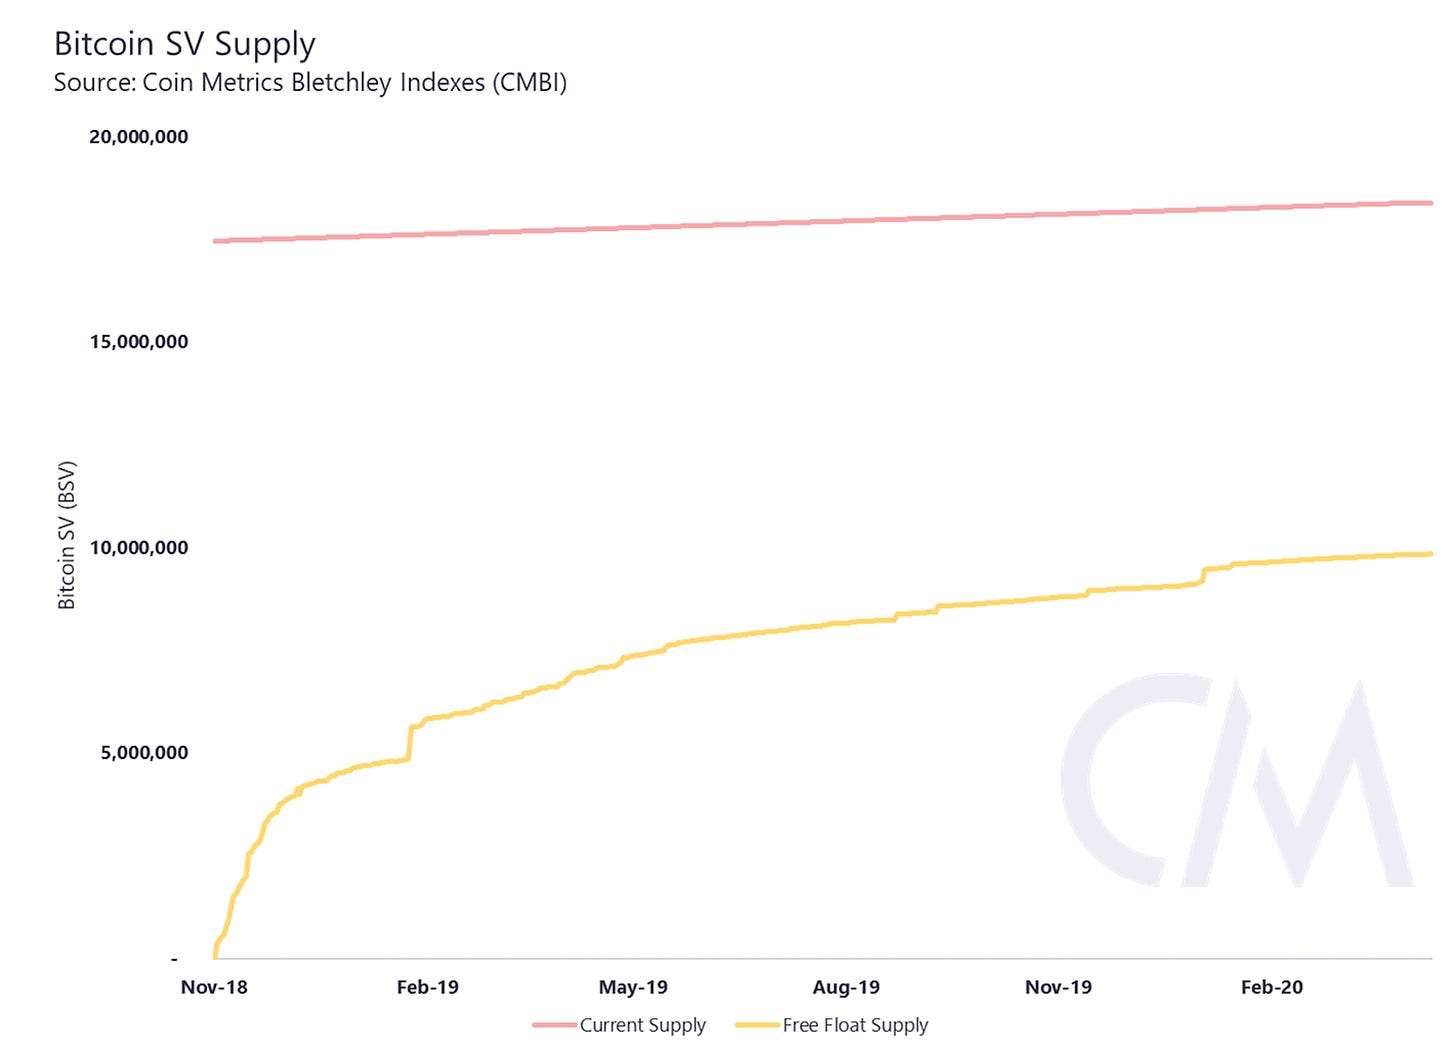
Similar to Bitcoin, Bitcoin Cash (BCH) and Bitcoin SV (BSV) do not have any foundation wallets, founding team tokens, provably lost tokens (>0.1%), burned tokens (>0.1%), vesting tokens, or pre-mine. However, despite the publicity and media attention surrounding both forks, they did not receive the same amount of activation that the Ethereum Classic fork did. Bitcoin Cash addresses holding 6.4M BCH and Bitcoin SV addresses holding 8.5M BSV remain untouched since the time of their forks.


Case Study 3: Stellar and XRP
For both Stellar and XRP, foundations have, to date, held the majority of the current supply. As such, Coin Metrics has identified a significant amount of restricted supply. Both foundations and founding team member wallets have historically demonstrated relatively high levels of activity (i.e. token selling) which has continually resulted in increases in their free floats.
In the case of XRP, all foundation and team tokens identified and all escrowed tokens have been removed to determine the free float. There were no identified provably lost tokens (>0.1%) or burned tokens (>0.1%) still present on-chain.


Stellar is similar. To Coin Metrics’ knowledge, there are multiple Stellar Development Foundation (SDF) wallets, tokens that are vesting (in the SDF) and tokens that are burned. These tokens have been removed to determine the XLM free float.


Case Study 4: Ethereum Tokens
Most tokens launched on Ethereum, including Ether (ETH), were released through an Initial Coin Offering (ICO). The majority of these projects allocate significant portions of the current supply to the foundation and team members. Foundation tokens are often utilized to fund long-term growth initiatives and can remain within foundation wallets for extended durations. Team member tokens can be subject to vesting schedules early on, but in many cases, founding team members hold the majority of their tokens longer term.
Ethereum launched in 2015 with a relatively small foundation and team token allocation. Since then, many of the tokens have been moved and sold. The Ethereum foundation now only holds around 0.5% of the total ETH supply. A further 1.0% has been identified as founding team tokens and 0.5% was provably lost in the Parity wallet bug.


Chainlink is a typical cryptoasset born from the modern day ICO, where fewer than half of all created tokens were distributed at genesis. Upon launching, the Chainlink foundation and the founding team members held 65% of the token’s current supply. Since launch, there has been some movement from founding team wallets that has increased the free float supply from 350M to 379M.


Applying Free Float
The CM Free Float Supply is designed to generate and maintain the most accurate representation of cryptoasset liquidity across the market. Coin Metrics is able to do so by hosting our own nodes that allow for detailed on-chain analysis and the real-time tracking of specific tagged addresses. Further, hosting nodes and managing data allows Coin Metrics to independently verify all information from cryptoasset foundations and teams through on-chain forensics and verification.
Whilst it may seem unfamiliar to consider the supply of Bitcoin as 14.3M or Bitcoin Cash as 12.0M doing so can provide some significant benefits when conducting market wide analysis and designing portfolios. Through better representing the supply and demand relationship of cryptoassets across the market, portfolio managers can reduce tracking error, unnecessary portfolio rebalance costs and slippage, and the management effort required.
To that extent, CMBI market cap weighted indexes will leverage the CM Free Float Supply to create a suite of highly investable indexes that accurately track and represent the underlying cryptoasset market. These CMBI Indexes will provide markets and customers with industry leading solutions that aid in performance benchmarking and asset allocation.
Network Data Insights
Summary Metrics

Ethereum (ETH) had another strong week as it continues to rebound after the March 12th crash. ETH market cap increased by 9.0% week-over-week, and realized cap grew by 1.2%. Adjusted transfer value, transfer count, and daily fees all also showed solid growth, signaling that Ethereum on-chain activity is increasing along with the market cap.
Bitcoin (BTC) also had a relatively strong week, with market cap growing by 4.3%. BTC transaction fees grew by 34.2% week-over-week, which is BTC’s strongest week of fee growth over the last month.
Network Highlights
Tezos (XTZ) and Chainlink (LINK) market caps have both grown by over 70% over the last 30 days. Zcash (ZEC) and Ethereum (ETH) have also rebounded well, growing 51% and 48%, respectively.

More than one million Ethereum smart contracts have been created since March 12th. The number of smart contracts deployed on Ethereum grew from 13.36 million on March 12th to 14.41 million on April 26th.
For context, the number of Ethereum smart contracts increased by about 470K between January 1st and March 12th.

Market Data Insights
All large capitalization cryptoassets saw gains this week with Tezos (XTZ), Stellar (XLM), and Cardano (ADA) managing gains in excess of 20%. One of the key portfolio level decisions for investors in the space is the relative allocation between major assets like Bitcoin and Ethereum versus the allocation to the longer tail of assets. Accurately determining which market regime we are in and how the various market capitalization segments will perform is important. Recent market activity has shown us some isolated examples of certain cryptoassets in the longer tail exhibiting outperformance with high beta to Bitcoin's returns -- a trend that deserves continued observation.

Bitcoin volatility measured on a one month rolling window has almost completely reverted to normal levels. For the past few years, an annualized volatility of around 50% seems to be a critical level. Volatility rarely goes below this level and oftentimes bounces higher off it for brief periods of heightened volatility.
Usually lower volatility will cause investors to become more complacent and use more leverage, but the market crash on March 12 may have led to a longer lasting change in trader behavior. Implied volatility levels also have almost completely reverted and open interest on the major perpetual swap contracts are still down from recent highs. Volatility will likely remain muted until the memory of March 12 has faded somewhat and risk taking using leveraged financial instruments comes back.

CM Bletchley Indexes (CMBI) Insights
All CMBI and Bletchley Indexes performed well this week as global markets continued to rally after the early March crash. The CMBI Bitcoin Index and the CMBI Ethereum Index returned 6.9% and 7.6% respectively, but it was the small-cap Bletchley 40 that was the strongest performer, returning 12.9% week-over-week.
The strength of the cryptoasset performance was experienced across the market, evidenced by all even weighted indexes outperforming their market cap weighted counterparts.

Coin Metrics Updates
This week’s updates from the Coin Metrics team:
Coin Metrics is hiring! Please check out our Careers page to view the openings.
As always, if you have any feedback or requests, don’t hesitate to reach out at info@coinmetrics.io.
Subscribe and Past Issues
Coin Metrics’ State of the Network, is an unbiased, weekly view of the crypto market informed by our own network (on-chain) and market data.
If you'd like to get State of the Network in your inbox, please subscribe here. You can see previous issues of State of the Network here.
Check out the Coin Metrics Blog for more in depth research and analysis.
