Coin Metrics' State of the Network: Issue 22
Tuesday, October 22nd, 2019

Weekly Feature
Bitfinex Market Share is Declining
Bitfinex, the controversial Hong Kong based exchange at the heart of ongoing investigations against Tether, has been one of the biggest cryptocurrency exchanges in the world since its launch in 2012. But recently there are signs that its market share may finally be slipping.
Since the beginning of September, Bitfinex’s BTC-USD market share has been decreasing, while Luxembourg based exchange Bitstamp’s market share has grown. The below chart shows the market share of total daily BTC-USD trading volume (smoothed out using a 7 day moving average) for the following exchanges: Bitfinex, Bitstamp, Bittrex, CEX.IO, Coinbase, Gemini, itBit, Kraken, and Liquid.

Although it may be tempting to think that Bitfinex’s volume decline is related to the recent Hong Kong protests, the most likely explanation is a combination of increased regulatory scrutiny and decreased fees.
In April, the New York Office of the Attorney General’s (NYAG) announced it was beginning an investigation for alleged fraud against Bitfinex’s parent company, iFinex, which owns both Bitfinex and the Tether stablecoin. iFinex reportedly lost $850 million in a deal gone bad and then borrowed “at least $700 million” from the reserves that back Tether to cover the losses. After Bitfinex challenged the investigation, on August 19th the New York Supreme Court ruled that the NYAG has jurisdiction over Bitfinex, allowing the NYAG to move forward with the investigation.
Furthermore, in early October, several plaintiffs opened a new class action lawsuit against Bitfinex for price manipulation related to Tether, alleging over $1 trillion in damages.
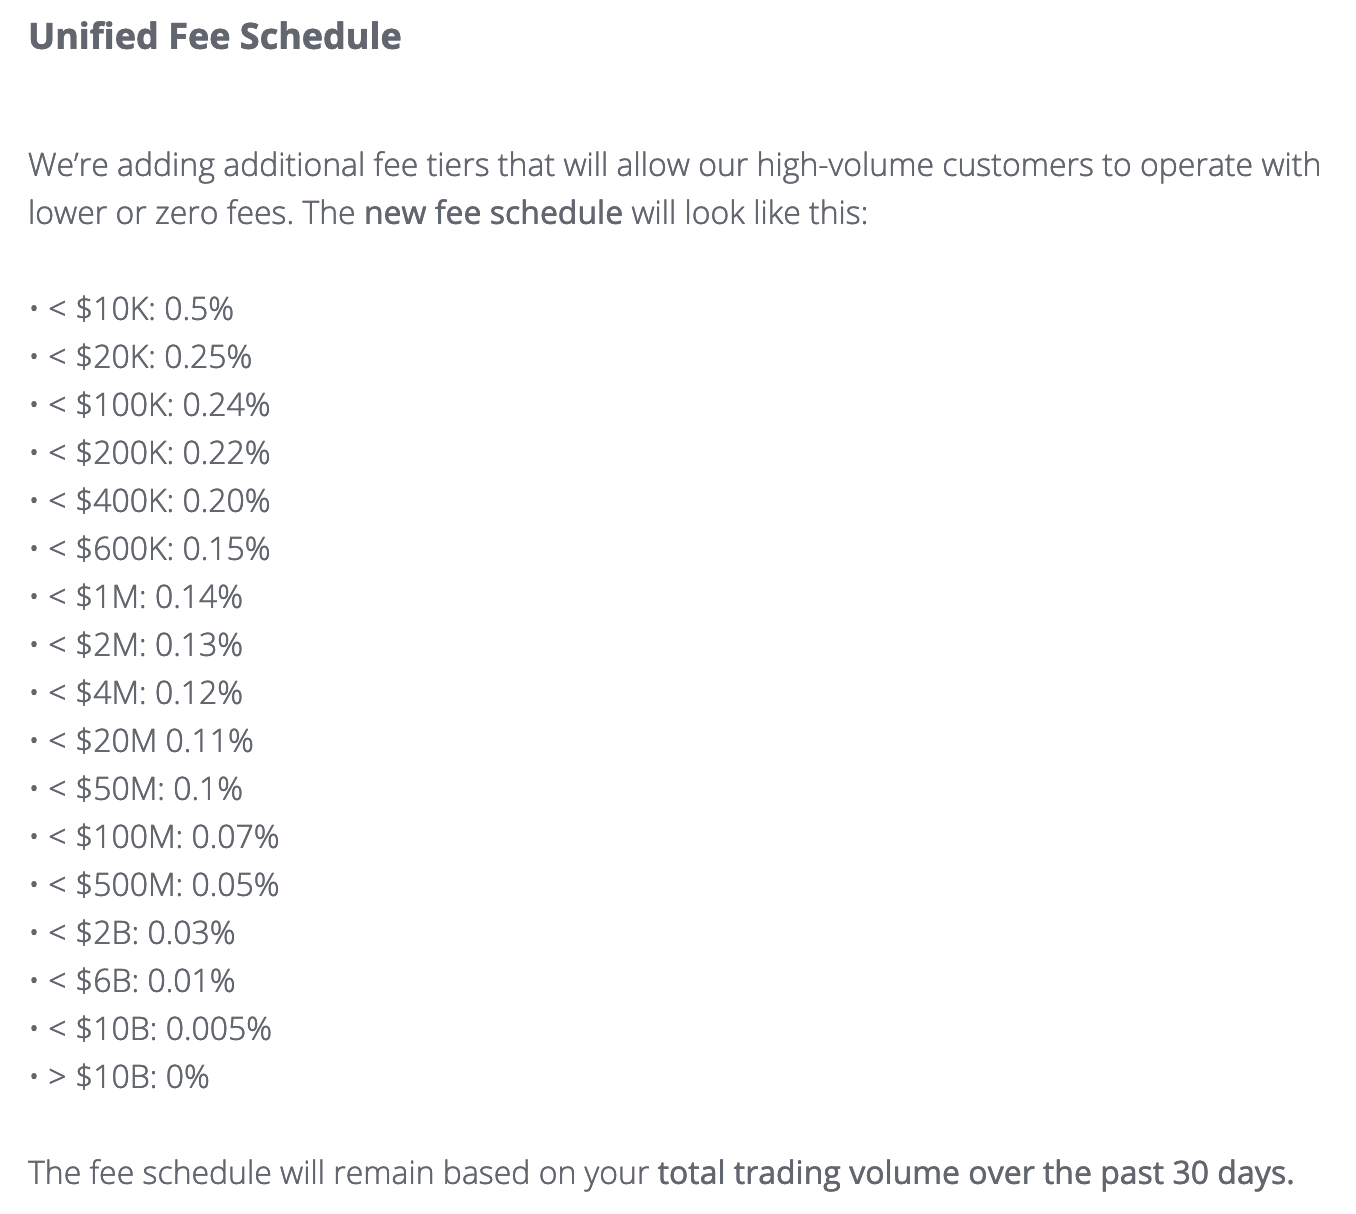
Concurrently, at the end of July, Bitstamp announced they would be implementing lower trading fees. Initially, they planned to put the new fee schedule into effect on August 1st, but ended up delaying the launch until August 20th. Bitstamp’s new fee schedule lowered fees for high-volume customers, making their platform more attractive for institutional grade investors:

Notably, Bitstamp’s new fees are significantly less than Bitfinex’s taker fees for customers who have at least $1 million worth of trades or more over the previous 30 days. Additionally, on October 7th Coinbase started implementing higher fees for its pro users, although we have not yet observed a significant decrease in Coinbase’s BTC-USD volume market share.
The following are Bitfinex’s current fees:

Although the Hong Kong protests began in March, Bitfinex had substantially more trading volume than Bitstamp from April through July. Bitstamp started catching up in late August, when the fee change went into effect, and the NY Supreme Court ruled favorably for the NYAG’s investigation against iFinex. By September, Bitstamp had passed Bitfinex in terms of total trading volume per month.

Compounding iFinex’s problems, usage of the LEO token (which was created by iFinex and supported by Bitfinex) has mostly stalled since its launch in June. The following chart shows the number of unique addresses that hold any balance of LEO (the following stats are all for usage of Ethereum based LEO, as the EOS version has gotten very little usage). As of October 17th, there were only 1,948 addresses that held any LEO.

The below chart shows the number of LEO addresses that hold balance of at least X amount of USD, where X ranges from $1 to $10,000,000. At time of publication, a little over 500 addresses hold at least $1,000 worth of LEO, and 1,182 addresses hold at least $100.

Furthermore, LEO’s active addresses have been steadily declining. We define “active addresses” as the count of unique addresses that either send or receive a transaction over the course of a day. On October 17th, LEO had 17 active addresses.

Network Data Insights
Summary Metrics

By most measures, the major crypto networks declined slightly over the past week. BTC and ETH market caps were down 3% and 3.9%, respectively, week over week. XRP, however, had a relatively good week, with a 6.4% increase in market cap.
XRP and LTC both had relatively large gains in adjusted transfer value compared to both BTC and ETH. ETH had a particularly rough week, dropping by 4.4% in adjusted transfer value and 7% in fees. This is the third week in a row that ETH fees have decreased, after showing strong increases through much of September.
Network Highlights
BTC continues to dominate in terms of daily transfer value. The below chart shows the market share for adjusted transfer value between BTC, ETH, LTC, BCH, and XRP, smoothed using a 7 day moving average. As of October 20th, BTC has a little over 79% of transfer value market share, compared to about 11%, 5%, 4% and 1% for ETH, XRP, BCH, and LTC, respectively.

On October 19th, the Bitcoin network mined its 600,000th block. Later that day, the BTC supply reached 18,000,000 (technically the supply did not reach 18,000,000 at exactly the 600,000th block because historically, some miners did not claim their block rewards). As of end of day October 20th, BTC had a supply of 18,003,467.

Market Data Insights
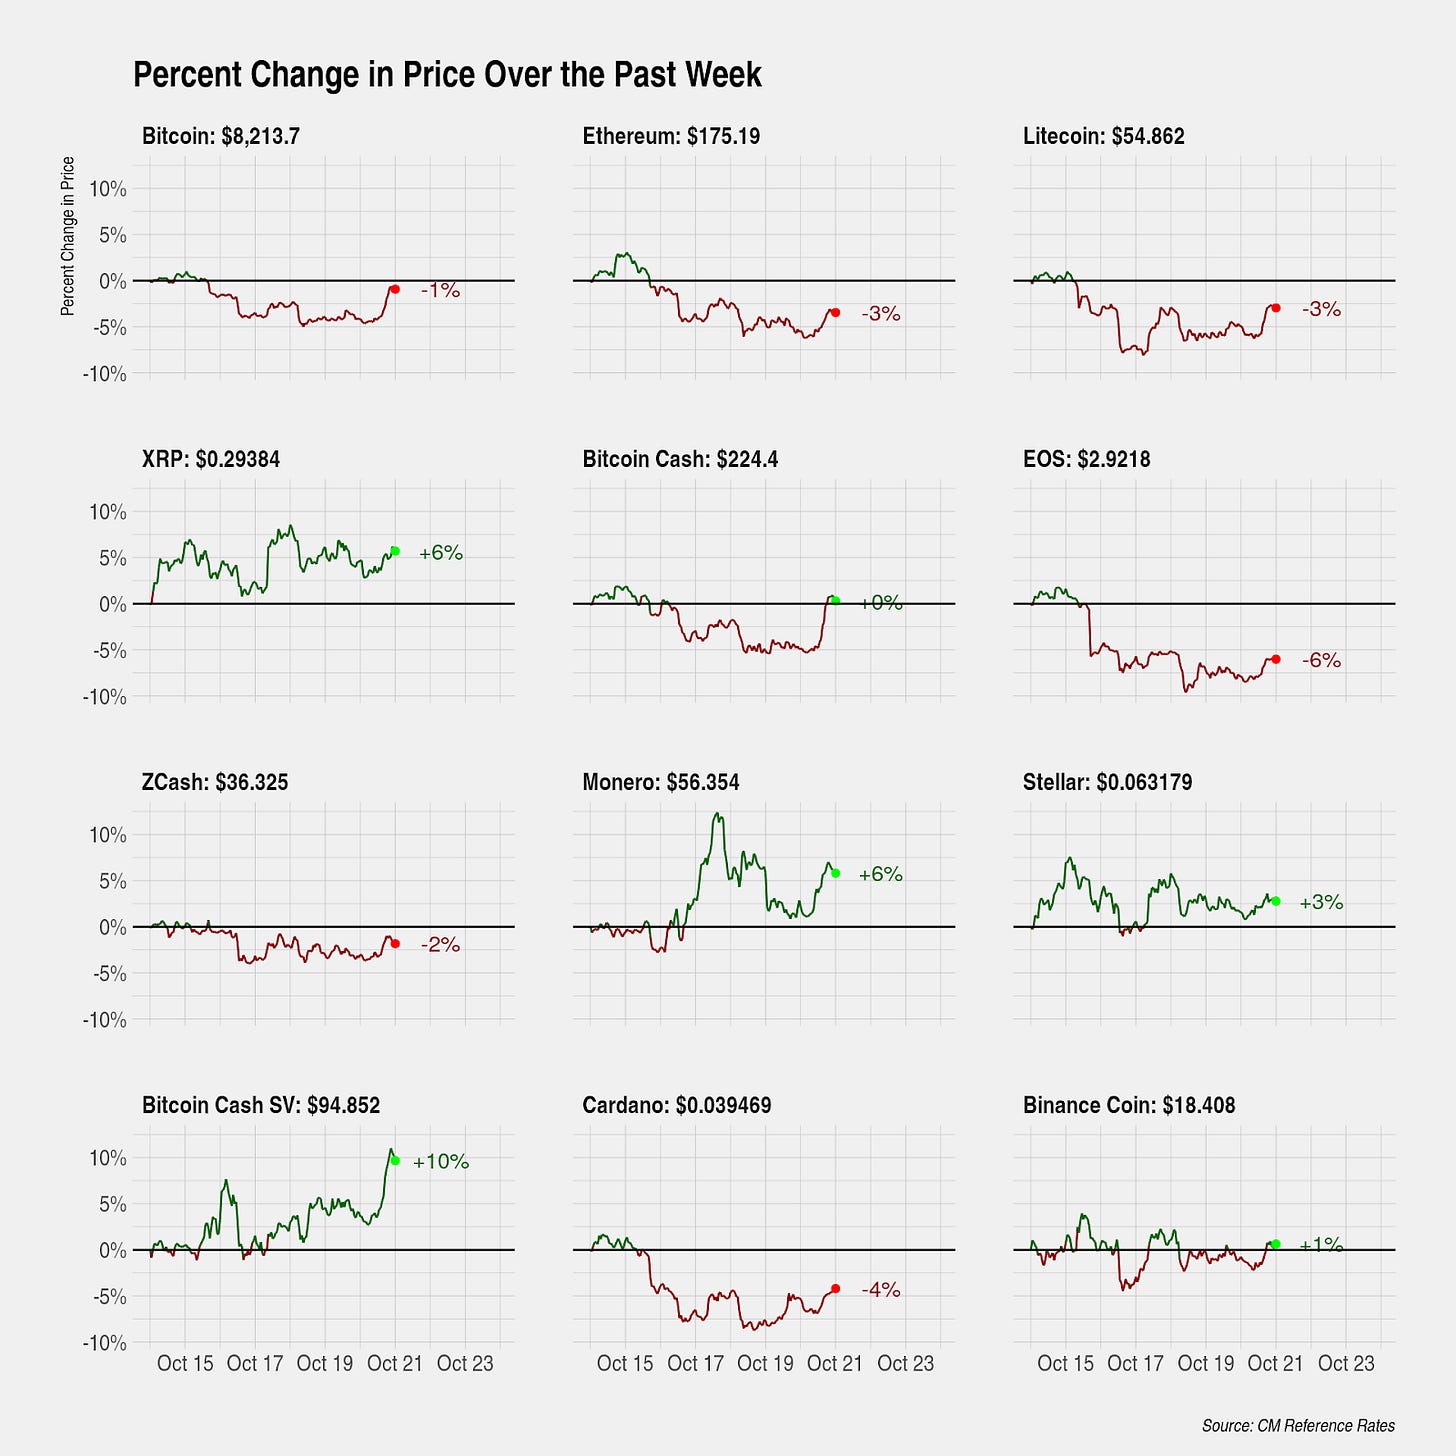
Markets over the past week saw moderate dispersion in returns with many assets experiencing small gains and a slightly larger number of assets experiencing small losses. Among the large capitalization assets, XRP (+6%), Monero (+6%), and Bitcoin Cash SV (+10%) are notable outperformers.


Despite a sharp decline in Bitcoin prices roughly one month ago, volatility measured on a rolling three month basis is again approaching three year lows. Prices staying range bound previously around $10,000 and now at $8,000 have caused volatility to decline to 59%. Previous recent lows in volatility occurred in November 2018 and March 2019 when prices were range bound around the $6,500 level and $3,500 level, respectively. In both those instances, volatility declined below 50% and a sharp change in price followed.
Lowered volatility will incentivize traders to build up positions with increased leverage around the current price. The longer volatility remains muted, the more likely a violent reaction in price will occur. Should prices remain range bound at around $8,000 for another month or so, volatility will fall to levels where previous sharp changes in price occurred.

Meanwhile, volatility for some other assets are approaching all-time lows and are now matching Bitcoin’s volatility levels, indicating that the irrational exuberance for these assets has faded.

CM Bletchley Indexes (CMBI) Insights
CMBI Design Considerations
When considering the pricing methodologies of indexes two of the primary design considerations include:
Timeliness of data - Proponents of timeliness often argue that ‘markets are markets’ and the most recently available data should be reflected. The indexes’ level should reflect the price that can be obtained by trading each one of its constituents in the market at any given point in time.
Manipulation Resistance - The other side of the argument is that taking the most recently available trade data can lead to easily manipulatable index levels, particularly in thinly traded markets. Thus, ingesting more data can add robustness to a reference price, be it more breadth (increased number of exchanges upon which price is ingested) or more depth (taking more observations than just the most recent trades e.g. within a ‘x minute’ time window). Proponents of reliability often argue that a more robust price should be used to prevent manipulation.
This is one of the key design considerations of the CMBI index suite that is currently being constructed behind the scenes at Coin Metrics. It is very easy to believe that in the short term a derivatives crypto asset product could track an index, either single asset or multi asset. But trade-offs between timeliness and reliability get particularly hairy when the derivative product’s volume is greater than the underlying asset.
To address much of this, CMBI design has leveraged both Coin Metrics’ Reference Rates and Real Time Reference Rates. CM Reference Rates are designed to be robust and not easily susceptible to manipulation, achieved through the use of a time-weighted volume-weighted median price, whilst CM Real-Time Reference Rates are designed to be timely, achieved through the use of the most recent trade data available from selected markets. When implemented hand in hand for index construction can overcome many of the pitfalls of each design.
Bletchley Weekly Performance
Most of the Bletchley Indexes started the week with declines before recovering much of the losses over the weekend. Large cap assets performed best with the Bletchley 10 finishing the week flat, despite both Ethereum and Bitcoin finishing the week with losses.

Coin Metrics Updates
This week’s updates from the Coin Metrics team:
Coin Metrics is hiring! We recently opened up 7 new roles, including Blockchain Data Engineer and Data Quality and Operations Lead. Please check out our Careers page to view the openings.
As always, if you have any feedback or requests, don’t hesitate to reach out at info@coinmetrics.io.
Subscribe and Past Issues
Coin Metrics’ State of the Network, is an unbiased, weekly view of the crypto market informed by our own network (on-chain) and market data.
If you'd like to get State of the Network in your inbox, please subscribe here. You can see previous issues of State of the Network here.
Check out the Coin Metrics Blog for more in depth research and analysis.
