Coin Metrics' State of the Network: Issue 106
Tuesday, June 8th, 2021
Get the best data-driven crypto insights and analysis every week:
Coin Metrics is hiring! See open positions in Engineering, Research, and more here.
Weekly Research Focus
Trading Volume Trends
By Nate Maddrey and the Coin Metrics Team
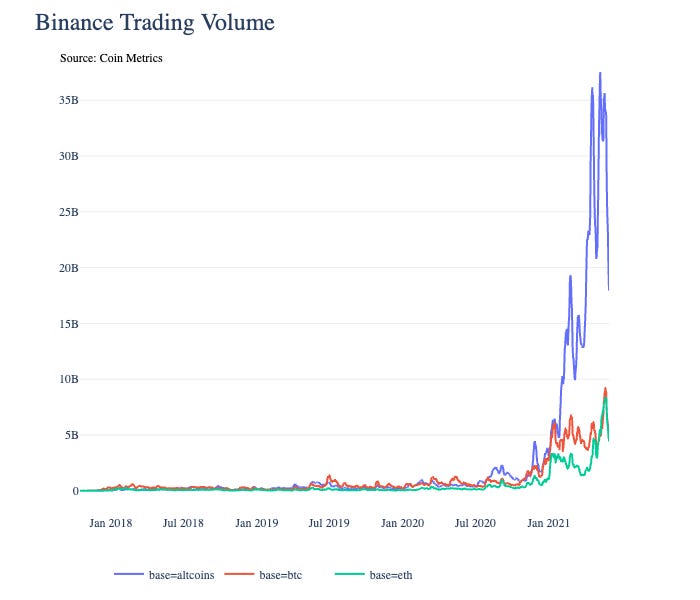
Over the last month, ether (ETH) trading volume has caught up with bitcoin (BTC) volume on Binance, the largest exchange in the world. While BTC led by a fairly large margin in the beginning of the year ETH volume took a big leap forward in May.
The past month was an outlier in many ways with meme coins like DOGE dominating headlines and a large crash that took down the market. Although it’s still too early to tell whether these trends will last or if they were just a flash in the pan, trading volume data provides some insights into what happened in the crypto markets over the last few months.
Note: All of the charts and data in this piece include only USD and stablecoin trading pairs, and do not include other crypto-to-crypto or crypto-to-fiat pairs.
Source: Coin Metrics Market Data
Smaller-cap cryptoassets have surged across the board in 2021. Altcoin trading volume (“altcoin” in this context meaning any non-BTC or non-ETH cryptoasset) on Binance began to climb in January and peaked on May 10th, right before the crash. Binance has hundreds of altcoin pairs, so it's not surprising to see Binance altcoin volume overtake BTC and ETH. But the ratio of altcoin volume to BTC has taken a noticeable leap upwards considering it was almost even to start the year.
Source: Coin Metrics Market Data
A big part of the Binance altcoin surge was due to Dogecoin (DOGE). DOGE trading volume on Binance briefly surpassed BTC and ETH volume in May, although it has since declined.
Source: Coin Metrics Market Data
But there has been an increase in other altcoins as well, including Binance Coin (BNB), Ripple (XRP), Cardano (ADA), and Polygon (MATIC). Overall, ETH trading volume on Binance surpassed BTC volume in May, although it was relatively close: about $191B for ETH compared to $188B for BTC. DOGE came in third at about $116B.
Source: Coin Metrics Market Data
Other exchanges showed similar trends over the last month. ETH trading volume shot up on Coinbase in May (counting only USD and stablecoin pairs), with a large spike on May 19th.
Source: Coin Metrics Market Data
ETH volume surpassed BTC volume on Coinbase by a wider margin than on Binance. Coinbase did not offer Dogecoin trading in May (although they introduced it in early June), so it did not have a DOGE rush similar to Binance. But it did have a relatively high amount of volume for some other altcoins, led by MATIC, ADA, and Ethereum Classic (ETC).
Source: Coin Metrics Market Data
Continuing the trend, ETH volume edged out BTC on FTX, although not by much. But comparatively, the top altcoins made up a lower percentage of total volume on FTX than on Binance and Coinbase.
Source: Coin Metrics Market Data
ETH volume also topped BTC volume on Huobi. Similar to Binance, DOGE volume surged on Huobi, taking the spot as the third most traded currency by volume.
Source: Coin Metrics Market Data
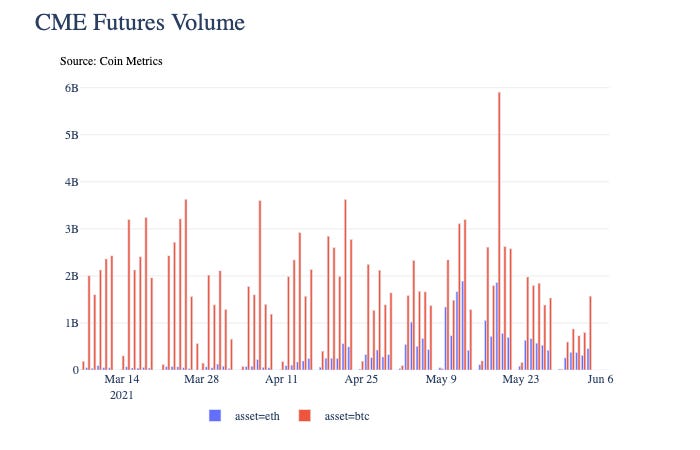
While ETH has surpassed BTC volume on most of the major exchanges, BTC still leads on the Chicago Mercantile Exchange (CME), a preferred destination for institutional investors. CME only introduced ETH futures in February but they have been gaining momentum since then. Although it appears retail investors trading on exchanges like Binance and Coinbase have favored ETH over the last month, it appears that institutional investors are still favoring BTC.
Source: Coin Metrics Market Data
To explore more Coin Metrics data check out our free charting tool, formula builder, correlation tool, and mobile apps.
Network Data Insights
Summary Metrics
Source: Coin Metrics Network Data Pro
The markets continued to move mostly sideways over the last week. Bitcoin and Ethereum usage both stayed relatively flat, with daily active addresses dropping 2.5% and growing by 3.3% respectively. Ethereum daily transaction fees dropped by over 35% week-over-week as gas prices continued to fall. And Bitcoin transaction fees followed a similar pattern, dropping by 40.5%.
Network Highlights
Bitcoin’s difficulty was adjusted downward by about 16% at the end of May. Bitcoin difficulty adjusts every two weeks to keep a target block time of ten minutes on average. A higher difficulty requires a higher aggregate hash rate to keep block time at ten minutes, while a decrease in difficulty signals hash rate has dropped. Bitcoin hash rate fell in mid-May following the price crash and reports that some Chinese mining operations were knocked offline. Although a 16% decrease is a relatively large difficulty adjustment, it followed a 22% increase earlier in May. Difficulty is still above levels of early May which signals that the hash rate drop was likely less severe than initially feared.
Source: Coin Metrics Network Data Charts
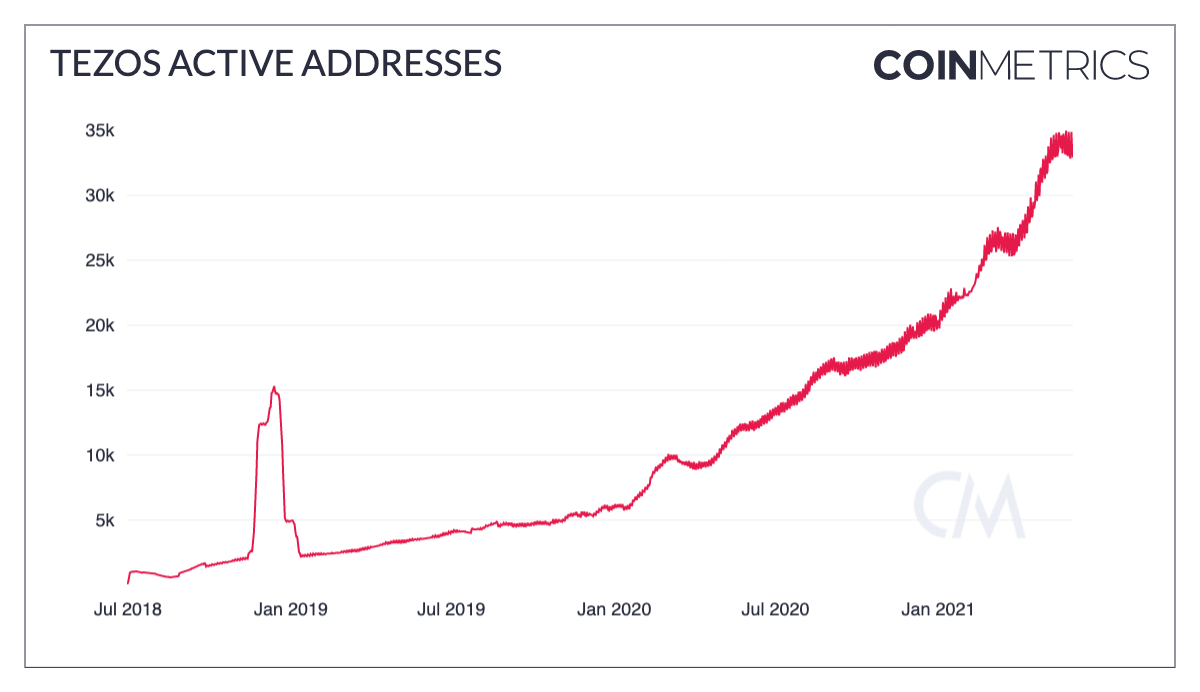
Tezos daily active addresses (30-day average) have surged since March after Tezos-based NFT marketplace Hic et Nunc started gaining traction. Tezos’ relatively low transaction fees makes it economical to sell NFTs at low prices compared to Ethereum, which has led to a surge of both artists and collectors.
Source: Coin Metrics Network Data Charts
Coin Metrics Updates
This week’s updates from the Coin Metrics team:
Check out our new market-data focused newsletter State of the Market, featuring weekly updates on market conditions.
We’re excited to announce the new Coin Metrics mobile app. View real-time cryptoasset pricing and relevant on-chain data in a single app! Download for free here: https://coinmetrics.io/mobile-app/
As always, if you have any feedback or requests please let us know here.
Subscribe and Past Issues
Coin Metrics’ State of the Network, is an unbiased, weekly view of the crypto market informed by our own network (on-chain) and market data.
If you'd like to get State of the Network in your inbox, please subscribe here. You can see previous issues of State of the Network here.
Check out the Coin Metrics Blog for more in depth research and analysis.


