Coin Metrics' State of the Network: Issue 92
Tuesday, March 2nd, 2021
Get the best data-driven crypto insights and analysis every week:
Weekly Research Focus
Back on Solid Ground
By Nate Maddrey and the Coin Metrics Team
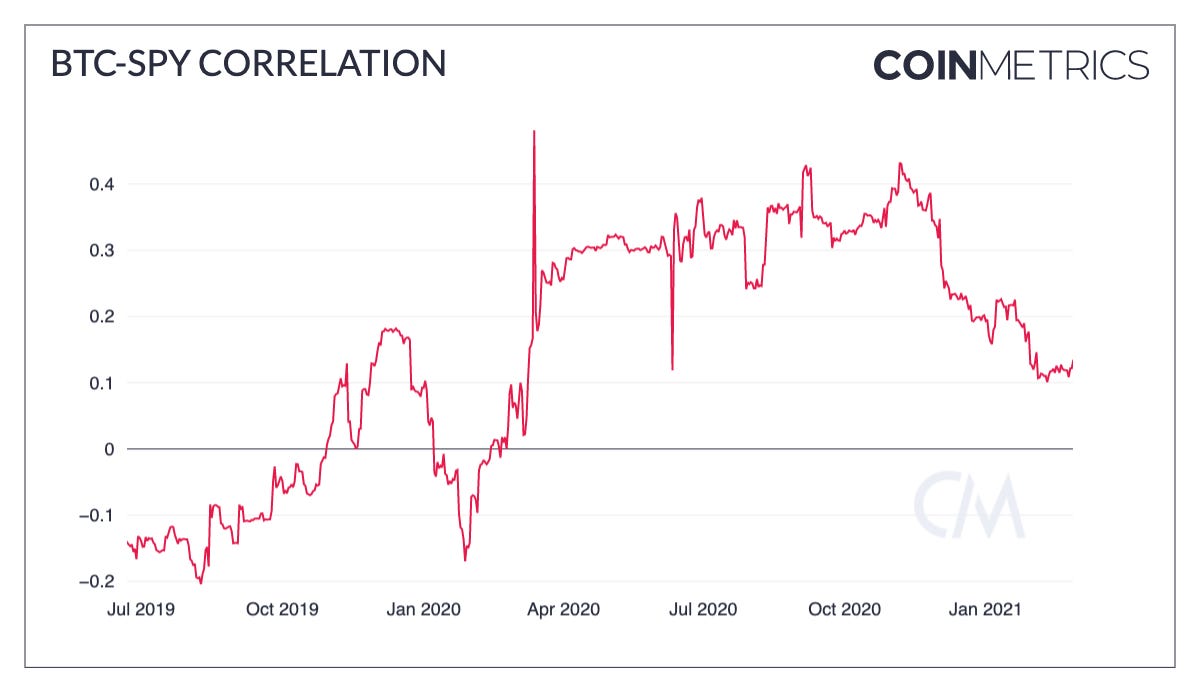
The market took a downturn last week after bitcoin (BTC) reached as high as $58K. The stock market also sold off as the 10-year Treasury note yield had its highest one-month increase since 2016. As a result of the dual selloffs the 90-day rolling correlation between BTC and the S&P 500 (SPY) started to increase over the past week after trending downwards for most of February. The correlation between the two shot up after the March 2020 crash but has been dropping since November 2020 with BTC’s rise.
Source: Coin Metrics Correlation Charts
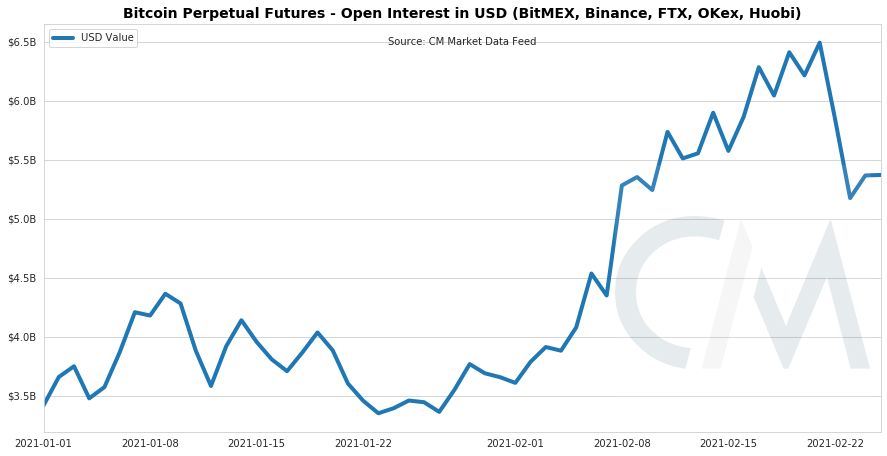
BTC futures open interest levels hit record highs preceding the selloff. A measurement of the total amount of active futures contracts, high open interest can signal that system-wide leverage is at high levels. Futures contracts are commonly bought using leverage, effectively using borrowed capital to increase potential returns.
But open interest came crashing down on February 21st. As BTC price fell, futures contracts were liquidated en masse, closing out a portion of open interest. Although liquidations can be painful in the short-term they can be healthy over the long-term as leverage levels get reset.
Source: Coin Metrics Market Data
The week’s liquidations can be seen in the below chart which shows the value of liquidated BTC perpetual future contracts for February 12th-25th. The green “buys” represent short sellers that were forced to buy to cover their positions. The red “sells” represent longs that were forced to sell to cover.
Short sellers were liquidated at a relatively steady pace on the run up towards $60K. But major pain occurred on the way back down. As BTC dropped below $50K a large amount of long contracts were liquidated in the $47-49K range.
The large amount of long-liquidations compared to short-liquidations shows that a disproportionate amount of contracts were going long, a sign of the market’s bullishness. On that note, some market participants considered this drawdown overdue as it had been over a month since a similar pullback had occurred. Open interest may therefore have become "overheated" and in need of a reset.
Source: Coin Metrics Market Data
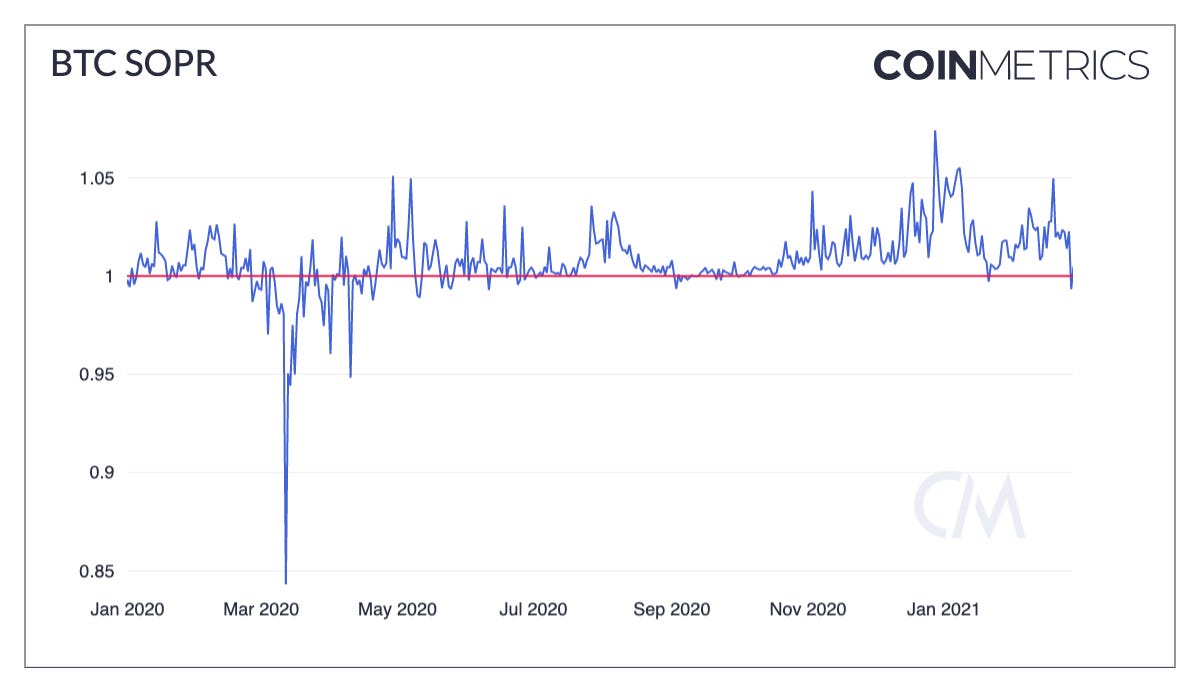
On-chain data also shows signs of a reset. Spent output profit ratio (SOPR) is a ratio of price at the time a UTXO was spent to its price at the time of creation. In other words, it’s a proxy for price sold over price paid. It’s typically used to estimate whether holders are selling at a profit or at a loss.
BTC SOPR dropped below one on February 27th for only the second time since October 2020, which implies that investors were capitulating and selling at a loss. But it rebounded back above one on February 28th which signals that the market is stabilizing. To read more about SOPR and other on-chain indicators see our On-chain Indicators Primer report.
Source: Coin Metrics Formula Builder
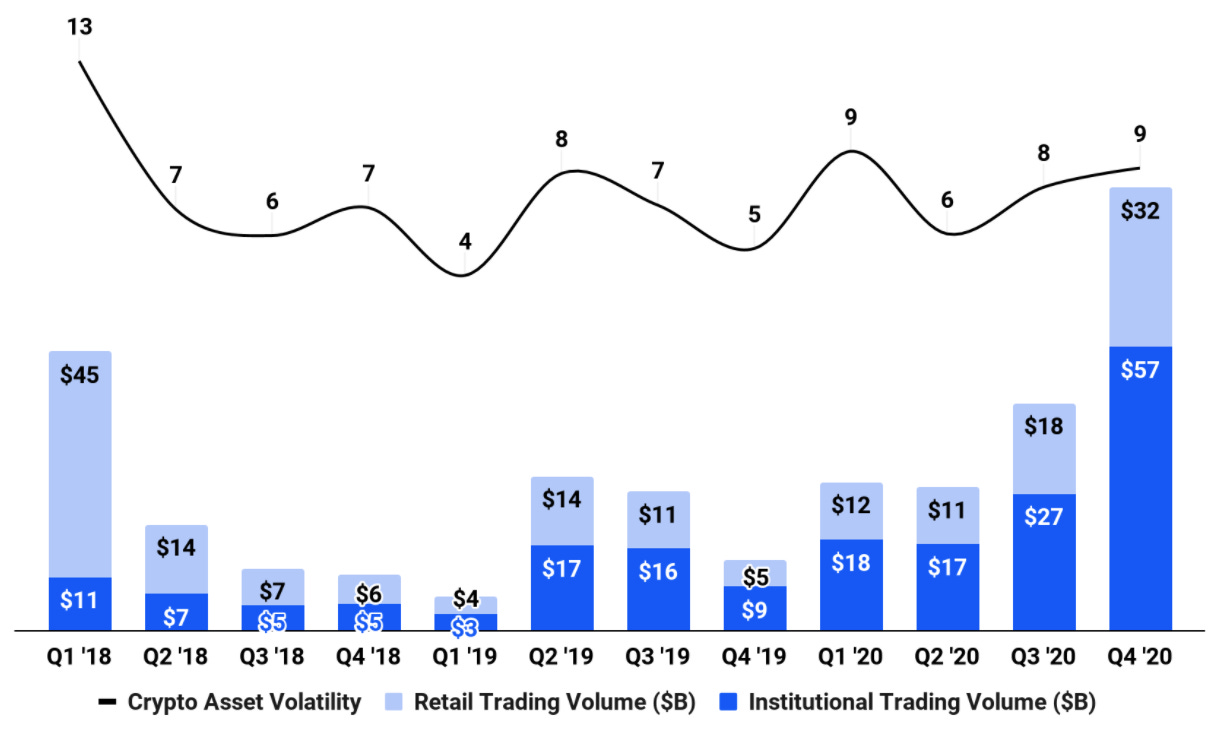
Amidst the market volatility Coinbase released their S-1 regulatory filing on February 25th in anticipation of going public. The filing was over 200 pages and contained a lot of interesting information about Coinbase’s operations. As part of the filing Coinbase disclosed their amount of users: about 43 million registered retail users and 7,000 institutional accounts. Monthly transacting users grew to 2.8M in Q42020, eclipsing Q1 2018.
But there’s been a big difference between the type of users in Q4 2020 vs Q1 2018: during the current run a majority of trading volume has been institutional compared to mostly retail driven volume in 2018. This adds to the growing evidence that institutions are increasingly embracing crypto and is a good sign for BTC’s continued growth throughout 2021.
Network Data Insights
Summary Metrics
Source: Coin Metrics Network Data Pro
The market was down this past week but on-chain metrics held relatively steady. BTC active addresses increased by 0.8% week-over-week while ETH active addresses grew by 1.1%. Hash rate also continued to climb for both Bitcoin and Ethereum. A proxy for network security, increasing hash rate is a positive sign for the health of both blockchains.
Stablecoins had a big week amidst the market volatility. USDC led the way, with market cap increasing by about $1B on the week. USDC transfers also surged, increasing by 13.5% week-over-week for an average of about 60.4K a day.
Network Highlights
USDC is going parabolic. Total USDC supply passed 9 billion on February 28th after passing 8 billion just six days earlier. USDC supply has more than doubled since the start of the year.
Source: Coin Metrics Network Data Charts
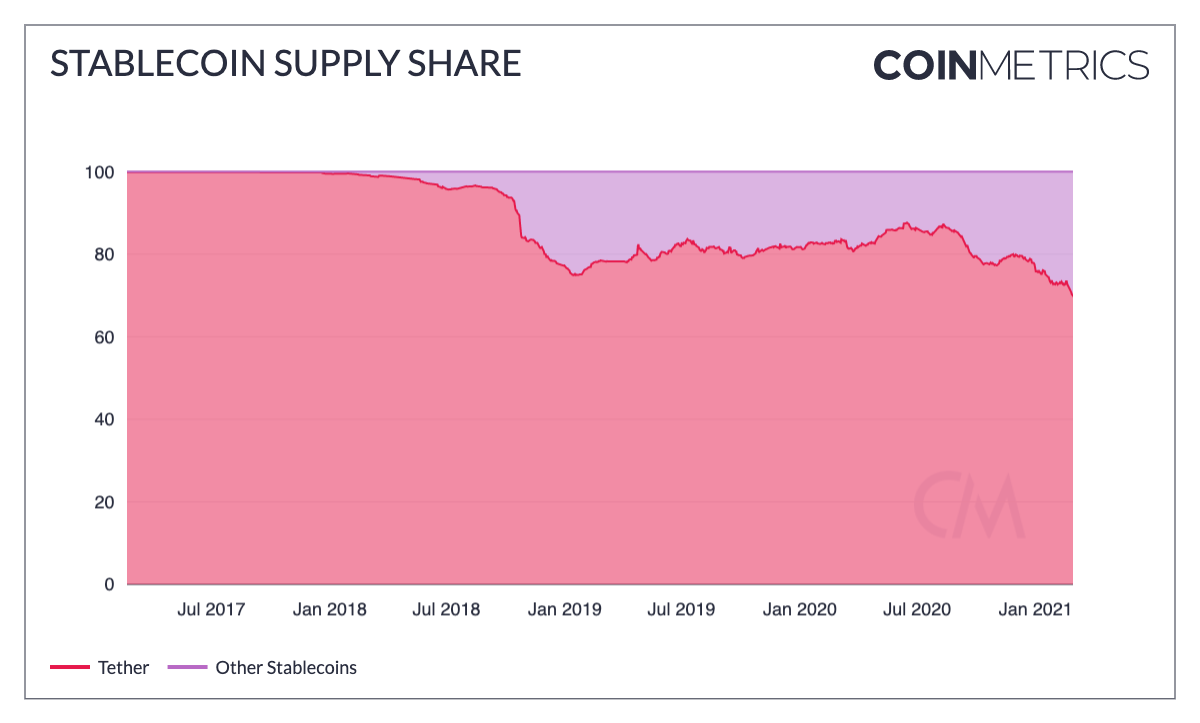
As a result of USDC’s rapid rise Tether’s (USDT) supply dominance has dropped to 70%, its lowest level ever.
Source: Coin Metrics Network Data Charts
Stablecoins as a whole are on the rise again in 2021. Stablecoins are now used extensively in decentralized finance (DeFi) as collateral and for other purposes. They’re used to hold money on the sidelines amidst market volatility and are used to trade in and out of BTC, ETH, and countless other cryptoassets. Additionally, they’re increasingly being used to move money around the world and for foreign aid. As the use cases for stablecoins continue to grow, supply will likely keep on rising.
Total stablecoin supply has increased to over 50 billion, growing from about 30 billion to start the year.
Source: Coin Metrics Network Data Charts
Stablecoin active addresses have also surged along with supply, signaling high activity. Throughout most of February stablecoins have averaged over 300K unique active addresses per day. On February 18th stablecoin total active addresses topped 400K, a new all-time high.
Source: Coin Metrics Network Data Charts
Coin Metrics Updates
This week’s updates from the Coin Metrics team:
We’re excited to announce the new Coin Metrics mobile app. View real-time cryptoasset pricing and relevant on-chain data in a single app! Download for free here: https://coinmetrics.io/mobile-app/
As always, if you have any feedback or requests please let us know here.
Subscribe and Past Issues
Coin Metrics’ State of the Network, is an unbiased, weekly view of the crypto market informed by our own network (on-chain) and market data.
If you'd like to get State of the Network in your inbox, please subscribe here. You can see previous issues of State of the Network here.
Check out the Coin Metrics Blog for more in depth research and analysis.


