Coin Metrics' State of the Network: Issue 53
Tuesday, June 2nd, 2020
Get the best data-driven crypto insights and analysis every week:
Measuring Bitcoin’s Trading Volume
by Kevin Lu and the Coin Metrics Team
Current market conditions have led to a resurgence of institutional interest in Bitcoin. In the face of an unparalleled monetary and fiscal policy response from central banks and governments around the world, more institutions are recognizing that such policies significantly increase the probability of policy error, either by inciting financial imbalances in certain sectors of the economy or by stoking higher levels of inflation.
Here we examine, from the perspective of an institution considering entering the market, the distribution and size of Bitcoin’s volume across its various markets. The following is a preview of an upcoming research piece with ARK Invest which will feature a more comprehensive analysis of an institutional approach to Bitcoin.
The Many Facets of Bitcoin’s Volume
Calculating Bitcoin’s market capitalization is relatively straightforward. Coin Metrics estimates Bitcoin’s free float market capitalization to be $136 billion, giving it a size similar to that of the largest publicly traded companies in the United States. An assessment of volume, however, is more complicated and different calculation methodologies can yield significantly different results.
Bitcoin’s market structure is unique in that it most closely mirrors that of foreign exchange markets. It is similar in that it is globally distributed, operates 24 hours a day, and its markets utilize a base asset and quote asset convention. The exception is that a significant portion of trading volume occurs on centralized exchanges that match trades from any market participant rather than through an interbank market.
Source: Coin Metrics Market Data Feed
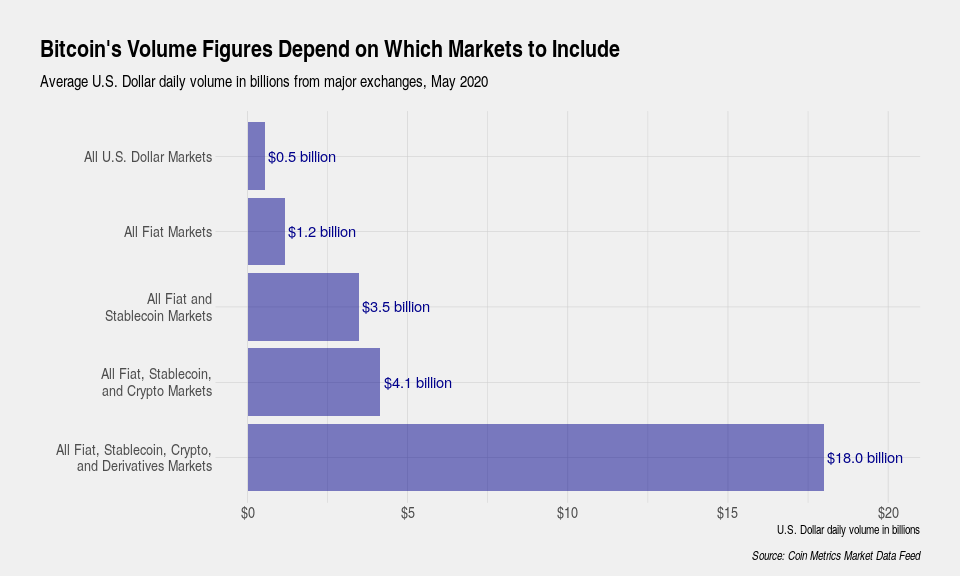
Bitcoin’s daily trading volume can be evaluated at different levels of aggregation. For a buy-side institution interested in deploying fresh capital into the space, the trading volume of Bitcoin spot markets quoted in U.S. dollars of $0.5 billion per day from major exchanges is perhaps the most relevant. With this level of trading volume, a buy-side institution wishing to not exceed one percent of total trading volume could expect to deploy $5 million in capital per day.
While the Bitcoin trading ecosystem consists of hundreds of centralized exchanges, a handful of decentralized exchanges, and several OTC desks, the majority of trading occurs on a set of major centralized exchanges. In this analysis, our volume figures are derived from a set of major exchanges consisting of Binance, Binance.US, Bitfinex, bitFlyer, Bithumb, BitMEX, Bitstamp, Bittrex, Bybit, CEX.IO, Coinbase, FTX, Gate.io, Gemini, Huobi, itBit, Kraken, Liquid, OKEX, Poloniex, and Upbit.
Source: Coin Metrics Market Data Feed
Distribution of U.S. dollar quoted spot market volume follows a power law where roughly 90 percent of the volume is concentrated in the top four exchanges in our sample: Coinbase, Bitstamp, Bitfinex, and Kraken. The fragmented nature of trading volume and liquidity in this space indicates that institutions should expect to go through a process of onboarding with multiple exchanges to access the full spectrum of trading activity.
Source: Coin Metrics Market Data Feed
Expanding the set of markets to include any fiat markets increases daily trading volume to $1.2 billion with the U.S. dollar consisting of roughly half of the total. Aside from the U.S. dollar, the major fiat quote currencies are the Japanese yen, the euro, the Korean won and the British pound. This set of major exchanges chosen in our analysis excludes some smaller regional exchanges, but their volume is too low to be realistically considered by institutions.
Source: Coin Metrics Market Data Feed
Stablecoins have evolved to be systemically important to Bitcoin’s ecosystem and continue to gain trading volume market share. Including markets quoted in stablecoins significantly increases the daily trading volume to $3.5 billion, primarily due to Tether -- a stablecoin which operates in a regulatory gray zone. Thus, buy-side and sell-side institutions must make a critical decision whether the advantages of participating in stablecoin markets in the form of increased liquidity and trading activity outweigh the risks. More regulatory compliant stablecoins such as USD Coin, Paxos Standard, or TrueUSD have insignificant volumes compared to Tether.
Source: Coin Metrics Market Data Feed
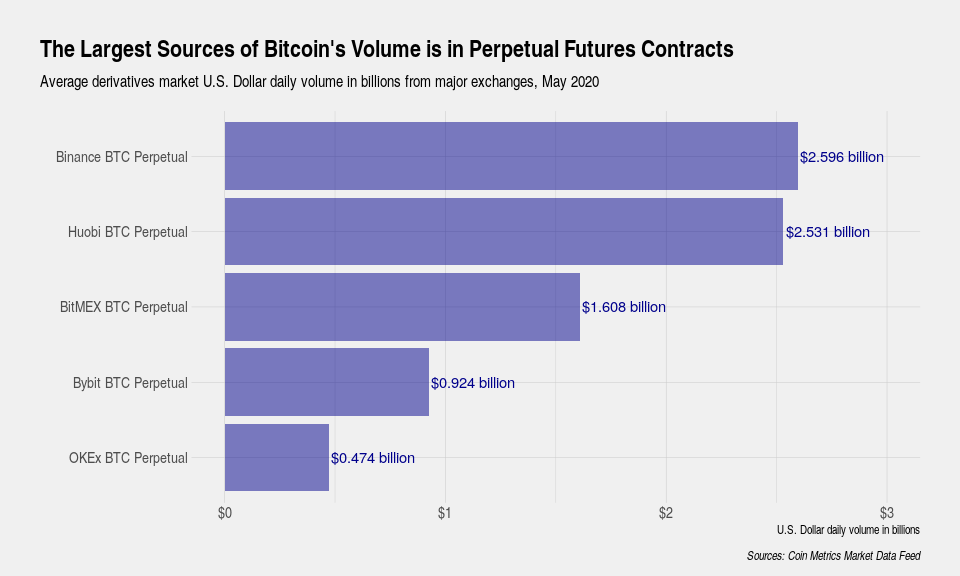
The largest increase is observed when derivatives markets are added to the mix. Similar to other asset classes, derivatives markets in Bitcoin are several times larger compared to spot markets. If reported volumes are to be believed, gaining exposure through derivatives markets may be the most efficient path. However, crypto derivative markets are still developing, and market participants must contend with a confused mixture of differing contract specifications. Contracts that accept margin in and settle profit and loss in Bitcoin, stablecoins, and fiat all exist.
Bitcoin’s Volume is Still Small But Growing
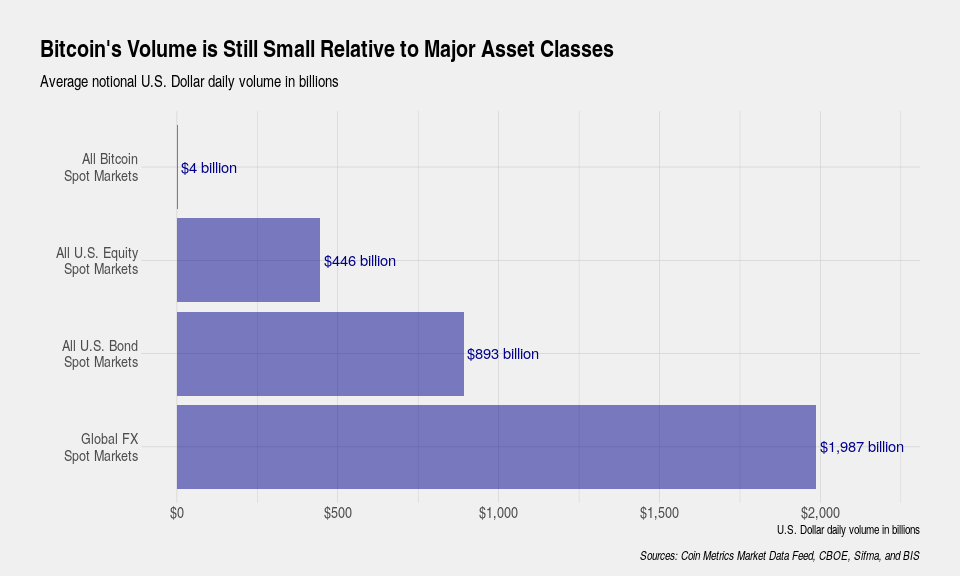
Assessing the many facets of Bitcoin’s trading volume can be aided with a frame of reference. Here we compare the spot volume of Bitcoin with the spot volume from other asset classes.
Source: Coin Metrics Market Data Feed
With daily trading volume of only $4.1 billion, Bitcoin’s spot markets are still minuscule in comparison to U.S. equity markets, U.S. bond markets, and global foreign exchange markets. The interpretation is that Bitcoin, in its current state, is most comparable in size to a large capitalization stock rather than a distinct asset class. A large institutional investor such as an endowment, pension fund, or sovereign wealth fund might reasonably conclude that Bitcoin is only suitable for a portion of the already small allocation to alternative assets rather than carving out a separate allocation towards it.
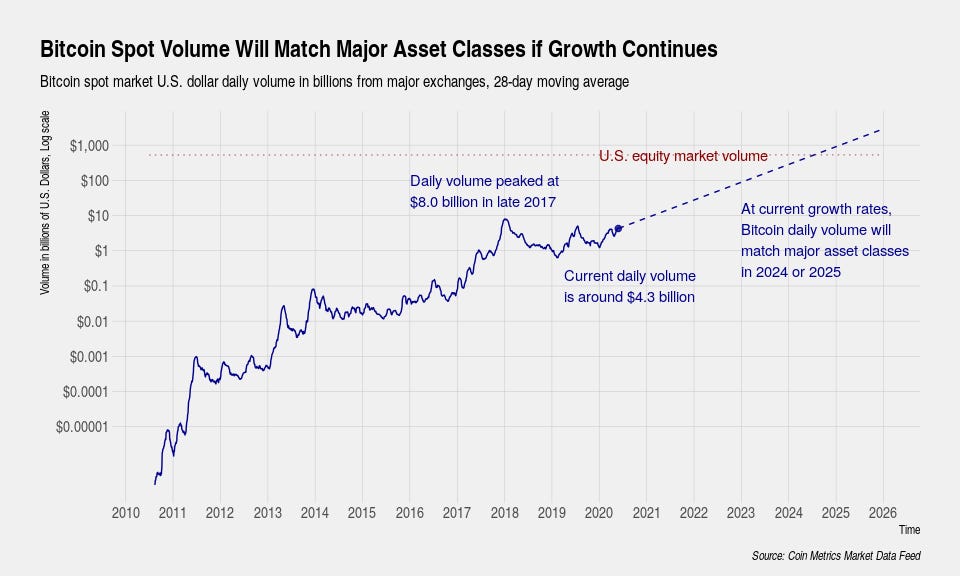
If historical growth rates can be maintained, however, Bitcoin’s current daily volume from spot markets of $4.3 billion would need fewer than 4 years of growth to exceed daily volume of all U.S. equities. Fewer than 5 years of growth are needed to exceed daily volume of all U.S. bonds.
Source: Coin Metrics Market Data Feed
Conclusion
The fragmentation of trading volume in the Bitcoin ecosystem prevents a straightforward assessment of its market size. Institutions considering entering the space should first survey the landscape and make a determination of which exchanges, markets, and assets they feel comfortable transacting in. Critical decisions such as whether they would be willing to transact in stablecoins such as Tether or use derivatives such as perpetual futures contracts can have a material impact on evaluation of trading volume and liquidity. Regardless of these decisions, all facets of Bitcoin’s trading volume have experienced exponential growth and, if sustained, will grow to levels similar to major asset classes.
Network Data Insights
Summary Metrics
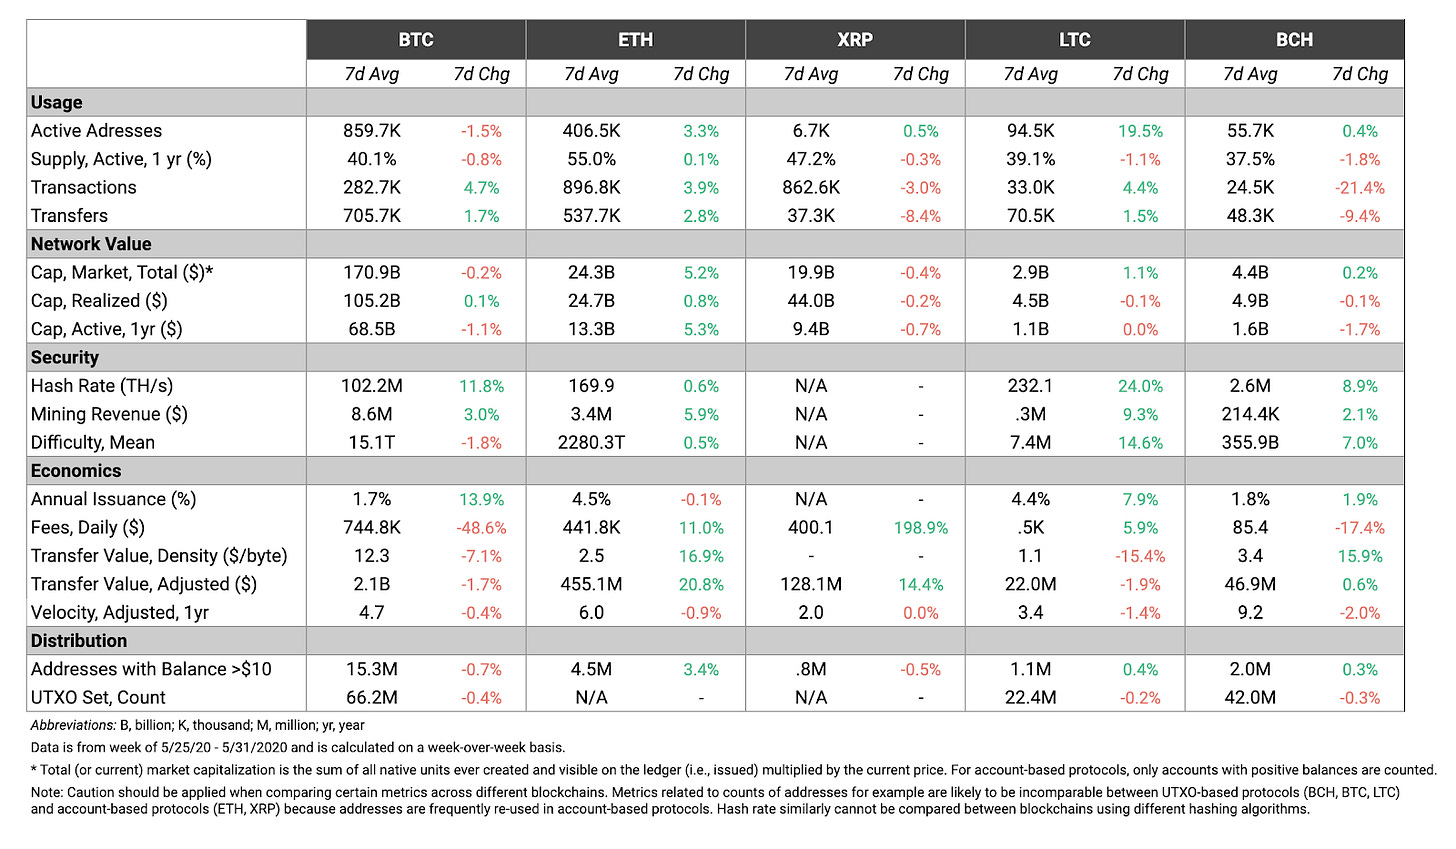
Source: Coin Metrics Network Data Pro
Ethereum (ETH) surged over the weekend and finished the week in the green for most metrics. ETH daily transaction fees grew 11.0% week-over-week, with an average of $441.8K worth of fees per day. In contrast, Bitcoin (BTC) fees fell 48.6% week-over-week, after showing strong growth over most of May. BTC fees reached $1.82M on May 21st, which is the highest daily total since June 2019.
Network Highlights
When a transaction is broadcast into the Bitcoin network, before it can be included in a block it is temporarily held in a waiting area called the mempool (short for “memory pool”). Miners usually select the highest feerate transactions from the mempool to include in their mined block.
After the halving, the Bitcoin mempool started filling up with transactions. This was a result of the hash rate drop and subsequent rise of the average interval between Bitcoin blocks following the halving, as reported in the Network Highlights section of SOTN Issue 51. A longer interval between blocks means fewer blocks being mined per day, which in turn results in fewer transactions confirming, causing the mempool to fill up.
Over the last weeks, the Bitcoin mempool grew and peaked at about 80k unconfirmed transactions.
With the increased transaction count, two methods that Bitcoin Core software utilizes to self-regulate the mempool size could be observed. Firstly, transactions paying a low feerate of just above 1 sat/vByte were evicted from the mempool to make room for higher feerate transactions. The transactions kept in a Bitcoin Core node’s mempool are capped to only use a fixed part of the system's memory.
In total 7,126 transactions were evicted between May 20th, 09:50 UTC, and May 22nd, 14:30 UTC. The evictions all happened during European and US business hours, the time with the highest network activity.
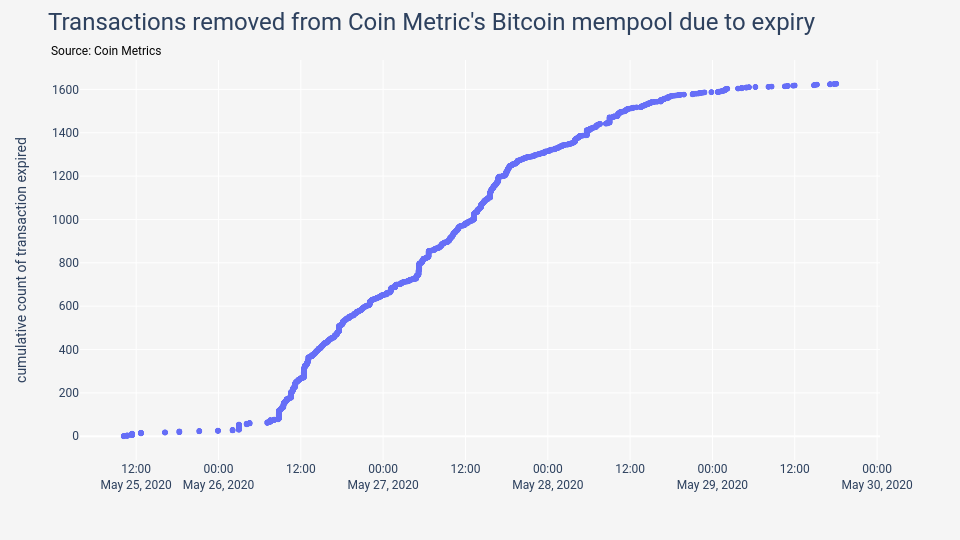
Secondly, transactions residing in the mempool for over two weeks expired. By default, Bitcoin Core nodes remove transactions from their mempool if no miner found transaction fees to be attractive enough to include them in a block over the last 336 hours (two weeks).
In total 1,627 transactions expired between May 25th, and May 30th. Only 35% of these resided in the mempool for two weeks. The remaining 65% likely spent unconfirmed parent transactions and became invalid as their parents expired.
Market Data Insights
Bitcoin Correlation With Gold Remains High
The overall market environment continues to be favorable for Bitcoin. On the margin, the policy response to the coronavirus, the protest-related civil unrest in the United States, and the potential for a re-escalation of the trade war between the United States and China should be supportive for store-of-value assets such as Bitcoin. The correlation between gold has consistently maintained relatively high levels for several months now, a phenomenon that has not been historically observed.
Source: Coin Metrics Reference Rates
Signs of Altcoin Season Regime Shift
Some interesting signs are emerging that may mark the beginning of an altcoin season regime shift. Ethereum, the primary platform that the majority of altcoins are based on, has begun to outperform other major assets. Cardano is up over 40% this week after announcing a release date for its next major upgrade, named Shelley. And OmiseGo surged over 100% after Coinbase announced that it would begin listing the asset on its platform. Such market movements in response to mainnet launches, new product upgrades, and exchange listings are reminiscent of late 2017.
Source: Coin Metrics Reference Rates
CM Bletchley Indexes (CMBI) Insights
In the last week of May, most CMBI and Bletchley Indexes recovered the previous week’s losses, with the CMBI Ethereum Index being the outstanding performer. Having only fallen 1% last week, the CMBI Ethereum Index was again the strongest performer, returning 14.7% this week.
All of the Bletchley Indexes experienced returns between 9% and 11%, demonstrating the uniform strength of the market across all large, mid and small cap assets.
Coin Metrics Updates
This week’s updates from the Coin Metrics team:
Coin Metrics is hiring! Please check out our Careers page to view the openings.
As always, if you have any feedback or requests, don’t hesitate to reach out at info@coinmetrics.io.
Subscribe and Past Issues
Coin Metrics’ State of the Network, is an unbiased, weekly view of the crypto market informed by our own network (on-chain) and market data.
If you'd like to get State of the Network in your inbox, please subscribe here. You can see previous issues of State of the Network here.
Check out the Coin Metrics Blog for more in depth research and analysis.


