
Coin Metrics' State of the Network: Issue 13
Tuesday, August 20, 2019

Intro and Updates
Dear crypto data enthusiasts,
Welcome back to this week’s edition of Coin Metrics’ State of the Network, an unbiased, focused view of the crypto market informed by our own network (on-chain) and market data.
This week’s housekeeping items:
Coin Metrics was recently featured in the Wall Street Journal! Checkout the full article here.
Last week, we released a new research report about evaluating fork legitimacy. The long-form piece examines whether an exchange, index provider, investment manager, or any market participant should support a new fork or credit holders of the parent chain with units of the forked asset. Read the full report here.
Coin Metrics is hiring! We recently opened up 7 new roles, including Blockchain Data Engineer and Data Quality and Operations Lead. Please check out our Careers page to view the openings.
As always, if you have any feedback or requests, don’t hesitate to reach out at info@coinmetrics.io.
Weekly Feature
Analyzing Wealth Distribution in Crypto
The distribution of wealth in crypto assets has been a recent topic of debate. The debate has centered around whether a lack of wealth distribution -- i.e., wealth centralization -- could prevent future adoption of crypto.
While this is an important question to answer, before it can be answered, we must first ask how is wealth actually distributed in crypto? Is distribution unequal? How does it compare to other asset classes? And by what metrics can we measure this?
In this week’s feature, we’ll discuss how to define and measure wealth distribution, and look at some data for the top crypto assets. This will be the first of several pieces to look at wealth distribution data and Coin Metrics will continue to explore this topic in the future.
To begin, it’s important to distinguish between wealth distribution and income distribution. Wealth distribution differs from income distribution in that it looks at the distribution of ownership of the assets in a society, rather than the current income of members of that society. In all state economies, wealth is significantly less equally distributed than income.
According to The World Economic Forum (WEF) Inclusive Development Index 2018, “this problem has improved little in recent years, with wealth inequality rising in 49 economies." The table below highlights this discrepancy across the 5 most productive state economies and the most distributed (Iceland) and least distributed (Namibia) economies among the sample studied. In the United States, wealth is almost 2.3 times less equally distributed than income when measured by the Gini Coefficient. The Gini Coefficient is a statistical measure of distribution. The coefficient ranges from 0 (or 0%) to 1 (or 100%), with 0% representing perfect equality and 100% representing maximal inequality.
Table 1: Wealth and Income Distribution Across Select Countries in the WEF Inclusive Development Index 2018

Before we turn to crypto, there is another critical point worth making: "wealth" in the WEF Index report is defined as the value of all financial assets plus real assets (principally housing) owned by households, minus their liabilities. The Wealth Gini Index therefore measures the distribution of multiple assets and it measures distribution at the household, not individual, level.
When making comparisons of such metrics to crypto or other asset classes, it is therefore important that we compare apples to apples.
Measuring Wealth Distribution in Crypto Assets: The Trouble With Addresses
Because crypto assets are not state economies, and because we cannot get exact numbers on individuals or households participating in crypto networks, we i) cannot measure income distribution and ii) can only measure wealth distribution using proxies for individuals such as addresses (an address is the alphanumeric identifier of an account of the ledger of a crypto asset). This creates two problems:
Addresses can be owned by individuals and businesses (or other groups of individuals)
One entity can own multiple addresses
Addresses not only pertain to individuals but also to businesses and other groups. Complicating things further, because any one individual or group can own many addresses, determining the number of individuals represented across all addresses holding a crypto asset is impossible. On one hand, a single exchange address could represent millions of individual owners. On the other hand, one individual could own millions of addresses.
Ultimately, this means that measuring the wealth distribution of a crypto asset via addresses is a unique exercise, one that should not be used to compare to traditional methods used for other asset classes.
With that said, let’s look at some useful metrics for measuring wealth distribution in crypto.
Wealth Gini Coefficient
The Wealth Gini Coefficient of crypto assets is often used as a means of highlighting the supposed inequality in crypto with many citing previous attempts such as this piece by Balaji S. Srinivasan. For a description of how Gini is calculated, please see Balaji’s piece.
Calculating Wealth Gini across various crypto assets takes considerable effort. It is a metric that Coin Metrics is working to add to its arsenal. In the interim, it’s useful to reiterate a couple challenges with i) calculating this metric and ii) in using it to compare crypto to external networks such as state economies.
First, is the choice of sampling unit. As described above, for state economies, the sampling unit of choice is often a household. For crypto assets, there is no way to measure individuals or households so we must work with addresses (and choosing which subset of addresses to sample is tricky).
Not only does the sampling unit differ in crypto but here we are also measuring the distribution of a single asset, the crypto asset itself, and not of all of a household’s assets minus liabilities as we do when calculating Wealth Gini in state economies. It’s very likely that the distribution of a single asset in a state economy, such as real estate, is far less equally distributed than all assets combined, particularly when subtracting liabilities.
Other Wealth Distribution Metrics
Beyond Wealth Gini, there are several other metrics that we can look at to give us insight into the distribution of crypto assets. Below is a snapshot from August 17, 2019 for the top 5 crypto assets.
Table 2: Wealth Distribution of the Top 5 Crypto Assets by Market Capitalization

BTC, the oldest asset, is by far the most distributed by metrics such as the number of addresses with meaningful balance (defined as owning one in one-billionth of supply). However, Bitcoin addresses also have the highest mean/median address balance and Bitcoin boasts the most address USD millionaires.
Aside from BCH (a recent but prominent BTC fork), ETH appears the next most distributed by these data despite being the youngest. Not only does it have a large number of addresses with meaningful balance but it has a low mean address balance. Comparing between different networks however isn’t straightforward. Ethereum’s gas fee mechanics tends to leave more dust behind (dust refers to balances smaller than the fee necessary to move them). This could make ETH appear more equally distributed by lowering mean account balances. On the other hand, Ethereum is also an account-based protocol. Compared with UTXO-based protocols, users of account-based protocols often re-use addresses which can make account-based protocols appear less equally distributed when using address-based metrics.
Of this sample of assets, XRP appears the least equally distributed.
Keep in mind that many of the above metrics are influenced by the market capitalization of the asset. Since BTC has the highest market capitalization, it might appear to have higher wealth centralization. If we scale the non-BTC assets to the same market capitalization and multiply all metrics by this multiplier, an interesting picture emerges. We would however caution placing too much emphasis on this data since scaling in this way makes a number of assumptions that are unlikely to hold true (particularly for direct forks such as BCH).
Table 3: Wealth Distribution of the Top 5 Crypto Assets by Market Capitalization Scaled to BTC’s Market Capitalization

Finally, an important consideration in the wealth distribution of an asset is time. This is clearly evidenced with BTC, the oldest asset, in the chart below. Taking the slopes of the trendline of these curves tell us the current rate of distribution. For example, using the slope of the trendline from chain launch, every new day we would expect 218 new addresses to hold at least 1 BTC. However, since the early days of distribution on the Bitcoin network are unlikely to represent distribution patterns today, taking a more recent slope might make more sense.
Chart 1. The Number of Addresses With At Least X Native Units of BTC

Table 4: Slope of the Curve of BTC Distribution Bands

Below are distribution charts for the other five assets.
Chart 2. The Number of Addresses With At Least X Native Units of XRP

Chart 3. The Number of Addresses With At Least X Native Units of ETH

Chart 4. The Number of Addresses With At Least X Native Units of BCH (From Fork Date)

Chart 5. The Number of Addresses With At Least X Native Units of LTC

To summarize, measuring the wealth distribution in crypto requires novel approaches. It requires using addresses which do not map perfectly to individuals or households and it measures wealth in only a single asset (not all household assets minus liabilities) so it is not directly comparable to traditional measures of wealth distribution of state economies. Coin Metrics will continue to publish more research on this topic in the months to come.
Network Data Insights
Summary Metrics

It was another rocky week for the major crypto assets. After a brief surge, metrics dipped during the middle of the past week as Bitcoin fell back under $10,000. On average, BTC’s Market Cap fell by over 10% over the last week. ETH, XRP, and LTC market cap also all fell by at least 10% as well. Realized cap, however, remained relatively stable for all five metrics.
Transfer count, adjusted transfer value, and daily fees were also down across the board. LTX and XRP were both hit particularly hard; XRP’s adjusted transfer value fell by 31.5%, and LTC’s daily fees fell by 39.6%.
LTC’s hash rate also dropped significantly, down 11.3% from the previous week. BTC’s hash rate also fell (4.6%) while ETH’s stayed relatively stable. BCH’s hash rate, however, increased over the past week, rising by 5.7%.
Network Highlights
LTC’s hash rate has continued to fall after its recent block reward halving. Hash rate has dropped from 426 TH/s on August 5th (which was the day of the halving) to 317 TH/s as of August 17th.

BTC’s all-time aggregate mining revenue is on pace to reach $14 billion by the end of the week. As of August 17th, BTC has generated over $13,918,000,000 of total mining revenue.

The number of addresses that hold any balance of USDT (Omni) fell precipitously over the past week, as USDT users continue to shift over to the Ethereum version of the protocol.

Market Data Insights
Short-term Correlation Remains High
Prices of major crypto assets declined modestly over the past week. Correlation over short-time periods remains high with almost all crypto assets moving in lockstep when examined intraday or over a period of a few days.

An examination of the three largest crypto assets more clearly illustrates the high intraday correlation. When examined over this time period, crypto assets tend to trade as a single asset.

Despite High Correlation, Dispersion of Returns is Large
The high correlation among assets obscures large dispersion of returns when examined over moderate timescales. Despite all asset prices having near identical directional reactions in response to systematic events that affect the asset class as a whole, over moderate timescales asset-specific fundamentals do matter.
The high correlation with large dispersion of returns indicates that a long-short strategy can be effective expressing market views. For certain assets, it may be easier to determine which ones are becoming fundamentally stronger or weaker rather than attempt to anticipate the direction of the asset class as a whole which is vulnerable to external event-driven shocks that are unpredictable.
For example, a long Bitcoin, short ZCash position would have returned +31 percent over the past month and a long Bitcoin, short TRON position would have returned +38 percent. Even adjusting for high cost of borrowing and trading costs, there long-short trades can be highly profitable.

Volatility Remains Elevated
Volatility for many assets remains elevated compared to recent lows made in early 2019. Despite the safe haven narrative for Bitcoin, it’s volatility is similar to other major crypto assets. The asset class as a whole has experienced realized volatility of almost a magnitude higher than traditional asset classes. The high volatility combined with large dispersion of returns suggests that opportunities for actively-managed long-short strategies remain high.

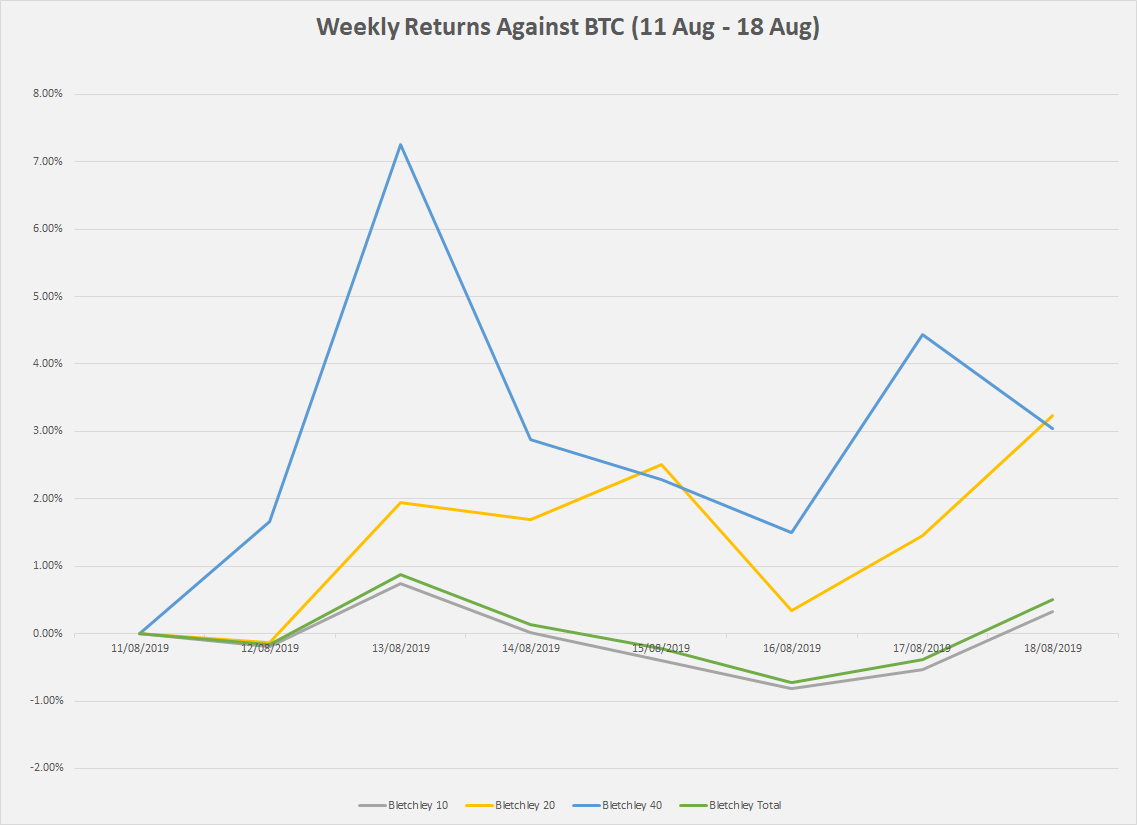
CM Bletchley Indexes (CMBI) Insights
All CMBI indexes fell sharply this week after a crypto asset market wide correction. As is evident through the returns of the Bletchley Indexes, this week’s correction was uniform across the large cap (Bletchley 10), mid cap (Bletchley 20) and small cap (Bletchley 40) crypto assets.

This is a very interesting result given the recent trend over the last three months. Over that period, in a positive week, Bitcoin (and as a result the Bletchley 10) has increased more than the rest of the Indexes. In a negative week, Bitcoin (and as a result the Bletchley 10) has either slightly increased or fallen less than the rest of the Indexes. This week that trend broke with mid cap and small cap assets performing better than large cap assets.
Subscribe and Past Issues
If you'd like to get State of the Network in your inbox, please subscribe here. You can see previous issues of State of the Network here.
Check out the Coin Metrics Blog for more in depth research and analysis.