Coin Metrics' State of the Network: Issue 122
Tuesday, September 28th, 2021
Get the best data-driven crypto insights and analysis every week:
Digging into Uniswap DEX Data
By Kyle Waters and Nate Maddrey
Decentralized exchanges (DEXes) have quickly emerged as essential systems to trade crypto assets in the rapidly innovating sector of decentralized finance (DeFi). Powered by the proliferation of new tokens, composable DeFi protocols, and an ever-increasing user base, DEXes are gaining a formidable share of total crypto asset trading volume.
Over the last year, Ethereum has been the center of DeFi’s evolution and the largest DEX on Ethereum today is Uniswap. First launched in November 2018, Uniswap is now in its third iteration, with V3 of the protocol releasing this past May.
In contrast to its centralized counterparts, the Uniswap protocol uses an automated market maker (AMM) design to automatically determine prices. There are no intermediaries that match buyers and sellers with a central limit order book. Trading is completed entirely on-chain with the use of smart contracts, meaning each trade is simply an interaction between a user and code living on Ethereum.
Unlike the permissioned process of new token listings on centralized exchanges, users generate new markets on Uniswap. Any Ethereum user can start a new market for a pair of tokens if it does not yet exist, creating an organic network of tradable assets.
Uniswap as a Network of Tradable Asset Pairs
Uniswap can be thought of as a peer-to-peer network of tradable assets. While centralized crypto exchanges tend to support trading against just a few base fiat currencies and stablecoins, a token on Uniswap might trade against many assets.
The number of tradable assets on Uniswap is also growing every day and there are ~47K distinct assets that are tradable on Uniswap V2 alone (a large number but only a portion of the ~373K ERC-20 compliant contracts on Ethereum). This creates an intricate system of markets to analyze.
Network graphs are a helpful visual tool to synthesize these user-generated markets on Uniswap (and DEXes in general). The network graph below shows all 3,085 tradable tokens on Uniswap V3 and how they are traded against each other. Each dot in the graph represents a token and a line between two dots means a market (Uniswap V3 pool) exists between the two.
The majority of tokens on Uniswap V3 (2,198) trade only against (wrapped) ETH and no other asset (in pink). On the other hand, some tokens trade only against Tether (220, in teal) or USDC (131, in blue). In the center (in red) are larger market cap tokens like UNI, WBTC, COMP, and MKR which trade against each other and all of the major base assets. The network graph is a powerful way to view DEXes and might also be used to analyze volume between pairs (by weighting the edges/lines between tokens) or understand how new markets are being created (coloring by age).
Uniswap Growth & Adoption
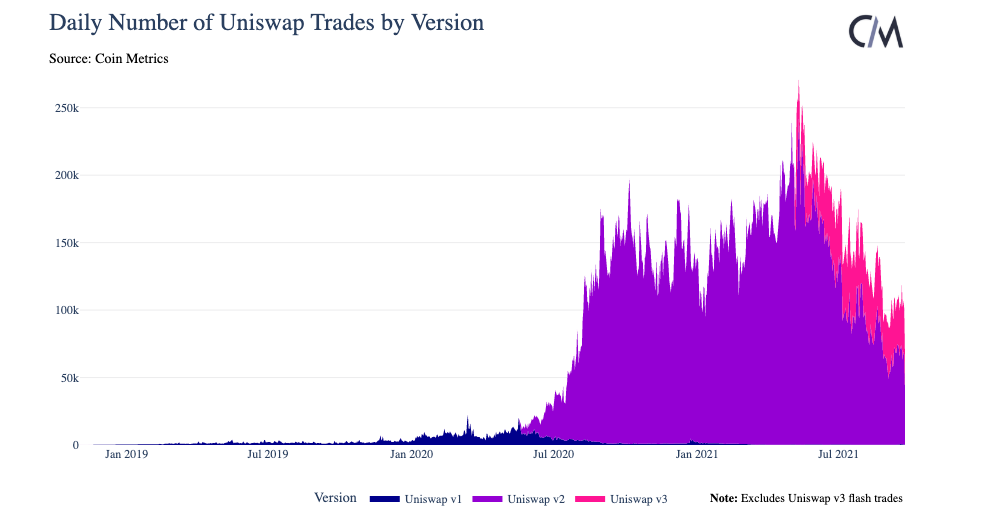
There have been a total of 67.5M swaps (trades) across all versions of Uniswap since V1 of the protocol released in 2018. Uniswap adoption ramped up during last year’s “DeFi Summer” with trades rising from ~10K per day in May 2020 to ~150K per day by September 2020, when Uniswap’s UNI governance token launched. Daily trades peaked during the crypto market volatility in May 2021 at 271K across all versions of the protocol. Daily trades have fallen since to around 100K trades per day, with V2’s share at ~65% and V3’s share at ~35% (V1 is largely unused now).
The daily number of unique addresses using Uniswap also peaked in May 2021 at just over 100K. Recently, there have been ~30K unique addresses transacting daily and to date Uniswap has been one of the most popular dapps on Ethereum.
The growth of Uniswap corresponds with growth in macro-level statistics across the entire Ethereum ecosystem. In summer 2020, daily ERC-20 transfers and wrapped ETH supply (the ERC-20 compliant version of ETH used to make ETH-based trades on Uniswap) both increased sharply.
Source: Coin Metrics Network Data Pro
Contextualizing Uniswap Volume
The Uniswap protocol handles significant trading volume each day. While there are thousands of tradable tokens as mentioned above, only a few asset pairs account for the majority of volume. To contextualize Uniswap volume and compare against centralized exchanges we looked at volume across Uniswap V2 & V3 for ETH-USD stablecoin pairs (USDC/Tether/DAI).
So far in 2021, daily ETH-USD volume on Uniswap peaked on May 19th at just over $3B. In recent months, ETH-USD daily volume has frequently been above $1B with Uniswap V3 handling the bulk of dollar volume traded, possibly due to the benefits of concentrated liquidity introduced in V3.
For context, we compared daily volume on Coinbase for ETH-USD spot markets (fiat markets + USD stablecoin markets) to ETH-USD volume on Uniswap V2/V3. The chart below shows that while daily ETH-USD volume on Coinbase was consistently higher for the first half of 2021, volume has been comparable in the second half of 2021 so far with multiple days where Uniswap volume has been higher.
This confirms that DEXes are becoming increasingly popular trading venues but there are other factors that should be considered when comparing CEXes to DEXes such as quality of trade execution (price impact, fees, etc.).
DEX Metrics Moving Forward
As DEXes continue to capture a larger share of economic activity across DeFi we will be exploring metrics that contextualize their growth. By living on-chain, DEXes naturally produce an unprecedented amount of data to examine. This is an exciting deviation from the data silos of traditional finance, but challenges remain in proposing and computing robust DeFi metrics such as total value locked (TVL).
Network Data Insights
Summary Metrics
Source: Coin Metrics Network Data Pro
BTC and ETH were down this week following yet another cryptocurrency ban from the Chinese government. BTC and ETH market cap dropped 9.8% and 13.7% week-over-week, respectively. Usage was also down following the latest ban, with BTC active addresses dropping by 7.7% and ETH active addresses dropping by 5.8%. Following suit, stablecoin usage was down on the week amidst renewed talk of stablecoin regulation from the SEC.
Network Highlights
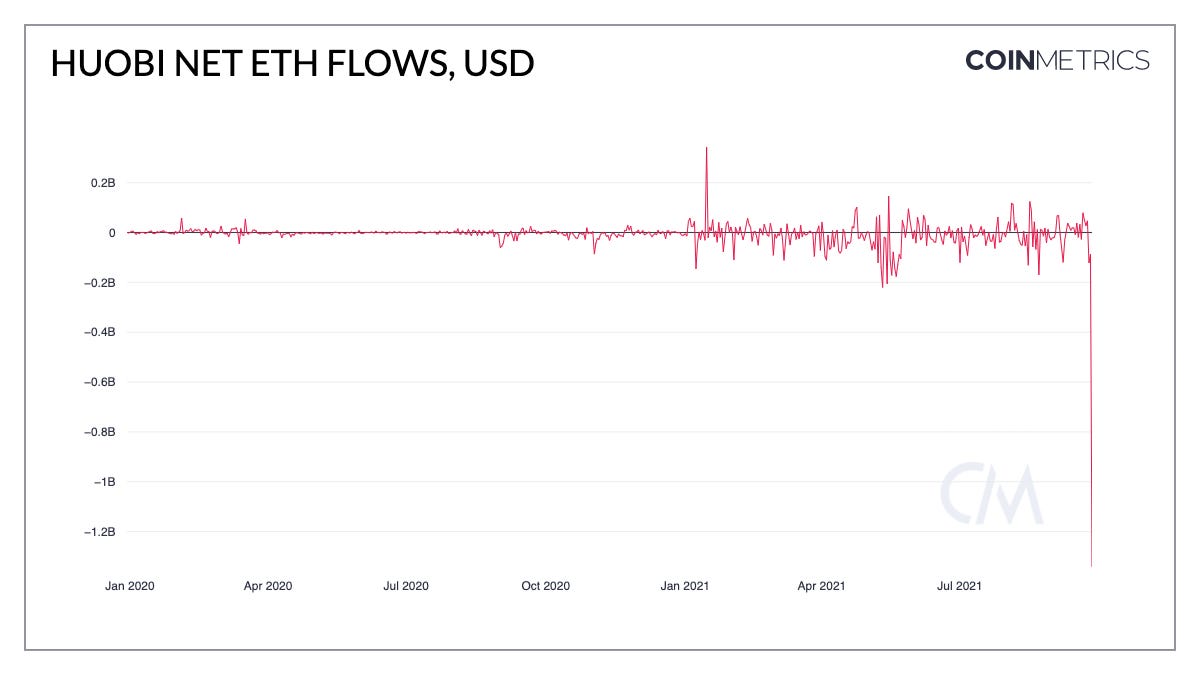
On Friday the 24th, China’s central bank declared all cryptocurrency activity illegal including offering trading, order matching, and token issuance services. China-based exchanges Huobi and OKEx were hit particularly hard as investors rushed to exit before the impending crackdown. On Sunday September 26th Huobi announced that it will cease all activity for users from mainland China by the end of the year. Huobi had a net outflow of $1.34B worth of ETH (440K ETH) on September 26th, by far its largest ETH outflow to date.
Source: Coin Metrics Network Data Charts
There is still 791K ETH ($2.4B) and 107K BTC ($4.6B) held on Huobi, although both have been declining since March 2020.
Source: Coin Metrics Network Data Charts
Following the news, Huobi Token (HT) free float market capitalization dropped by close to $1B. HT free float market cap is now about $1.2B, down from $6.8B on May 12th.
Source: Coin Metrics Network Data Charts
On Sunday, China-based mining pool Sparkpool also announced that it would be discontinuing its operations. Ethereum hash rate has climbed to new all-time highs this September, buoyed by high transaction fees from the NFT boom. Although Sparkpool’s closure may cause a short-term decrease in hash rate, there is currently more than enough hash power to keep the network secure.
Coin Metrics Updates
This week’s updates from the Coin Metrics team:
Last week we released a special research report exploring the data behind the rise of NFTs, access the full report here.
Check out our market-data focused newsletter State of the Market, featuring weekly updates on market conditions.
The Coin Metrics mobile app provides real-time crypto asset pricing and relevant on-chain data in a single app! Download for free here: https://coinmetrics.io/mobile-app/
As always, if you have any feedback or requests please let us know here.
Subscribe and Past Issues
Coin Metrics’ State of the Network, is an unbiased, weekly view of the crypto market informed by our own network (on-chain) and market data.
If you'd like to get State of the Network in your inbox, please subscribe here. You can see previous issues of State of the Network here.
Check out the Coin Metrics Blog for more in depth research and analysis.
© 2021 Coin Metrics Inc. All rights reserved. Redistribution is not permitted without consent. This newsletter does not constitute investment advice and is for informational purposes only and you should not make an investment decision on the basis of this information. The newsletter is provided “as is’ and Coin Metrics will not be liable for any loss or damage resulting from information obtained from the newsletter.


