Coin Metrics' State of the Network: Issue 64
Tuesday, August 18th, 2020
Get the best data-driven crypto insights and analysis every week:
Weekly Feature
The DeFi Fee Explosion: How YAM’s Collapse Drove Ethereum Fees to New Heights
By Nate Maddrey and the Coin Metrics Team
The following is an excerpt from the full piece, which has been truncated due to space limitations. Read the full report here.
On August 12th Ethereum’s total daily transactions fees topped $6.87M, shattering the previous all-time high of $4.55M set in January 2018. The following day, Ethereum had $8.61M worth of fees, once again breaking the daily record.
Blockchain transaction fees are a double-edged sword. High fees means there’s high demand for usage, but can also cause network congestion and price out certain users.
When Ethereum miners mine a block they need to select which transactions to include. Typically miners will sort by highest fee and add transactions until they run out of block space. This means that transactions with relatively low fees get deprioritized and included in later blocks once there’s space.
Ethereum fees are measured in units of “gas.” Each transaction costs a certain amount of gas depending on the amount of computation required (more complex transactions require more gas). Transaction senders specify the gas price they want to pay when initiating a transaction. If a transaction sender increases the gas price that they’re willing to pay, there’s a higher likelihood that their transaction gets prioritized.
Rising transaction fees therefore signals that there’s increasing demand for transactions to be quickly confirmed and included in blocks. High transaction fees also leads to higher revenue for miners, as miners receive the fees as part of their reward for securing the network.
But high transaction fees come at a cost. As average fees increase, certain types of users and applications get priced out. Use cases like games and digital collectibles that depend on large amounts of microtransactions can become prohibitively expensive. And it becomes harder for average, retail users to compete with large, whale investors who can afford to pay high transaction fees.
YAM Mania
This recent surge in fees was driven by one of the craziest decentralized finance (DeFi) events to date: the launch of the YAM token.
On August 11th at 17:00 UTC, the team behind DeFi project yam.finance announced that they would soon be launching the YAM token. Following the model used by DeFi token YFI, YAM was to be distributed through staking pools.
During the ICO boom of 2017 newly created tokens were sold through token sales, often driving prices up to crazy levels. Furthermore, tokens were often held and distributed by the ICO’s founding team or foundation, allowing many project founders to quickly profit. DeFi projects have pioneered a new model of token distributions: instead of a token sale, they distribute tokens as rewards for staking pools. DeFi projects will specify a list of staking pools and liquidity pools that are eligible to earn the token. The new token is then distributed proportionally to the amount of tokens staked, with higher stakes earning more tokens.
The yam.finance team outlined eight different staking pools, each with a different cryptoasset that could be staked (including WETH, COMP, MKR, YFI, and others) to earn YAM. Following in the footsteps of yearn.finance’s YFI token, the yam.finance team chose not to reserve any tokens for themselves, distributing them entirely to the community.
Once YAM launched there was a rush to start staking funds in one of the eight pools and start earning YAM as a reward. YAM staking pool smart contracts generated over $15K worth of transaction fees within hours of launch.
Signs of Trouble
But soon after YAM started to take off it began to unravel. The YAM token was designed to be “supply elastic,” meaning the token supply would automatically contract or expand in an attempt to keep price relatively stable. YAM’s supply elastic model was based on another DeFi token, Ampleforth (AMPL).
The supply adjustments were to occur as a nightly rebase using a complex mechanism that would adjust supply without diluting current holders. But despite the relatively complex architecture, the YAM team did not have their smart contracts audited, as they explicitly stated in their announcement post.
At 18:00 UTC on August 12th the yam.finance team announced that they found a bug in the rebasing contract which threatened the future of the project. To fix the issue they needed at least 35K YAM tokens delegated to a governance smart contract so they could pass a vote to temporarily pause the rebasing mechanism.
The rush to move YAM as a response to the bug was the first event that caused fees to skyrocket. This fee spike was also seen on Uniswap, the decentralized exchange that has become the center of DeFi trading. Further complicating things, a lot of YAM had been staked in Uniswap liquidity pools, which needed to be quickly unstaked and moved. This caused Uniswap fees to surge and peak at 20:00 on August 12th.
YAMpocalypse
But YAM’s problems did not stop there. At 07:27 UTC on August 13th the yam.finance team announce that they had submitted a governance proposal to fix the bug before the upcoming rebase at 08:00. Crucially, they strongly encouraged users to exit the Uniswap YAM/yCRV liquidity pool before the rebase. But soon after, with help from security experts, the team concluded that “the rebaser bug would interact with the governance module and prevent this proposal from succeeding.” The YAM protocol was effectively dead. Transaction fees peaked at 08:00 UTC, and then started to fall.
Continue reading “The DeFi Fee Explosion”...
Network Data Insights
Summary Metrics
Source: Coin Metrics Network Data Pro
Ethereum (ETH) remained hot this past week, with market capitalization growing by 5.9% week-over-week compared to a 1.5% growth for Bitcoin (BTC). ETH fees grew a shocking 174.3%, after already nearing all-time highs in previous weeks. On August 12th and 13th ETH fees shot to new all-time highs, as covered in this week’s Weekly Feature.
Network Highlights
BTC hash rate is reaching new all-time highs as price is starting to climb. After a rocky start to 2020 that saw large drops in hash rate following the March 12th price crash and May 11th halving, BTC’s hash rate has fully recovered and eclipsed previous levels. This is a great sign for network security and signals that fundamentals are strong.
Source: Coin Metrics Network Data Charts
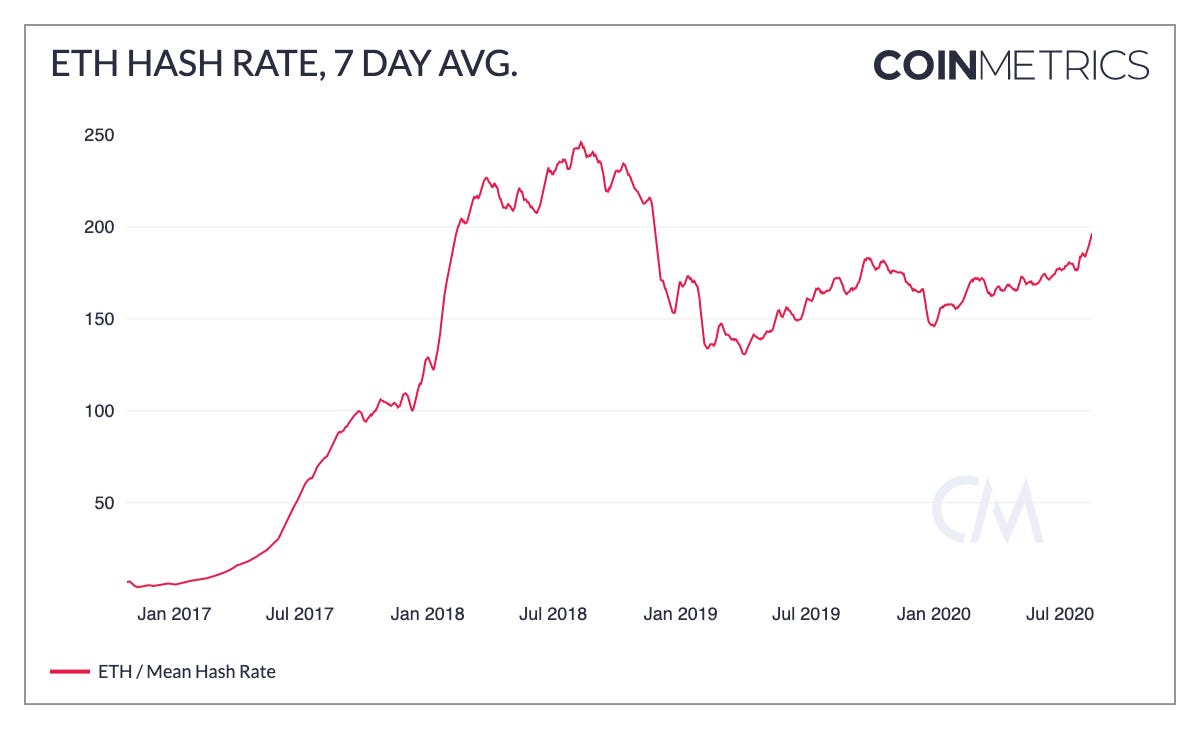
Although ETH’s hash rate has not yet surpassed 2018 highs, it has been surging as of late as well. Spurred by the increase is miner revenue from rising transaction fees, ETH’s 7 day average hash rate reached 196.52 TH/s on August 16th, its highest level since November 2018.
Source: Coin Metrics Network Data Charts
Market Data Insights
The market is looking frothy. 90.23% of the 248 assets that Coinmetrics provides reference rates on are up month over month with an average price increase of 53.71%. To highlight some of the exuberance we take a look at two assets in honor of the newest celebrity to embrace the cryptocurrency space, Dave “Davey Day Trader” Portnoy.
Orchid Protocol, OXT, made a 284% move over the weekend to a high of $1.00 from roughly $0.26 in less than 24 hours. It is not overtly clear what was the catalyst for this price movement with the most recent news from the project team being additional support for WireGuard on iOS, MacOS and Android, a VPN protocol supported by many major VPN providers. Many in the community remain skeptical about the move and the price has since come down to $0.57 as of the time this article was written.
Source: Coin Metrics Reference Rates
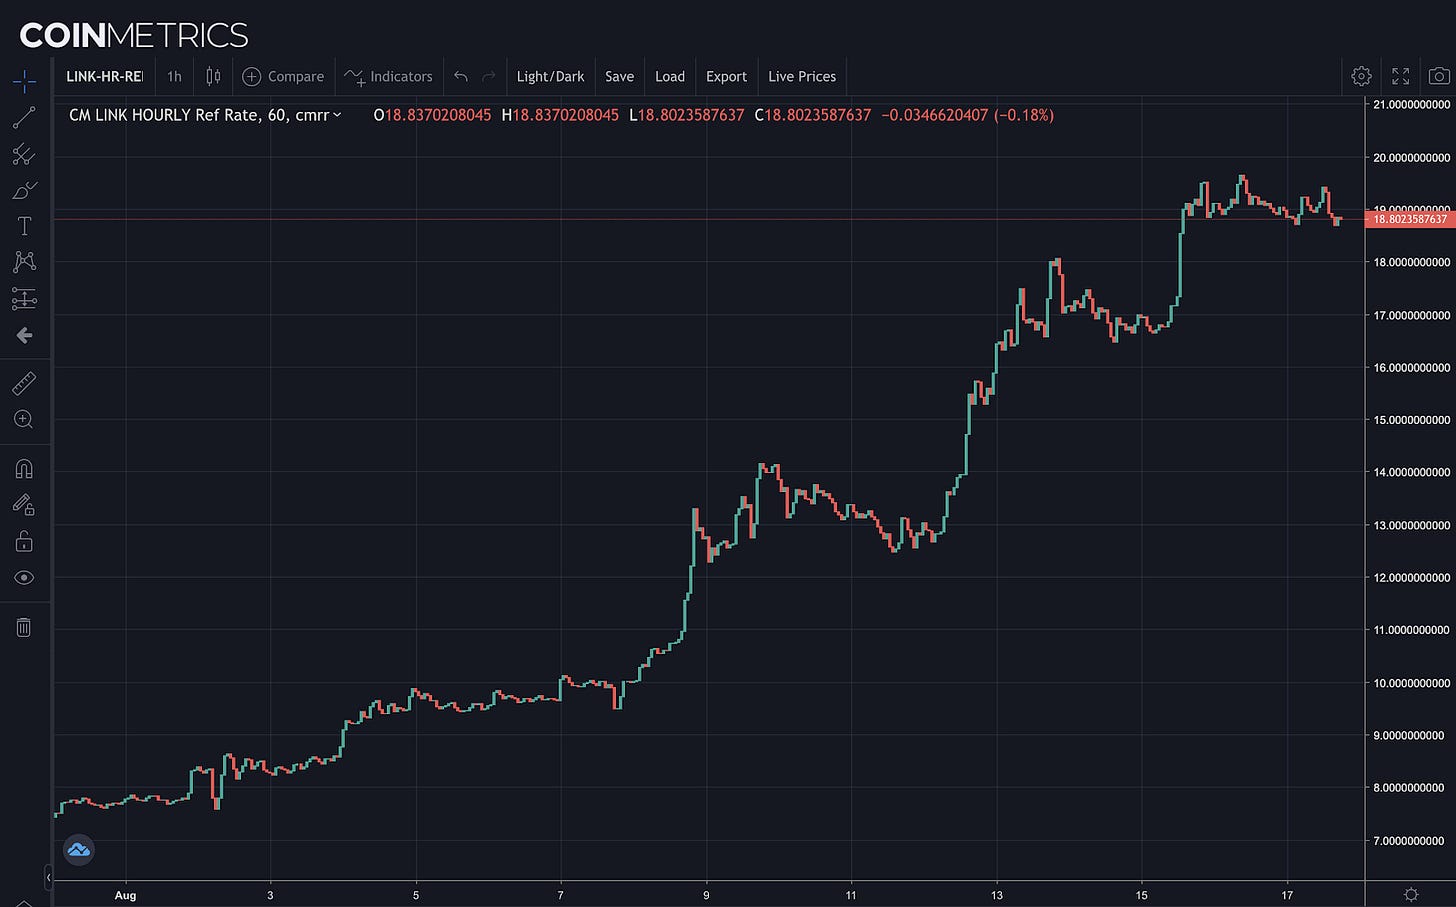
Chainlink (LINK) also continued to rage on, melting upward and reaching a price of over $20 on some exchanges.
Source: Coin Metrics Reference Rates
Over the past thirty days LINK has risen nearly 140% and is now third behind only Bitcoin and ETH in terms of average 7 day volume.
Source: Coin Metrics Market Data Feed
CM Bletchley Indexes (CMBI) Insights
All CMBI and Bletchley Indexes finished this last week with positive returns, with the Bletchley 40 (small caps) again performing best whilst the CMBI Bitcoin Index fluctuated between 11,000 and 12,000. The CMBI Ethereum Index had another strong week, closing up 10.2% at 429.76.
The Even Indexes also had a great week, all returning above 12%. The Even Indexes provide a different exposure to crypto markets, weighting each asset within an index evenly at the start of the month. During a week where Bitcoin underperformed the rest of the market, this is very visible in the returns of the B10 Even and the BTotal Even, which both significantly outperformed their market cap weighted counterpart.

The CMBI Bitcoin Hash Rate Index reached new highs this last week, showing no signs of slowing down despite the advent of the halving back in May. As a result of the sustained high levels of hash rate, the CMBI Bitcoin Observed Work Index has also reached new all time highs, indicating that miners in aggregate have been conducting over 11,250 Zeta Hashes per day.

More performance information on the:
CMBI Bitcoin Index and CMBI Ethereum Index can be found in the July CMBI Single Asset Index Factsheet.
CMBI Mining Indexes can be found in the July CMBI Mining Index Factsheet.
Coin Metrics Updates
This week’s updates from the Coin Metrics team:
We’re excited to announce the new Coin Metrics mobile app. View real-time cryptoasset pricing and relevant on-chain data in a single app! Download for free here: https://coinmetrics.io/mobile-app/
As always, if you have any feedback or requests, don’t hesitate to reach out at info@coinmetrics.io.
Subscribe and Past Issues
Coin Metrics’ State of the Network, is an unbiased, weekly view of the crypto market informed by our own network (on-chain) and market data.
If you'd like to get State of the Network in your inbox, please subscribe here. You can see previous issues of State of the Network here.
Check out the Coin Metrics Blog for more in depth research and analysis.


