Coin Metrics' State of the Network: Issue 118
Tuesday, August 31st, 2021
Get the best data-driven crypto insights and analysis every week:
Introducing New EIP-1559, Miner Flow, and Payment Metrics
By Nate Maddrey, Kyle Waters, and Lucas Nuzzi
Last week Coin Metrics released a major update to our metric coverage including new EIP-1559 metrics, Ethereum miner flows, valuation ratios, and payment metrics. In this week’s State of the Network we do a deep dive into some of these new metrics and explore how they can be used to help analyze BTC and ETH. You can find more about the rest of our Network Data Pro metrics here.
EIP-1559 Metrics
Launched on August 5th, EIP-1559 introduced a major redesign of Ethereum’s transaction fee mechanism.
While previously Ethereum used a first-price auction to determine gas prices, EIP-1559 introduces a base fee at each block. The base fee is a required payment to be included in a block and is programmatically determined based on the previous block. This in effect automates the gas price bidding system. Under the chosen parameters, the base fee cannot move up or down by more than 12.5% from one block to the next.
This provides something that is more akin to a predetermined list price (as opposed to a first-price auction) that a user can reject or accept. However, the user has the option to also add a tip.
While all transaction fees were previously paid to miners, the base fee is burned instead of being included in miner revenue. In other words, the ETH used to pay for base fees is permanently taken out of circulation. This effectively lowers net ETH issuance and decreases the annual inflation rate. Our new metrics include both total base fees burnt as well as mean base fees. So far over 130K ETH has been burnt, worth over $400M.
Source: Coin Metrics Network Data Pro
Paying a Base Fee is a prerequisite to having a transaction included in a block, but it does not guarantee that a transaction will in fact be picked by miners. Users may choose to pay for a miner tip (also known as a priority fee) in addition to the base fees. In essence, miner tips were designed to nudge miners to prioritize user transactions in times of network congestion. So far, priority fees have typically accounted for about 20-30% of total daily fees.
Source: Coin Metrics Network Data Pro
These metrics can be used to create ratios and empower macro analyses of Ethereum’s new monetary policy. For example, if the ratio of total ETH issued to total ETH burnt is lower than 1, this means that more ETH was Burnt than Issued, which signals monetary deflation, or a decrease in total ETH in circulation.
The burnt base fees have dropped ETH’s net annual inflation to an average of 1%-3%, depending on the amount of total daily transaction fees.
Source: Coin Metrics Network Data Pro
Not all wallets have natively implemented the EIP-1559 transaction format upon activation. Although EIP-1559 was introduced via a hard fork and, as such, is mandatory for all network participants, there still exists a mechanism within Ethereum nodes that converts legacy transactions into EIP-1559. This was put in place to minimize the impact that the new transaction type would have on Ethereum wallets.
In light of this, we have also devised a metric that can be used to track the native adoption of the EIP-1559 transaction format from industry wallets.
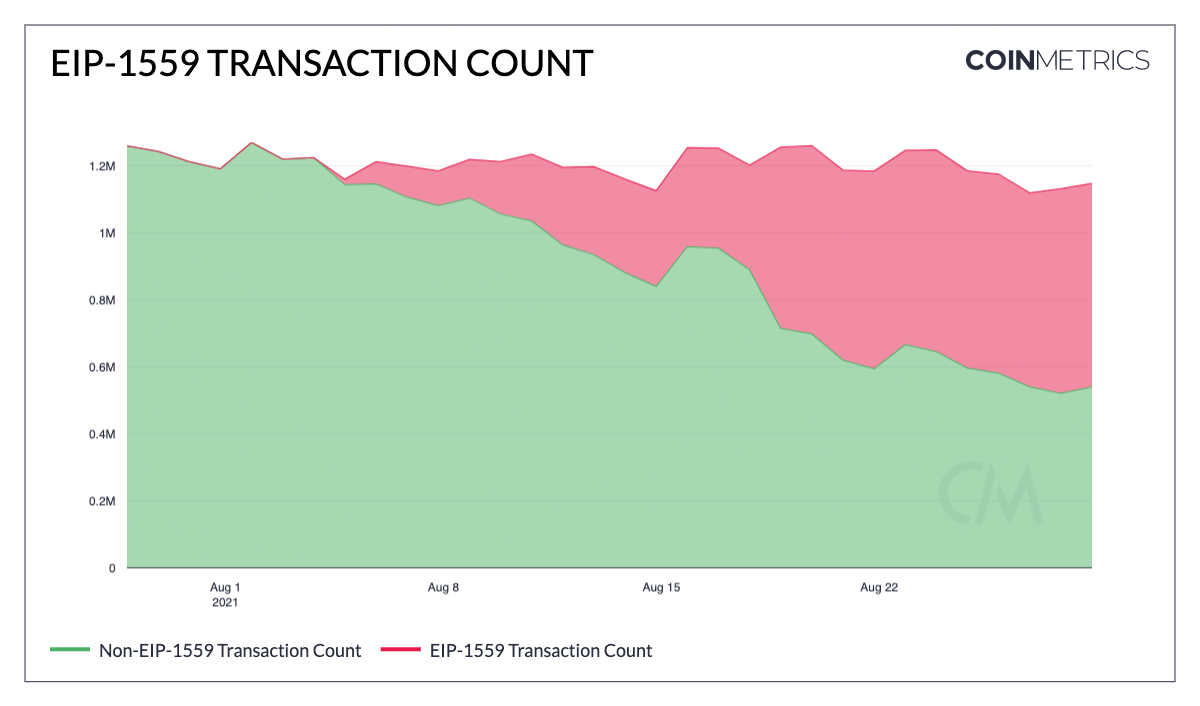
EIP-1559 Tx Cnt showcases the sum count of transactions taking place in the network with the native EIP-1559 format. This can be combined with the legacy transaction count to get a view on the adoption of EIP-1559.
Source: Coin Metrics Network Data Pro
The chart above shows the number of transactions that are natively EIP-1559-compliant (red), relative to non-EIP-1559 compliant transactions taking place in the network (green). The ratio of both metrics can be calculated using our Formula Builder to get a percentage of the adoption of EIP-1559.
Miner Flows Expansion
In order to track the health of Ethereum’s mining ecosystem post EIP-1559, we have also expanded our Miner Flows to support ETH. Clients now have access to the full set of Miner Flows metrics for Ethereum. We believe that flows will be an important data point to track as miner revenue is expected to continue to decrease (at the protocol layer, at least).
However, as showcased by the chart below, the adoption of EIP-1559 has not affected the ETH accumulation trend currently observed in addresses that belong to individual miners (addresses that are 1-hop away from the coinbase transaction, which is typically paid out to a mining pool). In fact, the amount of ETH held by individual miners is at its highest level ever.
Source: Coin Metrics Network Data Pro
Net flows to individual Ethereum miner addresses have mostly been positive following the crash in May, with a big spike in June.
Source: Coin Metrics Network Data Pro
New Payments Metrics
In order to better reason about the nature of the users interacting with a crypto network, it is important to understand the value of the payments that are being settled. In order to empower this type of analysis we have developed a new family of metrics that accounts for all transfers below a certain value threshold being settled in a network. This new family is called Payments Below $X, where $X represents the supported value thresholds. At this time, the following value USD thresholds are supported: $100, $500, $1,000 and $10,000. Through this framework, we calculate 2 metric types:
Sum of Payments Below $X USD, which represents the sum of all payments (transfers) that have occurred in the measuring interval below a specific USD amount, displayed in units of USD.
Count of Payments Below $X USD, which represents the count of all payments (transfers) that have occurred in the measuring interval below a specific USD amount, displayed in units of USD.
Source: Coin Metrics Network Data Pro
This also allows for analysis on how smaller transfers are affected by high transaction fees, and other ecosystem variables. As shown in the below chart, the number of ETH transfers below $100 has generally moved inverse to the average transaction fee, since high fees effectively price out some smaller transactors.
Source: Coin Metrics Network Data Pro
Asset Additions
NDP 5.0 brings 5 new assets to the Coin Metrics coverage universe:
Dfinity Internet Computer (ICP)
Polygon (MATIC_ETH)
Perpetual (PERP)
Revain (REV_ETH)
Livepeer (LPT)
ICP is being released under our CM Labs initiative, which enables us to add experimental assets to NDP with the caveat that service uptime might not be as optimal as more established assets. These tend to be relatively new assets with fragile nodes, which means their metric availability and service uptime might be impacted without prior notice.
To see our other available assets and explore our other on-chain metrics check out our free charting tool, formula builder, correlation tool, and mobile apps.
Network Data Insights
Summary Metrics
Source: Coin Metrics Network Data Pro
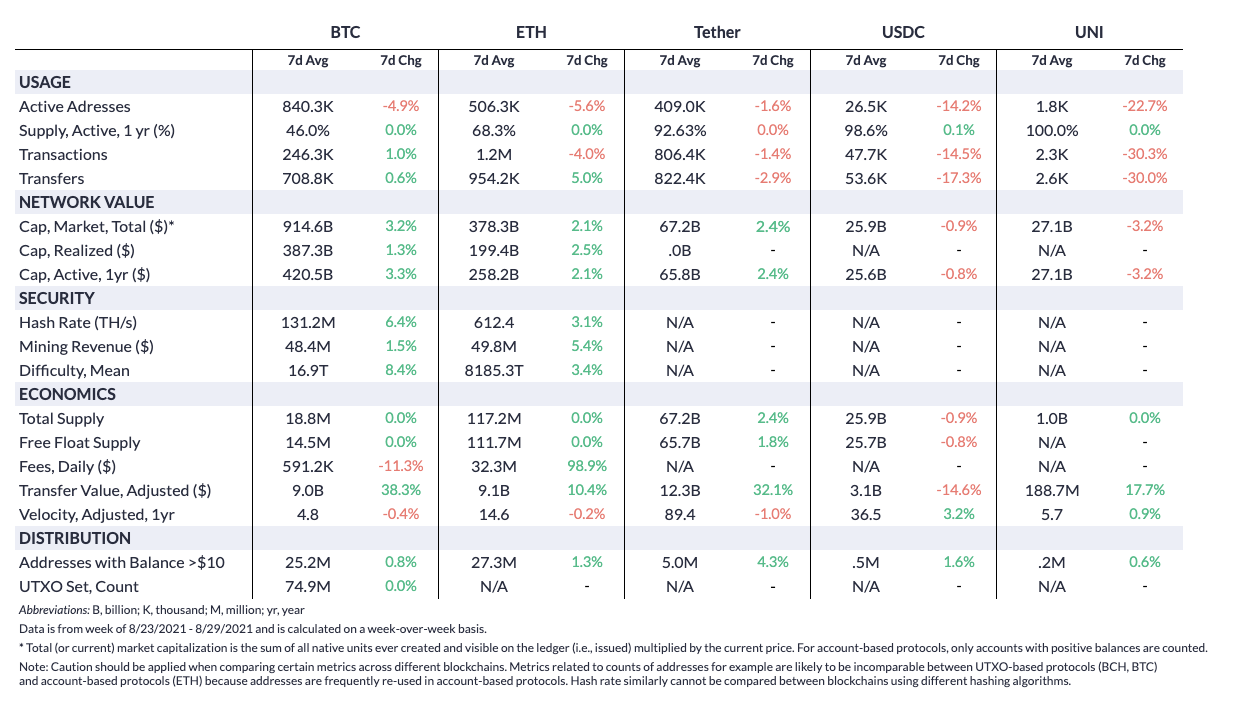
BTC and ETH mostly moved sideways over the past week after BTC surged back above $50K on August 22nd. Active addresses for both networks dropped week-over-week. BTC transaction count increased by 1% while ETH’s decreased by 4%.
ETH transaction fees, however, continued to rise thanks to an ever-increasing number of new NFT drops. Total ETH fees increased by almost 100% week-over-week for an average of over $32M a day. BTC transaction fees averaged about $600K per day on the week.
Network Highlights
The daily transfer value of bitcoin in USD terms seemingly hit an all-time high of ~$102B on August 26th. However, when looking on an adjusted basis transfer value was ~$13B.
This large difference shows why unadjusted transfer value can be misleading when taken at face value, especially for UTXO-based chains like Bitcoin.


Coin Metrics has long implemented a methodology to remove noise and isolate meaningful economic throughput on Bitcoin and other chains. In particular, change outputs muddy the picture for UTXO chains. For example, when a holder of a 100 bitcoin UTXO wants to send 1 bitcoin, the 100 bitcoin UTXO is spent in its entirety with 99 bitcoin received back in change.
An “obvious change” heuristic removes outputs cycled directly back into the originating address. Other non-economic transfers such as exchanges reshuffling cold wallets are excluded in the adjusted transfer figure. With heuristics like this, adjusted figures better represent meaningful on-chain economic traffic.
Coin Metrics Updates
This week’s updates from the Coin Metrics team:
State of the Network will be published on Wednesday, September 8th next week due to the Labor Day holiday schedule.
We’re excited to announce the new Coin Metrics mobile app. View real-time cryptoasset pricing and relevant on-chain data in a single app! Download for free here: https://coinmetrics.io/mobile-app/
As always, if you have any feedback or requests please let us know here.
Subscribe and Past Issues
Coin Metrics’ State of the Network, is an unbiased, weekly view of the crypto market informed by our own network (on-chain) and market data.
If you'd like to get State of the Network in your inbox, please subscribe here. You can see previous issues of State of the Network here.
Check out the Coin Metrics Blog for more in depth research and analysis.
© 2021 Coin Metrics Inc. All rights reserved. Redistribution is not permitted without consent. This newsletter does not constitute investment advice and is for informational purposes only and you should not make an investment decision on the basis of this information. The newsletter is provided “as is’ and Coin Metrics will not be liable for any loss or damage resulting from information obtained from the newsletter.


