Coin Metrics' State of the Network: Issue 27
Tuesday, November 26, 2019

Note: There is no Weekly Feature this week due to the Thanksgiving break. Regular weekly features will return in next week’s issue.
Network Data Insights
Summary Metrics

Crypto markets took a significant downturn towards the tail end of last week, with BTC price dropping to six-month lows. As a result, most major assets are down by over 10% week over week.
The crash came after the People’s Bank of China announced that they would begin cracking down on local crypto exchanges. This appears to have offset the gains experienced in October after Xi Jinping stated that China should increase blockchain research.
Despite the significant market cap drop, BTC realized cap only dropped by 0.3%. BTC’s market value to realized value (MVRV) ratio (calculated by dividing market cap by realized cap) dropped to 1.22 on November 24th, which is the lowest it has been since May. A low MVRV is a potential signal that market participants are minimally in profit or not in profit (if MVRV is negative), and thus the asset may be undervalued, while a high MVRV ratio may signal overvaluation (market participants are well in profit). Note that this is not investment advice.
Although ETH also experienced a large price drop, ETH fees rose by over 20%. We explore Ethereum’s fee rise in the “Network Highlights” section below.
Network Highlights
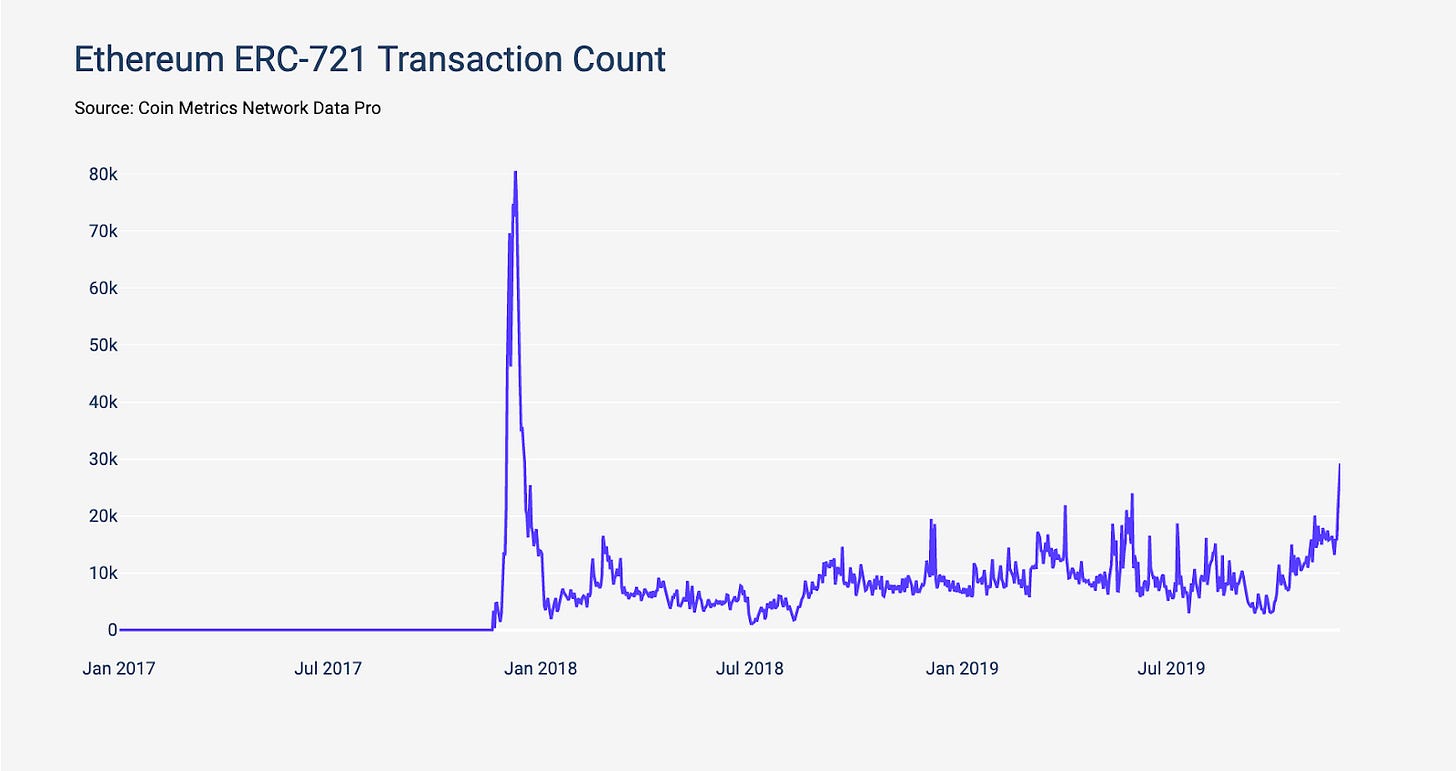
In late 2017, CryptoKitties burst onto the scene causing ERC-721 (non-fungible token) transactions to reach over 80,000 per day. But after a brief frenzy, CryptoKitty trading died off, and ERC-721 transactions have not topped over 25,000 per day since.
Now, another Ethereum game is starting to gain on CryptoKitties. On Friday, November 22nd, Ethereum ERC-721 transaction count shot up to over 20,000 per day. On the 24th, ERC-721 transaction count reached 29,222, which is the highest single day total since early 2018.

The spike is caused by Gods Unchained, an Ethereum based trading card game that is a competitor of the popular game Hearthstone. As we wrote in State of the Network Issue 25, Gods Unchained recently gained widespread social media attention after Hearthstone banned a popular pro player due to supporting the Hong Kong protests.
At around 4:30 AM UTC on November 22nd, Gods Unchained opened their trading card marketplace, which allowed users to begin buying, selling, and trading cards with each other. Since then there has been over 1,467 ETH (roughly $220K) worth of Gods Unchained trading volume on OpenSea.
Previously, users could only receive cards directly from Gods Unchained. These cards were usable in-game, but not tradable on the open market. Gods Unchained have been “activating” cards (i.e. turning them into tradable tokens) since early November, which led to over 3.7M ERC-721 transfers on November 17th (hundreds of transfers can be batched together in a single transaction).
CryptoKitties notoriously caused blockchain congestion, and caused ETH fees to spike. Gods Unchained appears to have caused temporary congestion on November 22nd. The blue points on the below chart each represent the gas used per individual block, for every block from November 21st through the 26th.
There is a relatively large amount of whitespace between roughly 5:00 and 17:00 UTC on November 22nd because most blocks were close to full and therefore clustered towards the top of the chart. However, by November 23rd, things look to have mostly cleared up.

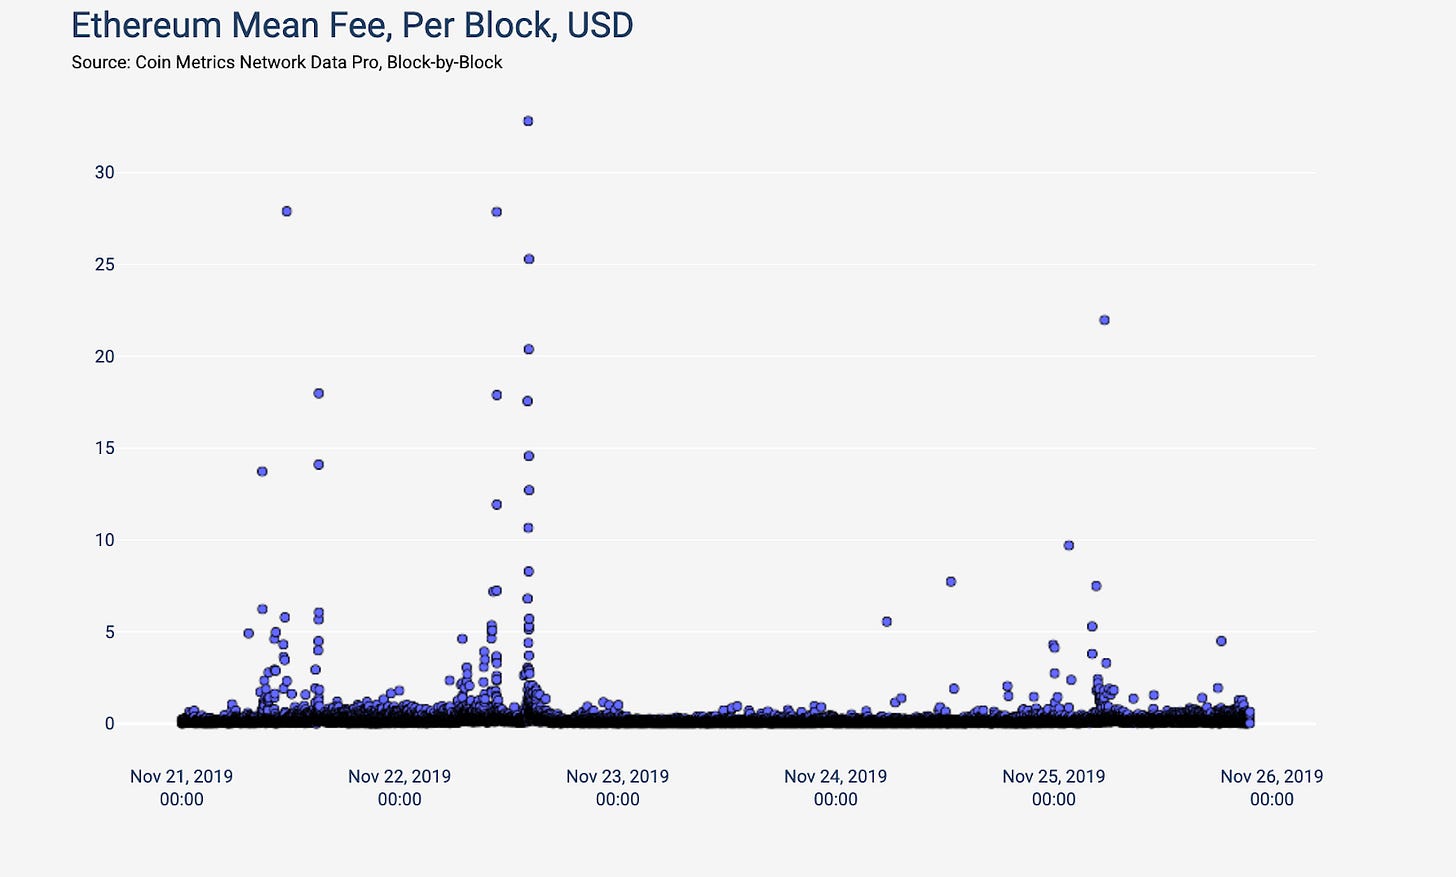
The congestion caused ETH fees to also temporarily spike on the 22nd. The following chart shows the mean fee per block over the same time period. The mean fee for some blocks reached over $30, but dropped back down to relatively normal levels by the 23rd.

Market Data Insights
Looking at the distribution of returns for Coin Metrics’ coverage universe (that consists of roughly the top 200 assets), most assets declined by between 20% and 30% over the past week.

Diversification usually benefits a passive-held, long-only portfolio. After the bursting of the bubble in December 2017, however, Bitcoin has outperformed most smaller assets, with a few significant exceptions.
Although nearly all crypto assets returns are normally directionally correlated with Bitcoin returns, we have previously seen high dispersion in returns, indicating that a portfolio of crypto assets still offers some limited diversification benefits. But dispersion of returns across assets has declined sharply over the past month, and each asset’s indexed price chart looks nearly identical.

Among this sample of major assets, only Tezos has managed to secure a positive weekly return of +14%. UNUS SED LEO has also remained unusually stable with a decline of only 5%.

Recent price action has raised concerns about the continuation of the positive returns that started earlier this year. Looking at price drawdown from peak for major assets indicates that for most assets other than Bitcoin, drawdowns have returned to near all-time lows. Bitcoin’s drawdown from it’s all-time high sits at 63% and it’s drawdown from the highs we experienced during summer when Bitcoin briefly reached $13,000 s approaching 50%.

Given the significant declines in prices, we examine current price performance in comparison to price performance coming out of other cycle bottoms. Below we annotate three cycle bottoms and tops, where each cycle bottom is a local minimum and each cycle top is a local maximum. A fourth cycle bottom is annotated and occurred on December 15, 2018 where Bitcoin prices briefly reached $3,200.

Cycle bottoms and cycle tops were determined using subjective visual examination. This combined with the few historical instances of complete cycles suggests caution in drawing conclusions upon this data. With these caveats in mind, under the assumption that December 15, 2018 was the bottom of this cycle and that we will see a repeat of the bubble-and-crash cycles experienced before, current price performance does not seem abnormal.
The three cycles previously identified show a pattern of lengthening where each cycle takes longer than the previous one to complete. This outcome is expected if cycles are driven by a new wave of adoption and awareness from a certain group of users, each bigger than the last.
It also shows a pattern of less trough-to-peak price appreciation in each subsequent cycle. The total price appreciation in the first cycle is understated due to incomplete price history during the first year of Bitcoin’s existence.
Under this lens, the local peak we experienced in the summer of this year (roughly 200 days since the cycle bottom) was abnormal as indexed prices exceeded where prices were in both the second and third cycle at similar stage during their recovery. Now, prices in this cycle have declined to a point where it is below the third cycle -- consistent with historical patterns.

CM Bletchley Indexes (CMBI) Insights
As evidenced in the market data highlights above, crypto assets had an abysmal week. The uniformity of poor performance across large-cap, mid-cap and small-cap assets is reflected in the Bletchley Indexes below, which experienced falls between 19% and 24%.
There was a small discrepancy in small-cap assets which performed the worst against their Bitcoin pairing, evidenced by the Bletchley 40 falling 6% compared to ~1% falls for the Bletchley 10 and Bletchley 20.

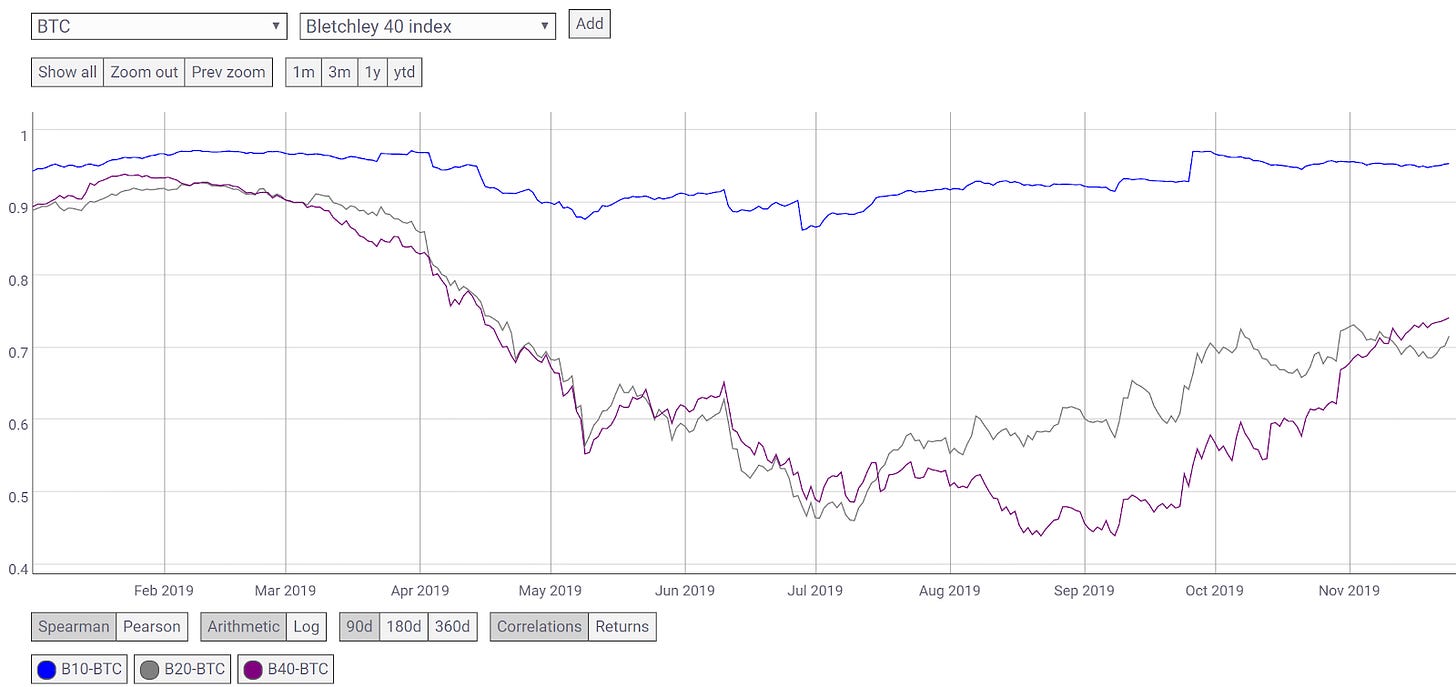
In previous issues we have discussed the improving performance of mid-cap and small-cap assets against Bitcoin and the large-cap assets. Another interesting trend is the increasing correlation of mid-cap and small-cap assets with Bitcoin.
While the Bletchley 10 is predominantly highly correlated with Bitcoin (as Bitcoin is the major constituent), earlier in the year we witnessed Bitcoin’s correlation with mid and small-cap assets reduce significantly. However, since Bitcoin has started to stagnate and even fall in price, its correlation with mid and small-cap assets has started to increase again.
Historically, long and sustained high levels of correlation have not been prevalent in the market, but rather a phenomenon that has continued since the start of the bear market in 2018.

Coin Metrics Updates
This week’s updates from the Coin Metrics team:
Coin Metrics and BitMEX Research are happy to announce the release of txstats.com, the successor to P2SH.info, an independent project created by Coin Metrics’ Lead Data Engineer Antoine Le Calvez. Read more info here: https://coinmetrics.io/announcing-txstats-com/.
Coin Metrics’ own Crypto Indiana Jones, Antoine Le Calvez, giving an interview with BlockTV about last week’s State of the Network:


Coin Metrics is hiring! We recently opened up 6 new roles, including Blockchain Data Engineer and Data Quality and Operations Lead. Please check out our Careers page to view the openings.
As always, if you have any feedback or requests, don’t hesitate to reach out at info@coinmetrics.io.
Subscribe and Past Issues
Coin Metrics’ State of the Network, is an unbiased, weekly view of the crypto market informed by our own network (on-chain) and market data.
If you'd like to get State of the Network in your inbox, please subscribe here. You can see previous issues of State of the Network here.
Check out the Coin Metrics Blog for more in depth research and analysis.
