Weekly Feature
Fundamentals Show Bitcoin Is Poised for Takeoff
By Nate Maddrey and the Coin Metrics Team
The following is an excerpt from a full-length report which has been truncated due to space limitations. Read the full report here.
On October 21st Bitcoin (BTC) broke out, rising by about $1,000 on the day. Since then it has topped $13,000 and set new 2020 highs.
For crypto veterans this is a somewhat familiar story. BTC is notoriously volatile and has had many crazy price swings throughout its history.
But something is different this time around. Ever since the March crypto crash, BTC has been growing in ways that we have not seen in previous bull runs. On-chain fundamentals hint that it could be poised for its biggest breakout yet.

Source: Coin Metrics Network Data Charts
Digital Gold
BTC has had a low correlation with both gold and the U.S. dollar throughout most of its history. But things changed on March 12th. As panic over COVID-19 rapidly set in, equities around the world crashed. Crypto went down with the rest of the markets, with BTC and ETH price both dropping about 50%. Since then, BTC’s correlation with gold has been near all-time highs while it’s correlation with the dollar has been at all-time lows.

Source: Coin Metrics Correlation Charts
BTC has often been referred to as digital gold, and evidence is increasingly supporting that claim. In the past few months public companies such as MicroStrategy and Square have announced that they are buying and holding BTC as a treasury reserve asset. Additionally, on-chain data shows that since March 12th BTC holding (aka HODLing) has increased while price has risen, signaling that BTC is increasingly being used as a store of value, similar to gold.
One signal of on-chain holding is the percent of supply held for at least one year (or in other words, the percent of supply that has not been moved on-chain as part of a transaction). As of October 25th about 62.5% of the total BTC supply had been held for at least 1 year, which is close to all-time highs. Historically, the percent of supply unmoved for at least 1 year has peaked during periods where price has been at local lows, as seen in the below chart.

Source: Coin Metrics Network Data Charts
BTC’s velocity is also at its lowest levels since 2011. Velocity measures the amount of times an average unit of supply has been transferred in the last year. High velocity means relatively high turnover. A decreasing velocity suggests BTC is trending towards being used as a store of value as opposed to a medium of exchange.

Source: Coin Metrics Network Data Charts
Increasing Holders
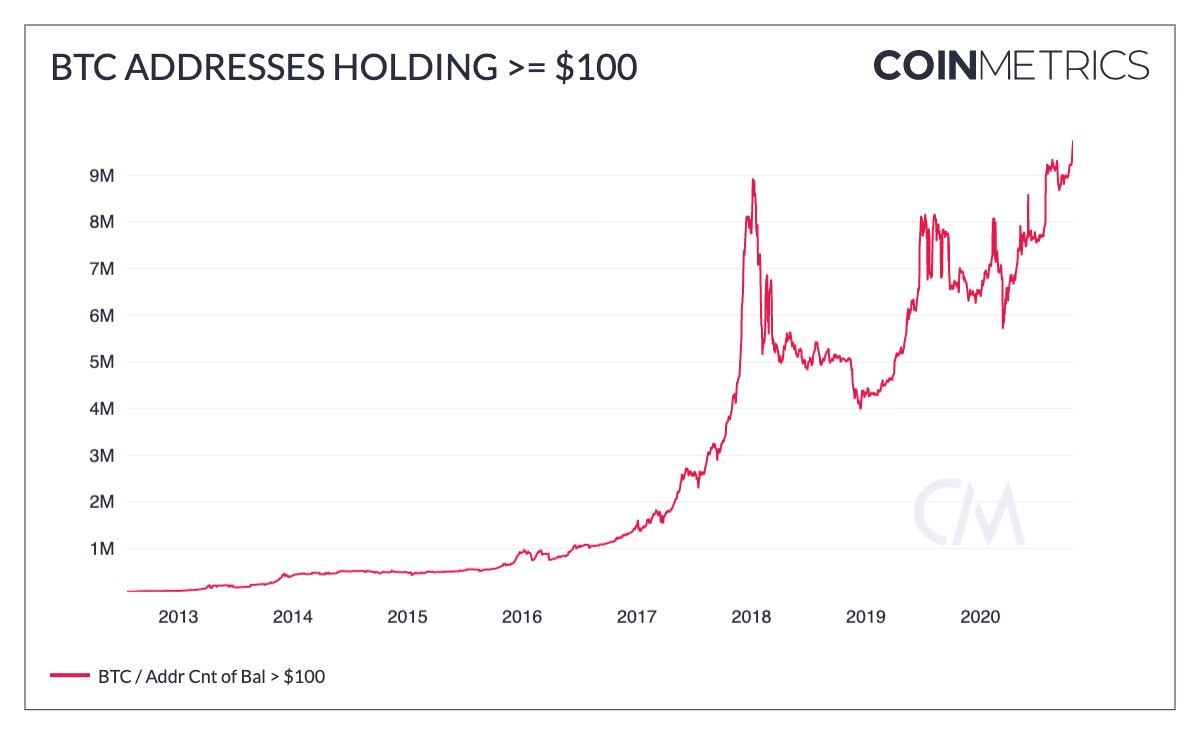
There also appear to be more holders than ever. The number of addresses holding at least $100 worth of BTC hit a new all-time high of 9.74M on October 22nd. A single person or entity can control multiple addresses, so this only shows an approximation of usage. But the trend suggests that the amount of BTC holders is increasing, which is a positive signal for BTC’s long-term adoption.

Source: Coin Metrics Network Data Charts
BTC supply is increasingly being moved off of centralized exchanges, and presumably held by individuals. While there are many factors involved in exchange supply, this could signal that more and more BTC investors want to hold and custody their own BTC. As the old saying goes: not your keys, not your Bitcoin.
Continue reading “Fundamentals Show Bitcoin Is Poised for Takeoff” here…
Network Data Insights
Summary Metrics

Source: Coin Metrics Network Data Pro
Bitcoin (BTC) on-chain metrics were overwhelmingly in the green this past week, driven by price reaching 2020 highs. BTC active addresses increased by 5.8% week-over-week and transaction fees exploded, increasing by 82.5%. Additionally, transfer sizes are growing. Adjusted transfer value grew by 46.7% while transfer count only grew by 0.7%.
Hash rate was the one outlier. After recently hitting new all-time highs, BTC hash rate dropped by 7.9% on the week. However the recent price and translation fees surge should incentivize more miners to join the network, driving hash rate back up in the near future.
Network Highlights
On October 22nd BTC’s average transaction fee shot up to $6.35, eclipsing ETH’s average fee of $1.69. ETH average transaction fee was higher than BTC’s for most of September, after ETH transaction fees exploded over the summer due to the rapid rise of DeFi. But the momentum has shifted back towards BTC.

Source: Coin Metrics Network Data Charts
Although DeFi mania has subsided, Ethereum ERC-20 tokens are still on a hot streak. ERC-20 token transactions have continued to surge in October after a strong September. The following chart shows ERC-20 token transaction count smoothed using a 7-day rolling average.

Source: Coin Metrics Network Data Charts
Market Data Insights
There have been some shifts in market structure since OKEx suspended digital currency withdrawals 11 days ago. Traders who have funds locked in the exchange have been continuing to trade. However, there are some signs of stress that can be seen in a number of key markets.

The distribution above is truncated to +/- 0.02% to highlight the slight shift.
Source: Coin Metrics Market Data Feed
One sign that traders are looking to reduce risk in their OKEx accounts is the recent premium given to USDT in the BTC market relative to its peers. This can be observed in the BTC-USDT market when comparing the volume weighted average of BTC’s Price in the 10 days before and after the suspension of withdrawals. The median discount given to BTC increased from -0.00089% to -0.00187%, an increase of ~110%.

Source: Coin Metrics Market Data Feed
The quarterly futures contract for BTC expiring in December also showed some temporary stress. Following the announcement, open interest declined by roughly 20%. However, when BTC saw positive price action later in the week, the spread between the futures contract and spot increased causing additional interest to be opened by traders looking to take advantage of the difference.

Data above as of UTC close on 2020-10-25
This is notable as even though spot BTC is trading at a discount, it appears that the quarterly contract is trading at a premium to other exchanges. This is likely due to reluctance traders may have about bringing additional capital on the exchange to sell the futures contracts down. However, to traders confident in the ability to withdraw funds in the future, this may appear as a great opportunity.
CM Bletchley Indexes (CMBI) Insights
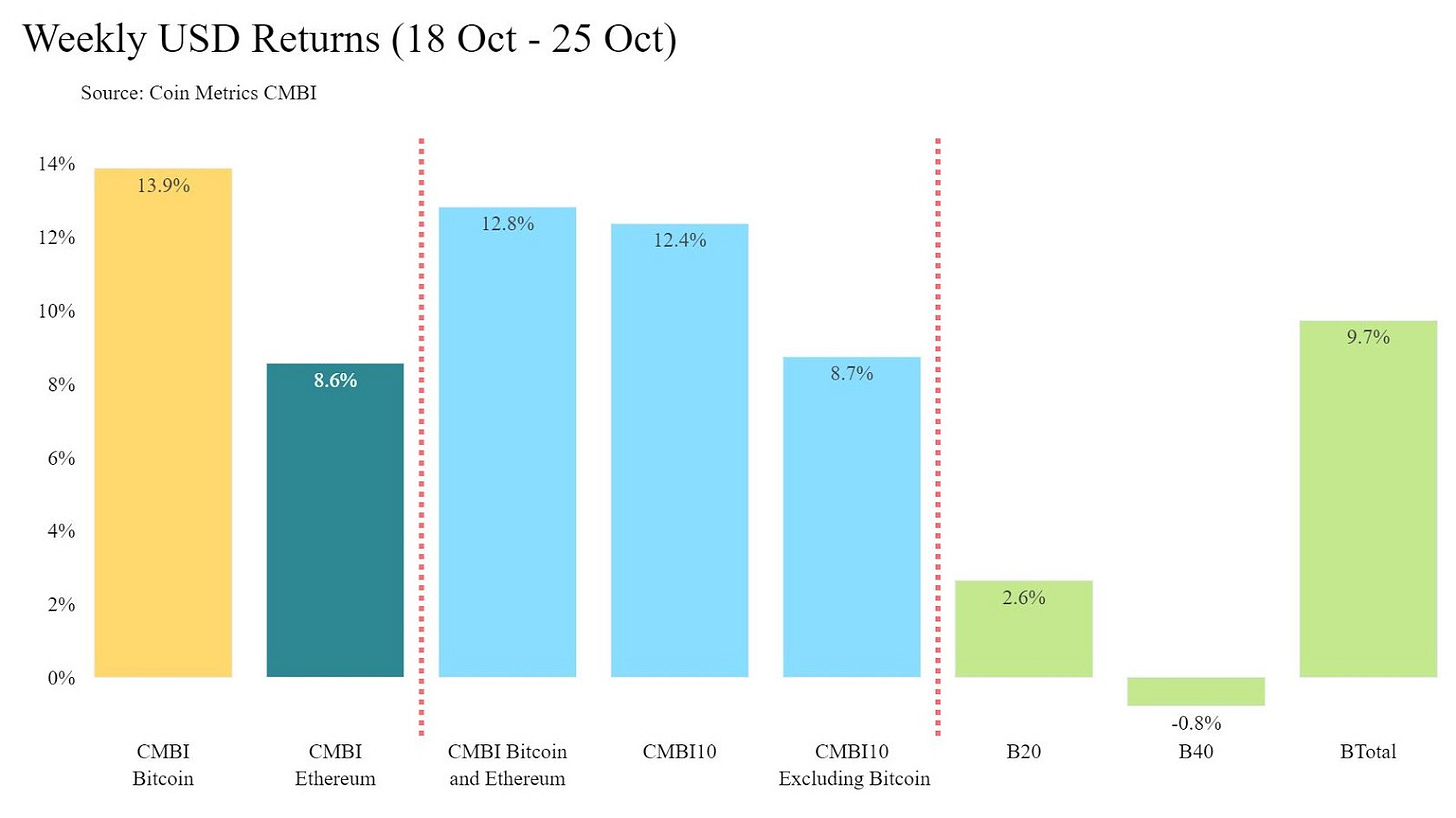
The market was once again led by the large cap assets this week, in particular Bitcoin which continued to capture headlines as more institutional investors and public companies build direct or indirect exposure to the asset. The CMBI Bitcoin Index was the best performer of the week, closing up 13.9% at $13,039.03, its best week since May. The CMBI Ethereum performed strongly as well, closing at $408.00, up 8.56% for the week. The small cap assets again performed the weakest during the week with the B40 being the only index that finished the week down.

The CMBI Bitcoin Hash Rate spent most of the week up, before falling over the past 24 hours to finish the week down under 120 exahashes per second. Despite the increased difficulty last weekend which may have indicated a slowdown in hash rate throughout the week, marginal miners seemed to have found some renewed profitability with the increase in Bitcoin’s price.

Coin Metrics Updates
This week’s updates from the Coin Metrics team:
We’re excited to announce the new Coin Metrics mobile app. View real-time cryptoasset pricing and relevant on-chain data in a single app! Download for free here: https://coinmetrics.io/mobile-app/
As always, if you have any feedback or requests, don’t hesitate to reach out at info@coinmetrics.io.
Subscribe and Past Issues
Coin Metrics’ State of the Network, is an unbiased, weekly view of the crypto market informed by our own network (on-chain) and market data.
If you'd like to get State of the Network in your inbox, please subscribe here. You can see previous issues of State of the Network here.
Check out the Coin Metrics Blog for more in depth research and analysis.
