Coin Metrics' State of the Network: Issue 9
Tuesday, July 23, 2019

Intro and Updates
Dear crypto data enthusiasts,
Welcome back to this week’s edition of Coin Metrics’ State of the Network, an unbiased, focused view of the crypto market informed by our own network (on-chain) and market data.
This week’s housekeeping items:
Coin Metrics’ legacy Community API was deprecated on July 15th and replaced with our new Community API. If you are an existing legacy Community API user, you must switch to the new API. You can find more info here.
Coin Metrics is hiring! Please check out our Careers page to view the openings.
We have been working on an in-depth research report on the major Bitcoin forks (BCH and BSV). Keep an eye out for it next week!
As always, if you have any feedback or requests, don’t hesitate to reach out at info@coinmetrics.io.
Weekly Feature
The Amount of Bitcoin Untouched for At Least 5 Years is at an All-Time High
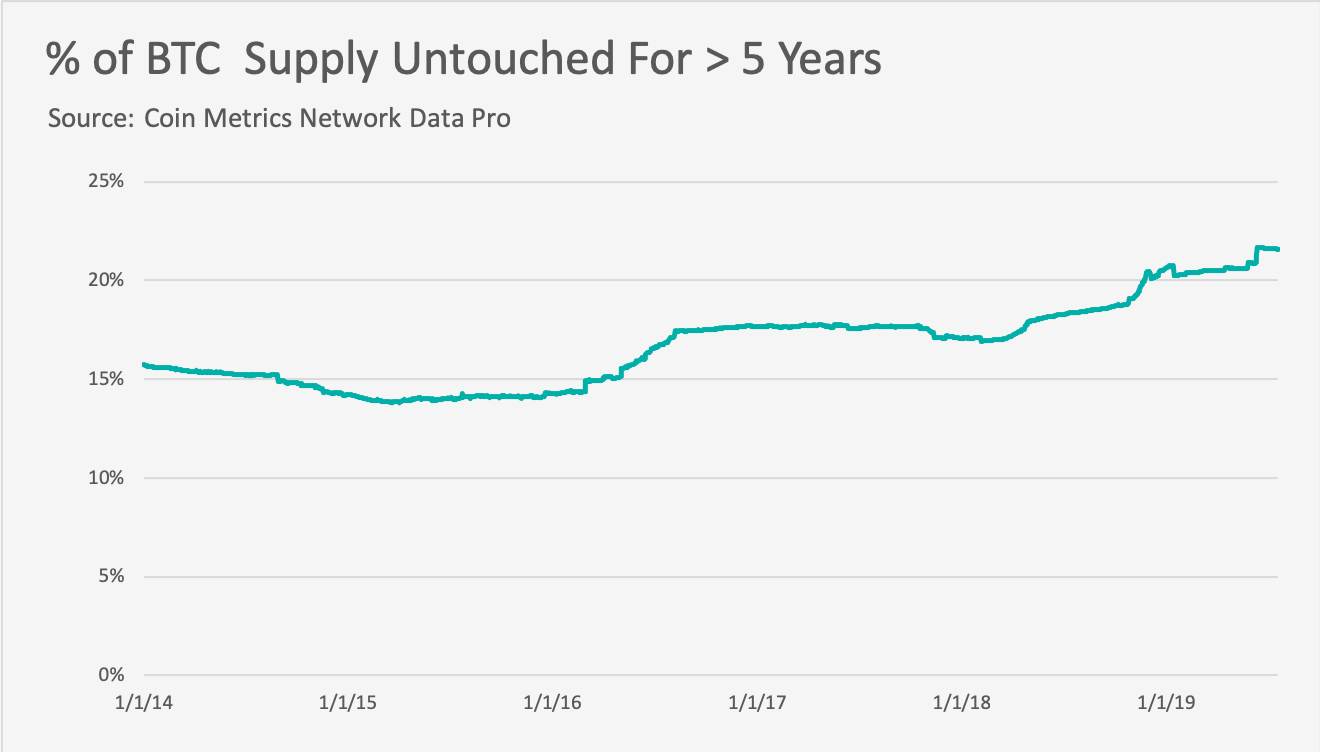
The amount of Bitcoin (BTC) supply that has been untouched (i.e. not transferred) for at least five years recently reached an all-time high. This potentially signals that BTC is increasingly becoming a store of value, as opposed to a medium of exchange. On July 19th, there were 3,847,859 BTC that had not moved since at least five years prior:

We calculate total untouched supply by looking at the total active supply (we define “active supply” as the amount of unique supply that transacted at least once over a specific time period) and subtracting it from the total current supply. Although the size of the BTC supply has been consistently growing, the percent of the overall supply of BTC that has been untouched for at least five years also recently reached a five year high of 21.6%:

Untouched supply tends to mirror price movements. The below chart shows supply that has been untouched for at least 180 days, 1 year, and 2 years, relative to BTC price USD (shown on a log scale). The untouched supply tends to peak towards the bottom of a price trough, and vice versa:

Network Data Insights
Summary Metrics

Network metrics fell across the board over the past week. ETH’s market cap is down 21% compared to last week (computed by taking the seven day average from this week and comparing it to the seven day average of the previous week), which is the biggest drop out of the largest five assets. Unsurprisingly, ETH’s adjusted transfer value also dropped significantly, down 30% from the week prior.
On a positive note, BTC’s realized cap grew slightly over the past week. Realized cap is calculated by valuing each piece of the supply at the price it last moved. In other words, it prices the supply at the time holders “realized” their gains or losses. Although BTC’s market cap fell by 11%, the amount of “realized” dollars invested in BTC grew by 1%.
Network Highlights
The number of BTC held by BitMEX continues to drop following the disclosure of a CFTC probe into the presence of US traders on the platform. As of July 21st, BitMEX’s BTC supply dropped to 174.9k, down from a peak of 246.0k on 3/4/19:

Funds have been increasingly flowing out of BitMEX since the 19th, when the news about the CFTC probe first came out. Over the course of July 19th, 20th, and 21st, $135,361,144.30 of BTC was withdrawn from BitMEX, while $38,978,107.34 flowed in. The below chart shows BitMEX’s daily BTC inflow and outflow in USD. Daily outflow is in red, and daily inflow is in blue:

Market Data Insights
Sharp Declines in Most Assets Over the Past Month
Over the past month, Bitcoin has experienced two local peaks in price: first in late June where Bitcoin reached $13,800 before experiencing a sharp correction, and another in early July where Bitcoin reached $13,000 before experiencing a similar short-lived correction under $10,000.
Although asset prices are substantially higher than the lows reached early this year, compared to Bitcoin, most assets have participated less strongly on the upside and more strongly on the downside. Over the past month, almost all assets have experienced a steep correction in price with some major assets down over 40%. During this volatile period of price discovery, Bitcoin has remained nearly unchanged, with a decline of only 2% in the same period.
Notable underperformers include EOS (-44%), Cosmos (-41%), and Cardano (-37%). Tezos (-6%), VeChain (-10%) and Binance Coin (-19%) outperformed this cohort of assets although still with a negative return.


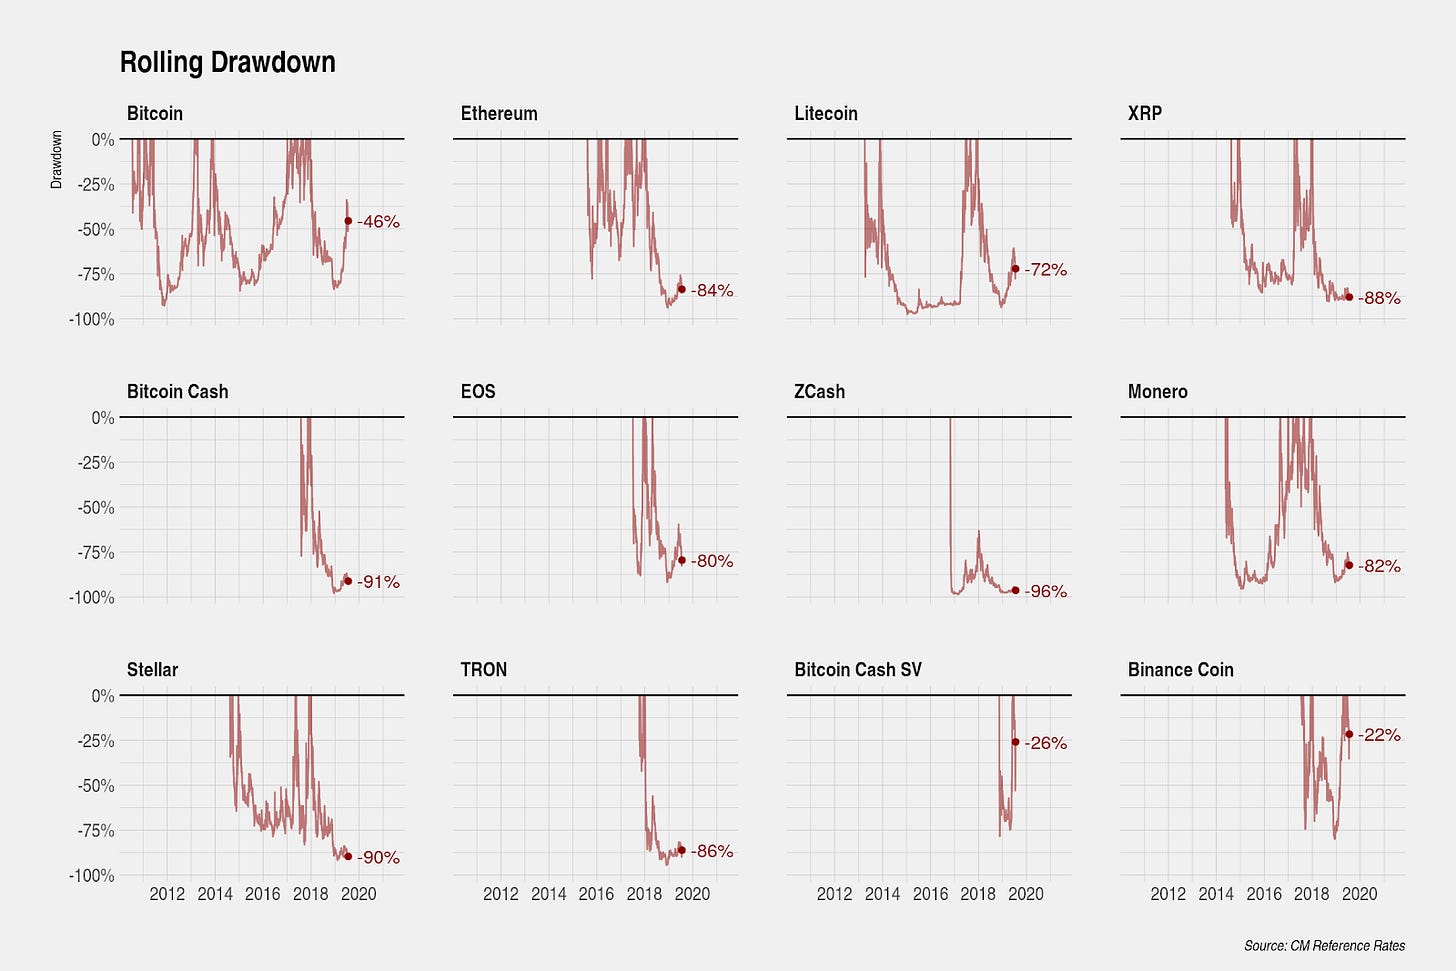
An examination of the rolling drawdown highlights how most assets have given up a substantial portion of their gains this year and some assets are extremely close to their maximum drawdown. Binance Coin (-22%) and Bitcoin Cash SV (-26%) are notable in that they have already exceeded their prior all-time highs recently. Bitcoin’s drawdown now stands at only -46%.


Bitcoin Outperformance Driven by Regulatory, Geopolitical, and Macroeconomic Factors
Several narratives explain the strong relative outperformance in bitcoin over this period:
Although there have been few public announcements by U.S. regulators, the body of evidence that U.S. regulators are exerting more pressure on market participants continues to grow. Earlier this year, Poloniex, Bittrex, and Binance all took steps to restrict U.S. traders from participating in certain markets. In June, the SEC filed a lawsuit in connection with Kin’s token offering in a clear indication that the SEC will be unyielding in its interpretation of existing securities law. The CFTC has also begun an investigation into BitMEX and whether it has allowed U.S. investors to trade on its platform.
U.S. Treasury Secretary Mnuchin recently stated in a White House press briefing that he had “very serious concerns” about cryptocurrencies and stated that crypto businesses must comply with the Bank Secrecy Act and register with the Financial Crimes Enforcement Network. And Facebook’s launch of Libra has sparked congressional scrutiny with two separate Senate committees holding hearings about Libra and cryptocurrencies.
The net impact of these events is to drive crypto capital towards Bitcoin, which thus far has the most regulatory clarity.
Additionally, heightened geopolitical tensions and a growing acceptance that Bitcoin serves as a digital store of value and hedge in uncertain times has provided support. The recent increase in geopolitical risk has been driven primarily by the U.S.-China trade dispute, but also by the increased threat of disruption of global oil supplies in the Middle East, the resurgence of Eurozone fragmentation risk (particularly increased risk that Italy may leave), and growing tensions in Hong Kong.
The correlation between Bitcoin and gold has been particularly strong over the recent past as investors increasingly seek haven assets. Gold recently has exceeded key technical price levels and reached a six-year high.
Lastly, the macroeconomic environment has decisively shifted over the past several months in the direction of more monetary easing. Specifically, real interest rates (inflation-adjusted interest rates) have come down across the board in major developed world countries and across most durations. Pockets of weakness in forward-looking macroeconomic indicators have increased market participants’ expectations of a recession and combined with the dramatic shift in forward guidance by major central banks, interest rates have sharply declined. It now seems nearly certain that the four major central banks of the world (the Federal Reserve, the European Central Bank, the Bank of Japan, and the People’s Bank of China) are on the cusp of another monetary easing cycle. As real interest rates decline, the opportunity cost of holding non-yield producing assets like Bitcoin declines. Moreover, since many short-term interest rates around the world are close to the effective lower bound, central banks will once again have to consider the use of quantitative easing and other unconventional monetary tools that risk long-term instability.
Although the empirical evidence around Bitcoin’s reaction function to changes in future monetary policy and expectations in growth and inflation is mixed, on balance, this factor should provide further long-term support to Bitcoin prices.
Subscribe and Past Issues
If you'd like to get State of the Network in your inbox, please subscribe here. You can see previous issues of State of the Network here.
Check out the Coin Metrics Blog for more in depth research and analysis.
