Coin Metrics' State of the Network: Issue 70
Tuesday, September 29th, 2020
Get the best data-driven crypto insights and analysis every week:
Weekly Feature
Ethereum’s DeFi Evolution: How DeFi Is Fueling Ethereum’s Growth
By Nate Maddrey and the Coin Metrics Team
The following is an excerpt from a full-length report, which has been truncated due to space limitations. Read the full report here.
Decentralized finance reached new heights over the last few months as dozens of projects launched and large amounts of capital flowed in. A majority of decentralized finance (DeFi) apps have been built on Ethereum, and DeFi’s explosion has rippled across the network. DeFi has pushed Ethereum to its limits but is also accelerating the pace of innovation and experimentation. In this piece we look at how four DeFi token launches affected Ethereum and how the network is evolving as a result.
DEX Dominance
The rise of DeFi has brought on a wave of new tokens including some breakouts. The start of ETH’s summer bull run coincided with the launch of yearn.finance’s governance token YFI. But there have also been some big collapses, like the rapid rise and fall of the YAM token. The below chart shows ETH’s price following four of the largest DeFi token launches to date: YFI, YAM, SUSHI, and UNI.
Source: Coin Metrics Reference Rates
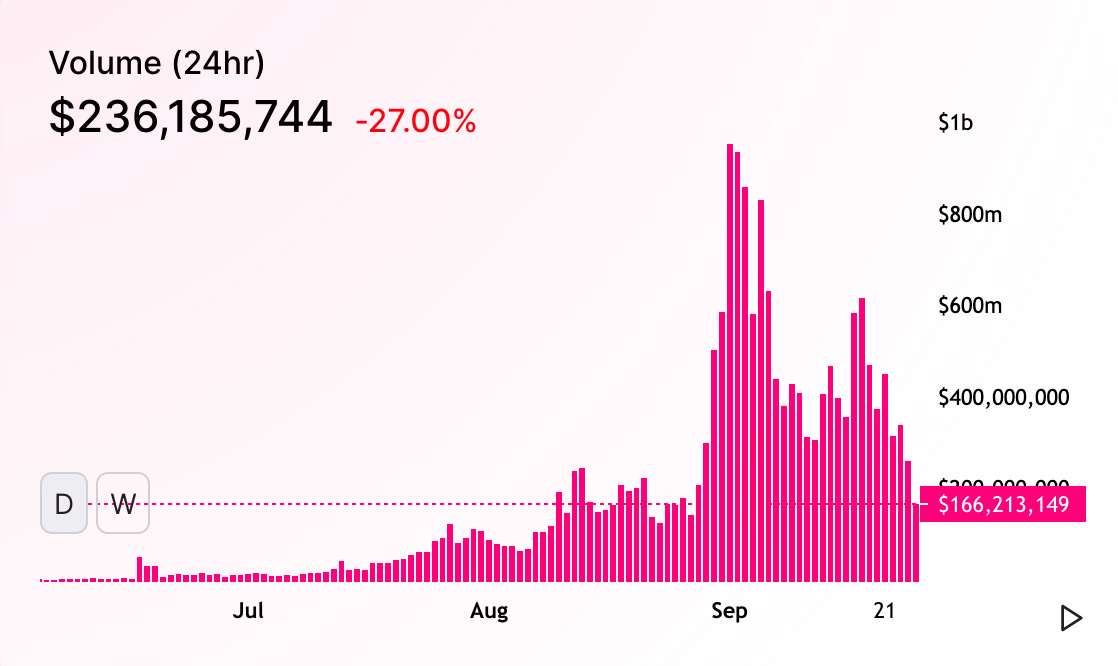
Uniswap, the largest decentralized exchange (DEX) on Ethereum, has been the engine for DeFi token trading. Uniswap trading volume has increased from about $1M a day in early June to close to $1B a day in the beginning of September. Unlike centralized exchanges like Coinbase or Binance, Uniswap trading occurs entirely on-chain. This means that transactions must be sent and settled on Ethereum each time a Uniswap trade is made. On-chain trading has quickly become one of Ethereum’s biggest use cases.
With the rise of Uniswap and other DeFi dapps the amount of Ethereum smart contract calls hit new all-time highs over the summer. Tokens moving around the ecosystem are increasingly controlled by code, creating a whole new level of efficiency and opportunities for automation. But it also introduces more complexity, as DeFi smart contracts can interact with each other and automatically route tokens through multiple platforms.
Source: Coin Metrics Network Data Pro
Another result of DEX growth is the rise of wrapped ETH. Wrapped ETH (WETH) is basically a way to use ETH as an ERC-20 token. DeFi tokens are built on Ethereum’s ERC-20 token standard, which makes it easy to exchange one token for another. But the ERC-20 token standard was introduced after ETH was launched, which means ETH itself does not abide by these standards. To create WETH, ETH is locked up into a smart contract in exchange for WETH tokens.
WETH supply has soared to new all-time highs following the launch of YFI.
Continue reading Ethereum’s DeFi Evolution...
Network Data Insights
Summary Metrics
Source: Coin Metrics Network Data Pro
Ethereum (ETH) network metrics mostly dipped this past week. ETH adjusted transfer value continued to tumble after surging to two year highs in early September. On a positive note, ETH active addresses stabilized after falling after the launch and collapse of the SUSHI token.
Bitcoin (BTC) network metrics, on the other hand, were mostly positive on the week. BTC daily active addresses remain near all-time highs, topping 1.14M on September 25th.
Network Highlights
Total stablecoin supply has reached $20B. While Tether still has a large fraction of supply share, other stablecoins are starting to make up ground. USDC growth has been outpacing Tether, causing Tether's dominance to dip below 80% for the first time in the modern era of stablecoins.
Source: Coin Metrics Formula Builder
Stablecoin transfer value also continues to grow compared to BTC. BTC has historically dominated transfers, but since July stablecoins have taken over as the main method of transferring value on-chain. The rise of stablecoin on-chain transfer value coincides with the rise of DeFi, as highlighted in this week’s Weekly Feature.
Source: Coin Metrics Formula Builder
While stablecoins are increasingly being used for value transfer, Bitcoin is apparently increasingly being used as a store of value. The percent of BTC supply held for at least one year recently hit 63.5%, its highest level since 2010.
Source: Coin Metrics Formula Builder
Market Data Insights
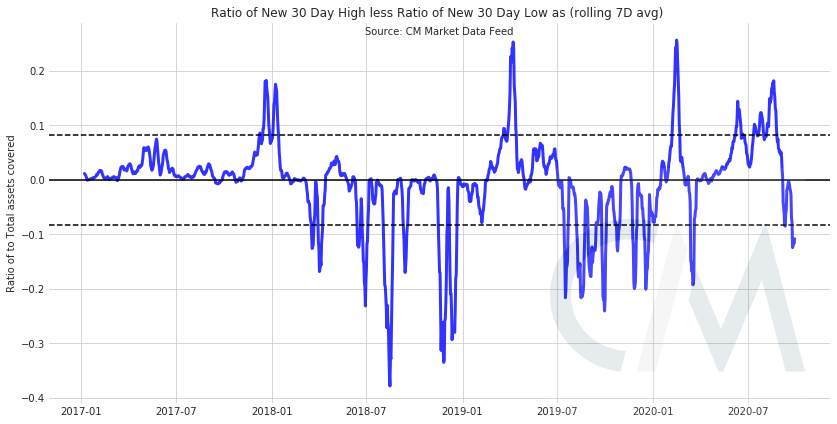
Some of the euphoria of recent months appears to be fading. Week over week, 72% of the roughly 250 assets that we calculate reference rates for have declined in price. Month over month that number increases to 93%. This is a significant shift from the sentiment that was felt in the bull market only a few weeks ago.
To better gauge the sentiment, we look at a rolling 7 day metric using a ratio of assets making new 30 day highs less a ratio of those making new 30 day lows. This shows us at a bearish level not seen since the selloff in March of this year.
This past week’s options expiration was fairly uneventful, with Bitcoin staying within the max pain range of $10-11k and Ethereum staying between $300-400. Volatility still remains relatively muted compared with historical ranges.
CM Bletchley Indexes (CMBI) Insights
Most of the CMBI and Bletchley Indexes finished this week down slightly, with the CMBI Ethereum Index closing the week at $353.10, down 4.9%. The CMBI Bitcoin Index had another relatively flat week, closing at $10,724.67, down 1.4%.
Multi-asset market cap weighted indexes were also all down for the week, with the Bletchley 40 (small caps) again the worst performer during this recent negative market sentiment, closing down 2.4%. Interestingly, the Bletchley 10 Even closed the week up, despite the negative performance of the CMBI Bitcoin Index, the CMBI Ethereum Index, and the Bletchley 10. This is largely attributed to the weekly performance of Cardano (up 13%) and BSV (up 10%).

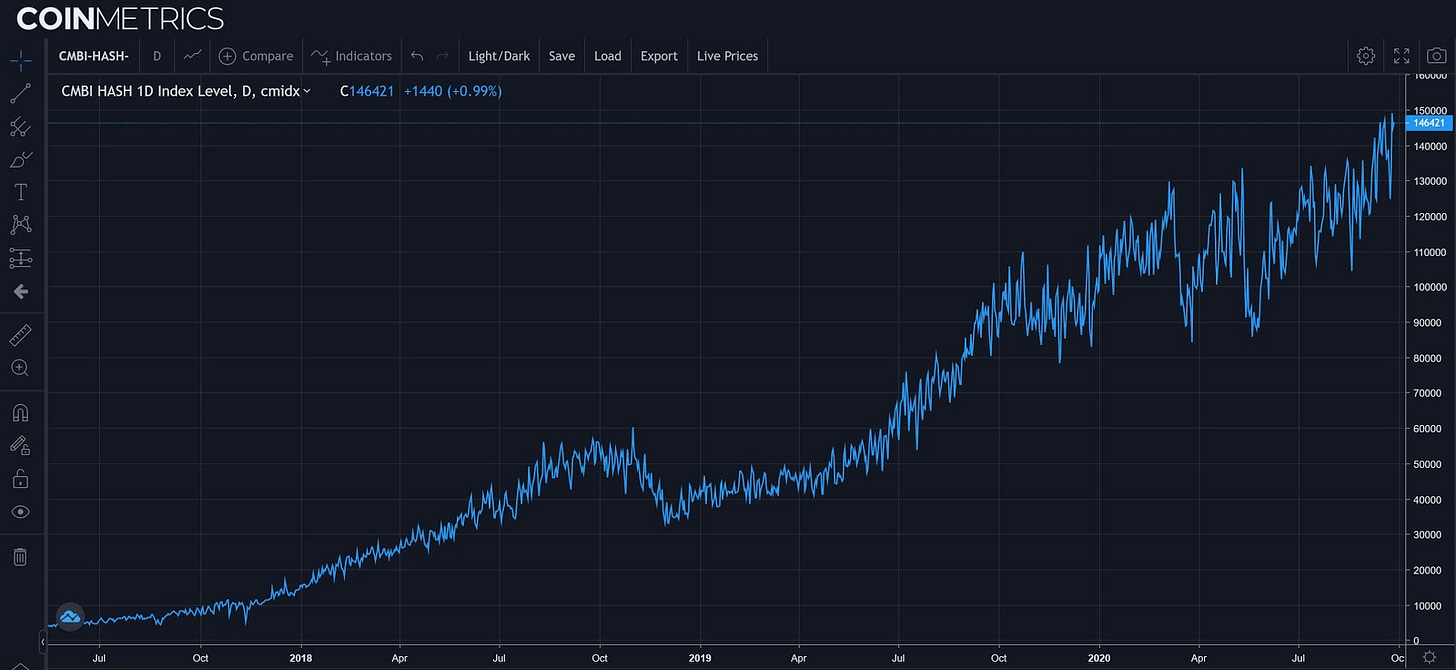
As many expected, Bitcoin’s Hash Rate retraced after Bitcoin’s 11.35% difficulty adjustment last week. However, this retrace was short lived and for the third week running, the CMBI Bitcoin Hash Rate Index reached all time highs, above 150 exahashes per second. Hash rate has been on a roll during the Chinese wet season. But the wet season is coming to an end shortly, potentially resulting in a slowdown of the recent rate of increase of hash rate.

More performance information can be found here:
CMBI Bitcoin Index and CMBI Ethereum Index can be found in the August CMBI Single Asset Index Factsheet.
CMBI Mining Indexes can be found in the August CMBI Mining Index Factsheet.
Coin Metrics Updates
This week’s updates from the Coin Metrics team:
We’re excited to announce the new Coin Metrics mobile app. View real-time cryptoasset pricing and relevant on-chain data in a single app! Download for free here: https://coinmetrics.io/mobile-app/
As always, if you have any feedback or requests, don’t hesitate to reach out at info@coinmetrics.io.
Subscribe and Past Issues
Coin Metrics’ State of the Network, is an unbiased, weekly view of the crypto market informed by our own network (on-chain) and market data.
If you'd like to get State of the Network in your inbox, please subscribe here. You can see previous issues of State of the Network here.
Check out the Coin Metrics Blog for more in depth research and analysis.


