Coin Metrics' State of the Network: Issue 79
Tuesday, December 1st, 2020
Get the best data-driven crypto insights and analysis every week:
Weekly Research Focus
Signs of Institutional Investors
by Nate Maddrey and the Coin Metrics Team
Over the past few weeks, Ari Paul, Luke Martin, and other commentators have noted that bitcoin’s upward price movements since late October have mostly happened during US market hours, when the traditional equity markets were open. This potentially suggests that price rises are being driven by a new wave of institutional buyers who are active during the day and relatively inactive on nights and weekends. We examined this theory using our hourly reference rates to get a more granular look at bitcoin price action during US market hours.
As bitcoin (BTC) price hovers around $20K, one of the major narratives around the price surge has been the arrival of institutional investors. After crypto and equity markets crashed in mid-March as COVID-19 began to spread, a new wave of institutional interest started to rise from the rubble.
In early May billionaire hedge fund manager Paul Tudor Jones announced that he had over 1% of his assets in bitcoin. He explained that he viewed it as an inflation hedge against fiat currencies, saying that “your central bank has an avowed goal of depreciating [fiat’s] value 2% per year.”
As central banks began printing more and more in response to struggling global economies, the inflation hedge narrative began to gain momentum. In August, MicroStrategy, a publicly traded $1.2B company (at the time) announced the purchase of $250M worth of bitcoin as a “capital allocation strategy.” In a statement, they elaborated that “investing in the cryptocurrency would provide not only a reasonable hedge against inflation, but also the prospect of earning a higher return than other investments.”
In November, billionaire investors Bill Miller and Stanley Druckenmiller joined in, publicly stating that they held and recommended bitcoin. Both compared bitcoin to gold, with Miller adding that he thinks “inflation is ‘coming back’ due to the Federal Reserve ‘gunning the money supply.’” A few weeks later, a Citibank senior analyst predicted bitcoin could reach over $300K and called it “21st century gold” in a leaked note to institutional clients.
In addition to billionaires, payment providers are getting more involved with crypto. On October 8th, Square announced a $50M investment into bitcoin. And on October 21st, PayPal made an official announcement that it was introducing “a way for customers to buy, hold, and sell certain cryptocurrencies within the PayPal wallet.” Bitcoin’s price was $12.85K on October 21st, and has increased to over $19K since.
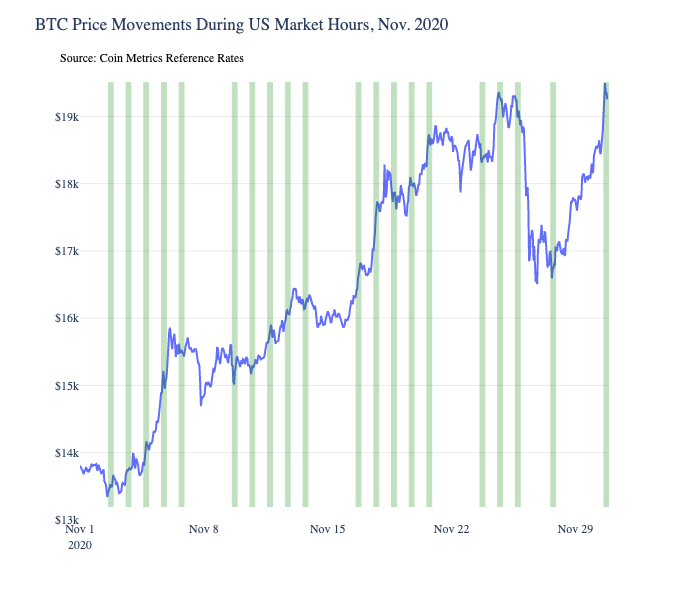
Our analysis starts at the beginning of November, on the heels of PayPal’s announcement, as bitcoin began to ascend towards $20K. Building on Luke Martin’s chart, we used our hourly reference rates to examine bitcoin’s price movements during US market hours. The below charts highlight bitcoin’s price during the hours that the New York Stock Exchange was open, shown in green. Hours where the stock market was closed, like nights, weekends, and the Thanksgiving holiday, are left blank (i.e. not highlighted).
Results are somewhat mixed - there is occasionally price movement overnight, the most prominent example occurring on November 5th. But overall, over the last month price has moved upward more during hours that US markets were open than during hours where US markets were closed. On average, bitcoin’s hourly returns were about 0.1% during market open hours compared to about 0.04% when markets were closed.
Interestingly, while price moved sideways over the first three weekends of the month, last weekend saw significant upward movement. This followed a large drop on the night of Wednesday the 25th and over Thanksgiving, and is potentially related to a large CME bitcoin futures gap to close the month. Price took a big jump up on Monday, November 30th once markets re-opened.
Source: Coin Metrics Reference Rates
Comparatively, price movement during November 2017, during bitcoin’s bull run leading up to its previous all-time high, was more scattered. Specifically, November 2017 saw more movement during nighttime hours when US markets were closed, and more volatility over weekends. Average hourly returns were about -0.13% while US markets were open versus about 0.11% while markets were closed.
Source: Coin Metrics Reference Rates
Comparing two months is a relatively small sample size, and does not necessarily provide a definitive answer. But we are starting to see some interesting evidence of growing institutional involvement, and will continue to investigate and dive deeper moving forward. If you’ve conducted your own research into this topic or would like to access our data to explore on your own please let us know by emailing info@coinmetrics.io, or reaching out to us on Twitter @coinmetrics.
Network Data Insights
Summary Metrics
Source: Coin Metrics Network Data Pro
It was a mixed week for Bitcoin (BTC) on-chain metrics. Despite prices testing all-time highs, activity fell off slightly mid-week during the US Thanksgiving holiday as BTC price dropped following Wednesday night. Active addresses are down about 2.2% week-over-week, although the daily average still remained at about 1M.
Ethereum (ETH) had a relatively strong week, buoyed by news that the Ethereum 2.0 deposit contract received enough funds to launch the first phase of the network’s transition to Proof of Stake. The genesis block of Ethereum 2.0 is now set to launch on December 1st at 12:00 GMT.
Network Highlights
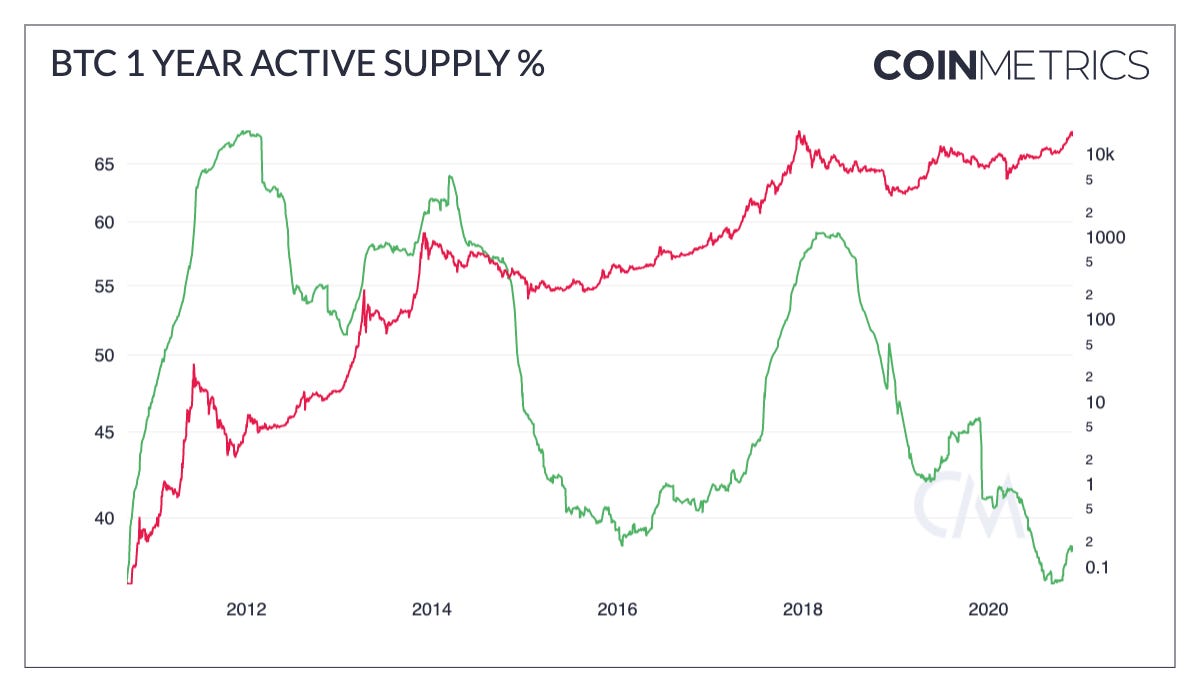
With BTC price hovering around $20K attention is starting to shift towards analyzing where we are in the market cycle. One relatively simple way to gauge bitcoin cycles is to look at on-chain supply activity. Since every bitcoin transaction is publicly recorded, we can track how often individual units of supply are moved between addresses (i.e. sent as part of a transaction). For example, about 873K BTC were active within the past week (about 5% of total supply), while about 14.47M BTC have been active within the last 5 years (about 78% of total supply).
“1-year active supply percent” is the percent of total BTC supply that has been transferred on-chain within the last year. As BTC price rises, an increasing amount of dormant supply typically starts to become active as long-term holders sell or move their BTC. Conversely, when BTC price is low for extended periods of time, 1-year active supply percent tends to drop as investors hold through crypto winters.
After reaching a low of about 36.5% in early September, BTC’s one year active supply has started to increase slightly and is currently around 38.44%.
HODL Waves expands this concept by looking at active supply bands for all of BTC’s supply. For more on HODL Waves see the Network Highlights section of State of the Network Issue 66.
Source: Coin Metrics Network Data Charts
Stablecoins are now officially being used as a tool of US foreign policy. On November 20th, Circle announced a partnership with the government of Venezuela to distribute aid to front-line medical workers as they battled coronavirus. Venezuelan currencies have notoriously suffered from hyperinflation due to rampant money printing, which makes stablecoins an attractive option for quick and reliable aid. This represents a potentially transformative use case for stablecoins and cryptocurrencies in general as global economies continue to suffer amidst the pandemic. USDC daily active addresses hit a new all-time high of 43.21K on November 24th, four days after the announcement.
Source: Coin Metrics Network Data Charts
In other stablecoin news, PAX supply has increased by about 100M since PayPal’s October 21st announcement that they would be supporting cryptocurrencies. PayPal is using Paxos, the company behind PAX, as their infrastructure provider.
Source: Coin Metrics Network Data Charts
Market Data Insights
Bitcoiners old and new alike rejoiced today as the orange coin reached a new all time high price which, according to our real time reference rate, clocked in at $19.864.08. It has been 1,079 days since we last crossed this milestone.
Source: Coin Metrics Reference Rates
Other large market capitalization assets have held their own against BTC. Ethereum, XRP, Litecoin and Cardano have all notched gains in BTC value over the past month. Ethereum aside, one popular theory is that traders may be chasing the legacy assets in the space that they believe incoming “retail” flow may view as “cheap” and subsequently appreciate in value.
Source: Coin Metrics Reference Rates
CM Bletchley Indexes (CMBI) Insights
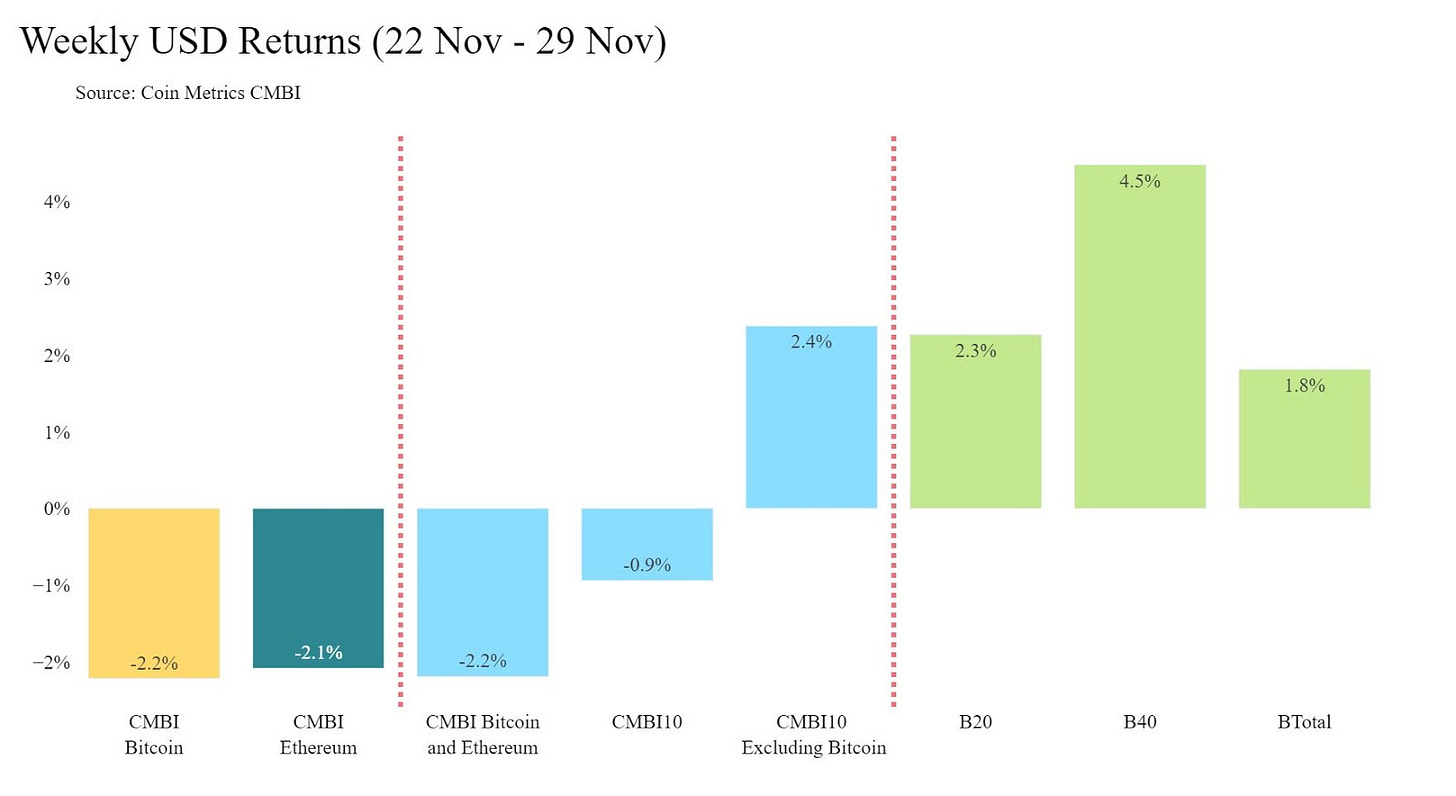
Over the last week, the CMBI Bitcoin and CMBI Ethereum indexes both experienced pullbacks after several weeks of strong performance. This stall in price action provided the opportunity for investors to seek returns in the rest of the market that had lagged this recent run up. This is most evidenced in the different return profiles of the CMBI 10 and the CMBI 10 Excluding Bitcoin (CMBI10EX), which returned -0.9% and 2.4% respectively. The positive return of the CMBI10EX is particularly interesting when considering 61% of the index is Ethereum, which was down 2.1% for the week.
This week’s top performing index was the Bletchley 40 (small caps), which rose 4.5% for the week.
Coin Metrics Updates
This week’s updates from the Coin Metrics team:
We’re excited to announce the new Coin Metrics mobile app. View real-time cryptoasset pricing and relevant on-chain data in a single app! Download for free here: https://coinmetrics.io/mobile-app/
As always, if you have any feedback or requests, don’t hesitate to reach out at info@coinmetrics.io.
Subscribe and Past Issues
Coin Metrics’ State of the Network, is an unbiased, weekly view of the crypto market informed by our own network (on-chain) and market data.
If you'd like to get State of the Network in your inbox, please subscribe here. You can see previous issues of State of the Network here.
Check out the Coin Metrics Blog for more in depth research and analysis.


