
Coin Metrics' State of the Network: Issue 11
Tuesday, August 6, 2019

Intro and Updates
Dear crypto data enthusiasts,
Welcome back to this week’s edition of Coin Metrics’ State of the Network, an unbiased, focused view of the crypto market informed by our own network (on-chain) and market data.
This week’s housekeeping items:
Coin Metrics is pleased to announce the launch of block-by-block data for its popular institutional network data product, CM Network Data Pro. This Real-Time Block-by-Block feed features 83 metrics aggregated across every block. Metrics include transactions, transfers, active addresses, fees and miner revenue, on-chain exchange flows, and more. Please reach out to Coin Metrics (info@coinmetrics.io) for more information on the CM Network Data products.
Coin Metrics is hiring! Please check out our Careers page to view the openings.
As always, if you have any feedback or requests, don’t hesitate to reach out at info@coinmetrics.io.
Weekly Feature
A Look Back at the Last Year of ETH On-Chain Data
Last week, Ethereum (ETH) celebrated its 4th birthday. In honor of the occasion, we looked back at the last 365 days of on-chain data for ETH and some of the biggest ERC-20 tokens.
After a wild third year in which ETH price climbed to a peak of just over $1,400 USD, ETH came back down to earth over the past year. Starting at a realized cap of over $42 billion in August 2018, ETH’s realized cap fell to $28.5 billion as of July 30th, 2019. However, ETH’s realized cap began to stabilize and increase again in late May 2019.
Realized cap is calculated by valuing each unit of supply at the price it last moved. Realized cap can be thought of as the cost basis for the average holder:

We also looked at the realized market cap for ten of the largest ERC-20 tokens: Basic Attention Token (BAT), Dai (DAI), FunFair (FUN), Gnosis (GNO), Golem (GNT), Decentraland (MANA), Maker (MKR), OmiseGO (OMG), Augur (REP), and 0x (ZRX).
Similar to ETH, realized cap fell for most of these ERC-20 tokens over the past year. MKR and DAI, however, both rose. MKR’s realized cap grew to over $608 million on July 30th, 2019, up from $479 million twelve months earlier.

The following chart shows each ERC-20’s daily average market cap plotted against its daily average realized cap (averaged from 7/31/2018 to 7/30/2019). This shows the tokens compared against each other on an absolute basis, while the above charts are scaled to each particular asset (i.e. each subchart has its own y-axis scale).
OMG has a high realized cap relative to its market cap. However, OMG also had a relatively large airdrop in September 2017, which may skew some of its metrics.

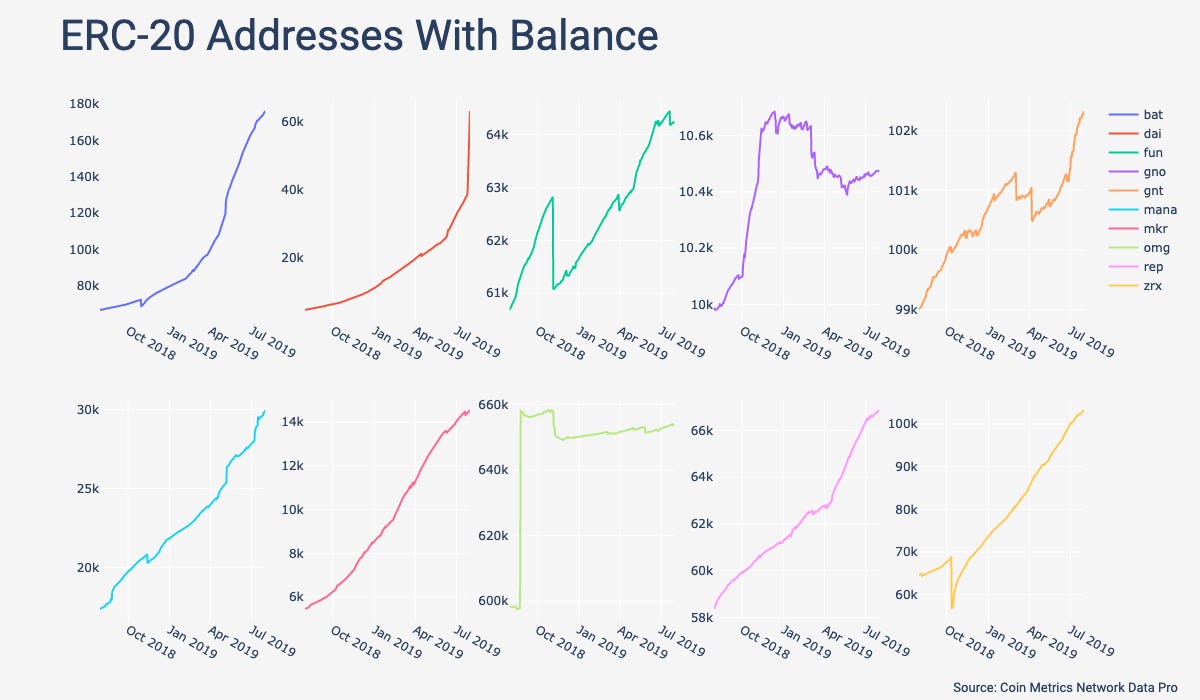
Despite the drop in realized cap, the number of ETH addresses that held any balance (i.e. greater than zero) grew steadily over the past year. The below chart shows the daily count of ETH addresses that closed the day with a balance above zero. As of July 30th, 2019, ETH had over 28.8 million addresses with a balance.

Addresses with balance also grew for all of the ERC-20s over the past year. DAI addresses with balance have been growing particularly quickly, rising from under 4,600 to over 63,000 over the past year. BAT addresses with balance also grew significantly, going from under 67,000 on July 31st, 2018 to over 175,000 by July 30th, 2019. OMG’s addresses with balance, on the other hand, plateaued almost a year ago.
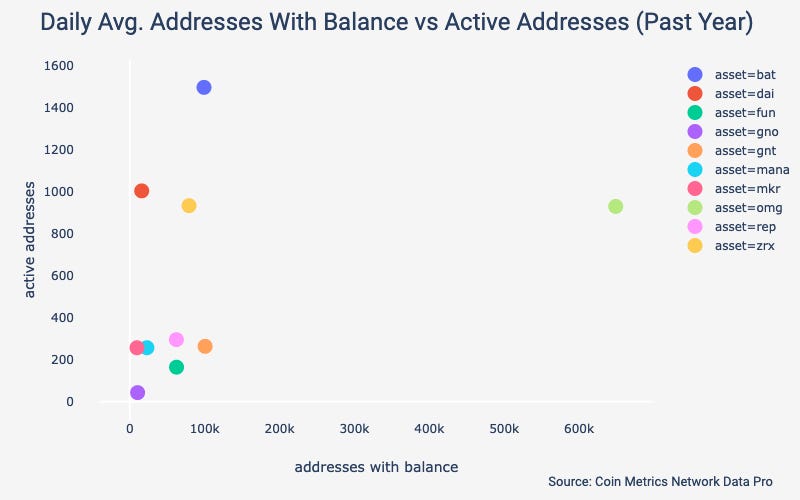
The below chart shows each ERC-20’s daily average number of addresses with a balance plotted against its daily average number of unique active addresses (daily average from 7/31/2018 to 7/30/2019). BAT has an average of 99,128 addresses with balance, and an average of 1,496 active addresses a day. OMG has about 649,000 addresses with balance, but an average of only 929 daily active addresses.
ETH adjusted transfer value has fluctuated with price over the past year, staying mostly between $250 million and $750 million per day.

DAI is increasingly becoming the dominant ERC-20 for transfers. DAI’s daily adjusted transfer value has been picking up steam since April 2018.

The below chart shows each ERC-20’s daily average adjusted transfer value plotted against its daily average transaction count (daily average from 7/31/2018 to 7/30/2019). DAI, the only stablecoin out of the tokens we analyzed, is way ahead of any of the other ERC-20’s, with an average of over $25 million in adjusted transfer value a day. DAI also has a significantly higher transaction count than the rest of the tokens, which indicates that users are relying on DAI for transfers much more than the less stable tokens.

Network Data Insights
Summary Metrics

On-chain activity rebounded over the past week. BTC led the way in most of the major metrics, with a 5% gain in market cap and 2% gain in realized cap. BCH also had a relatively strong week, gaining 6% in market cap.
Adjusted transfer value rose across the board, led once again by BTC at 24%, with XRP in close second at 22%. ETH and LTC’s adjusted transfer value also rose, but less dramatically, increasing by 11% and 6%, respectively.
Network Highlights
BTC’s realized cap continues to break all-time highs. On August 4th, the BTC realized cap reached over $97.2 billion.

While realized cap has been rising, BTC’s median fee has been falling. The median BTC fee dropped to under $0.16 on August 4th, which is the lowest it has been since late March.

Market Data Insights
Empirical Data Supporting the Safe Haven Narrative is Mixed
Over the past several months, global markets have begun pricing in increasingly higher levels of geopolitical risk (primarily driven by flare ups of U.S.-China trade tensions but also driven by increased risk of European Union fragmentation, and increased likelihood of disruption in shipping in the Persian Gulf). These geopolitical events have been occurring against a backdrop of slowing global growth and yield curve inversions. Additionally, inflation measures coming in consistently below central bank price stability targets have put pressure on the world's major central banks to initiate easier monetary policy in order to uphold their mandates and sustain the current economic expansion.
Under this macroeconomic environment, Bitcoin has experienced strong gains this year which has coincided with similarly strong gains in classic safe haven assets -- chief among them gold, but also U.S. sovereign bonds, the Swiss franc, and the Japanese yen. This relationship has breathed new life in the narrative that Bitcoin can serve as a haven asset.
Testing this theory using empirical data is difficult because of the number of confounding variables at play that can affect price. In this week's State of the Network, we examine the price impact and trading activity surrounding the previous 16 meetings of the Federal Open Market Committee (FOMC).
The Fed holds eight regularly scheduled meetings each year in which a statement describing their policy decision is released, sometimes held concurrently with a press conference in which reporters can ask questions to the Fed Chairman. Such events are interesting because they are scheduled far in advance, widely monitored and anticipated by market participants, and often contain new macroeconomic information that affect the prices of nearly all assets. Indeed, it is common to observe an immediate reaction in major asset prices (e.g. equities, bond yields, gold) precisely at the moment that the FOMC statement is released at 14:00 EST.
An examination of Bitcoin’s price to Fed meetings shows that, with a few exceptions, Bitcoin is unresponsive to such macroeconomic surprises. The chart below presents Bitcoin’s price indexed to the time of the publication of the FOMC’s statement, twelve hours before and twelve hours after the event. Even allowing for a delayed reaction in Bitcoin’s price due to market inefficiency, price reaction is generally quite muted in contrast to traditional financial assets, including haven assets that Bitcoin is often compared to.

A lot of attention was given to the most recent Fed meeting that concluded on July 31 because this was the first time in Bitcoin’s history that the Fed cut interest rates. Despite the historical significance of this event, virtually no price reaction was observed. However, beyond some comments that indicate that the Fed is slightly less dovish than expected, little new information was released in this meeting as this cut was widely telegraphed in advance and priced in.
The most impactful Fed meeting of this year is likely the one that concluded on March 20 in which the Fed made a dramatic shift in their forward guidance -- a shift from monetary policy tightening to loosening, combined with the publication of projections that reduced this year’s anticipated interest rate increases from two to zero. In response to this meeting, there were large movements in asset classes with U.S. sovereign bonds rallying and the U.S. dollar declining. Despite this somewhat unexpected dovish pivot by the Fed, Bitcoin price was unresponsive.
Bitcoin’s response to Fed meetings in 2017 and 2018 are also quite muted, although slightly larger compared to recent meetings due to the higher volatility that existed during those periods.
Examining trading volume surrounding the conclusion of Fed meetings reveals a similar picture. With a few exceptions, there is no widespread evidence that market participants adjust their Bitcoin positions in the face of new macroeconomic information.

However, there was a burst in trading activity surrounding the Fed meeting on May 1st of this year with a small but concurrent movement in price. Interestingly, there was also evidence of moderately increased trading activity precisely at the moment of the conclusion of the most recent Fed meeting on July 31st. If this type of reaction is sustained in future Fed meetings, this would represent a milestone in Bitcoin’s development as an asset class. In subsequent issues, Coin Metrics will continue to examine Bitcoin’s reaction to critical geopolitical events and macroeconomic surprises, including this week’s Chinese yuan devaluation. The yuan devaluation and the US Treasury's subsequent labeling of Chinese as a currency manipulator happened too late in the week to cover in this week’s issue, but we plan to cover this in depth next week.
CM Bletchley Indexes (CMBI) Insights
Weekly performance of Bletchley Indexes indicate that the large cap crypto assets performed the best this week, once again led by Bitcoin.

However, looking at the monthly performance of indexes, the market experienced a cool-down in July after 3 impressive months of positive gains. Most interestingly, the low cap assets sold off hardest over the period.
In recent months, Bitcoin has been more volatile and has had larger returns during uptrends. But during downtrends small cap assets are more volatile and experienced large losses. This trend has not been common over the last two years.

During the August rebalance there were a few changes to the Bletchley Indexes. The most surprising result was Decred falling out of the Bletchley 20 due to failing an eligibility criteria regarding minimum monthly trade volumes. Below is a summary of all of the changes:

Subscribe and Past Issues
If you'd like to get State of the Network in your inbox, please subscribe here. You can see previous issues of State of the Network here.
Check out the Coin Metrics Blog for more in depth research and analysis.