Coin Metrics' State of the Network: Issue 14
Tuesday, August 27, 2019

Intro and Updates
Dear crypto data enthusiasts,
Welcome back to this week’s edition of Coin Metrics’ State of the Network, an unbiased, focused view of the crypto market informed by our own network (on-chain) and market data.
This week’s housekeeping items:
Coin Metrics is hiring! We recently opened up 7 new roles, including Blockchain Data Engineer and Data Quality and Operations Lead. Please check out our Careers page to view the openings.
As always, if you have any feedback or requests, don’t hesitate to reach out at info@coinmetrics.io.
Weekly Feature
BTC Realized Cap Passes $100 Billion
On August 23rd, BTC realized cap passed $100 billion for the first time ever.

Realized capitalization is a metric created by Coin Metrics that is calculated by valuing each unit of supply at the price it last moved. This is in contrast to traditional market cap which values each coin uniformly at the current market price.
For example, if BTC’s current price was $10,000, traditional market cap would value every single coin equally at $10,000, even if some coins had not been moved for years. This would result in a total market cap of $178,981,250,000 (17,898,125 total BTC multiplied by $10,000).
Realized cap, on the other hand, values each coin at the time it was last exchanged. So if a coin was last touched for $2,500 in 2017, that particular coin would be priced at $2,500 instead of the current market price. Each individual coin is priced this way. This gives a more realistic measure of the economic significance of a crypto asset. Realized cap can be thought of as a measure of the average cost basis of Bitcoin holders (cost basis is basically the total amount originally invested).
BTC’s realized cap rose dramatically from mid-2017 until early 2018, but then leveled off and even decreased until May 2019. BTC realized cap has grown from $77,041,669,541 on May 1, 2019, to a new all-time high of $100,214,944,535 on August 25th.

For comparison, ETH’s realized cap peaked at $54,743,000,000 on January 29, 2018. It has mostly decreased since then; as of August 25th, 2019, ETH’s realized cap is $27,743,000,000.

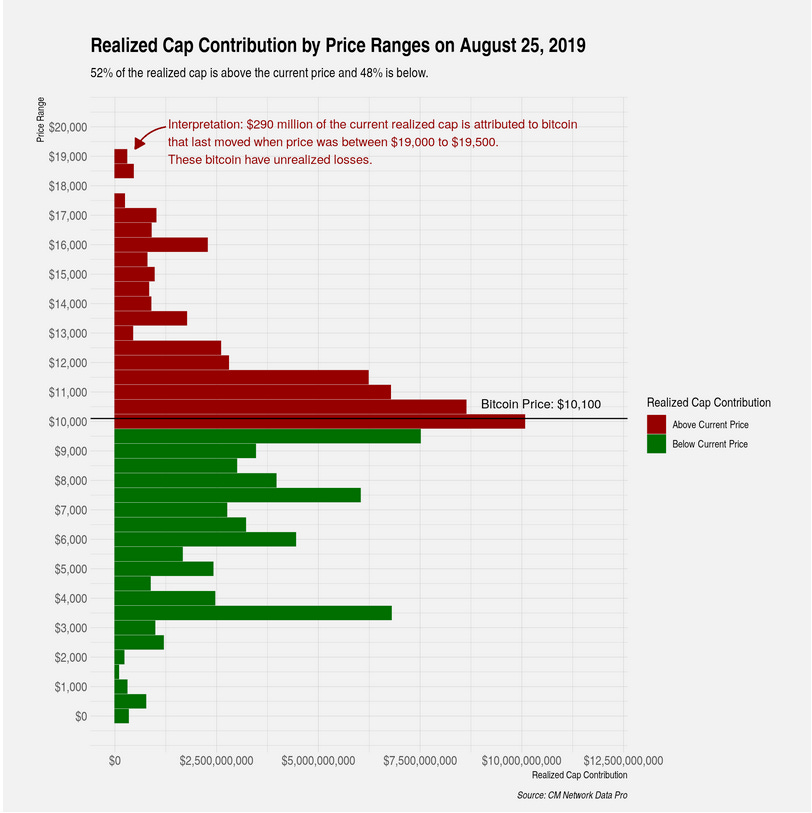
Since each coin is priced differently (depending on the last time it moved), we can get a more granular view of realized cap by looking at the contributions by price ranges. The below chart shows the proportion of realized cap attributed to BTC that last moved at different prices. As of August 25, 2019, 52% of realized cap was composed of BTC that last moved when BTC price was higher than current prices (i.e. holders that would sell for a loss if they sold at the current market price).

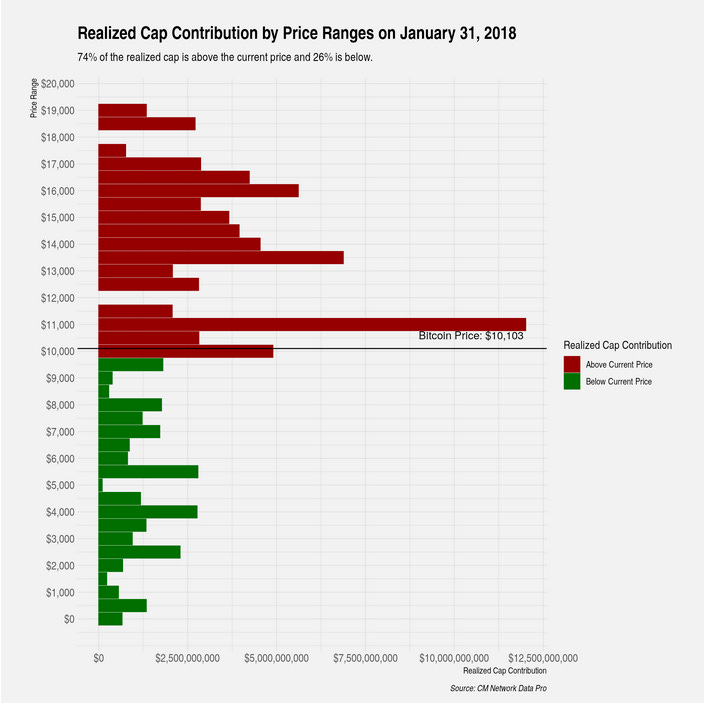
Comparatively, on January 31, 2018, 74% of realized cap was composed of coins that were last exchanged when prices were above current market prices. BTC’s realized cap was composed of a much higher proportion of coins that had last been exchanged in the $13,000 - $20,000 range. This signifies that capitulation is most likely almost complete, since a majority of coins that were bought above $13,000 have now been sold. A relatively large amount of BTC ownership is now concentrated in the $3,000 to $12,000 range, which is setting up for a healthier base.

Network Data Insights
Summary Metrics

The major crypto networks were relatively stable over the past week. BTC, ETH, and XRP market caps all fluctuated by less than 2% compared to the previous week. LTC was down the most, with a 4.8% decrease in market cap week over week.
BTC saw another big spike in hash rate, growing 8.2%, as mining difficulty also recently increased. LTC’s hash rate, however, continued to slide after its recent block reward halving. LTC’s hash rate fell 7.7% from the previous week.
LTC’s adjusted transfer value and transactions were both also down, dropping 45% and 14.9%, respectively. Transaction count for BTC, XRP, and BCH also fell. ETH is the only major crypto network that saw positive transaction growth over the week, rising 4.1%.
Network Highlights
BTC also reached another milestone on August 23rd: all-time mining revenue surpassed $14 billion. We define “mining revenue” as the total USD value of all block rewards plus fees (both of which get paid out to miners) calculated on a daily basis, using that day’s price.

Similar to realized cap, BTC mining revenue increased significantly from late 2017 to early 2018. It has grown fairly consistently since then, with another uptick over the last few months.

USDT-ETH active addresses (the count of unique addresses that were active in the network as a recipient or originator of a ledger change) skyrocketed over the past week, jumping from 38,600 on August 19 to over 78,800 on 8/23. Meanwhile, USDT-OMNI active addresses continue to decline, despite two recent spikes.

Market Data Insights
Tether Total Supply Continues To Grow Rapidly
Tether total supply continues to grow and recently reached an all-time high of 4.27 billion units. Current supply stands at 4.1 billion units (some units have recently been burned by the Tether Treasury), consisting of 2.54 billion issued on the Omni blockchain and 1.56 billion issued on the Ethereum blockchain. Although Tether issued on Ethereum has existed since late 2017, the number of Tether issued on it was low and was seldom used. This changed earlier this year, and the strong growth in Tether total supply can be almost all attributed to Ethereum.
Tether growth on Ethereum could be motivated by several factors. Tether Limited, the administrator of Tether, could seek to reduce its continuity risk by reducing its reliance on the Omni platform (which is not under active development) and Bitcoin. The shift between Omni and Ethereum could also be driven by market demand. The primary use case for Tether is for active trading and arbitrage. For these use cases, Tether on Ethereum is faster (15 second blocks for Ethereum versus 10 minute blocks for Bitcoin) and require less fees. In addition, exchange deposit-withdrawal confirmation times are typically lower for Ethereum-based tokens compared to Bitcoin. Since these characteristics are desirable for active traders, Tether issuance on Ethereum should continue to grow relative to issuance on Omni. The recent burn in Tether came solely from Tether issued on Omni.

Tether supply continues to grow despite the many threats to its existence. In mid-2018, several competing stablecoins launched, supported by several well-capitalized organizations, including TrueUSD, USD Coin, Paxos, and Gemini Dollar. The competing stablecoins and the large fall in prices contributed to flat or negative Tether growth throughout the later half of 2018 to the first half of 2019. However, despite the New York Attorney General announcing an investigation into Tether in April 2019 and the revelation that Tether is not fully backed by fiat currency, Tether growth continues. This suggests that the appeal of Tether to market participants is not only serving as a stable asset pegged to the U.S. dollar but also as a means to evade the scrutiny and regulations that are connected with the global financial system. Tether’s existence in this gray area, in market participants’ eyes, is not a shortcoming but rather a desirable feature.
Relationship Between Bitcoin Price Growth and Tether Supply Growth Deserves Continued Study
Since Tether’s position as a critical quote currency that facilitates trades on exchanges remains unchallenged, the narrative that Tether is responsible for or connected with price growth deserves continued study. In a paper titled “Is Bitcoin Really Un-Tethered”, Griffin and Shams (2018) study two plausible explanations: whether Tether is “pulled” (demand-driven) or “pushed” (supply-driven). Tether is “pulled” if more Tether is issued in response to demand from investors that wish to exchange fiat currency to Tether. Tether is “pushed” if Tether Limited issues Tether regardless of the demand from investors.
Here we use a back-of-the-envelope analysis that compares Bitcoin one-month price growth overlayed with Tether one-month supply growth. The chart below indicates that prior to 2019, Tether supply growth would increase when price growth was slowing, and supply growth would often peak at price bottoms. This is consistent with Griffin and Shams’ findings that support a supply-driven manipulation hypothesis where investors “use Tether to purchase Bitcoin when prices are falling.'' They conclude that “such price supporting activities are successful, as Bitcoin prices rise following the periods of intervention”.

In recent months, however, the relationship appears to have changed. Strong price growth was observed in April of this year but was not preceded by changes in Tether supply. Strong tether printing now appears either concurrent with or lagging price growth, supporting the “demand-driven” hypothesis. The most recent observations indicate that Tether growth has flattened or become slightly negative as prices have done the same.
CM Bletchley Indexes (CMBI) Insights
Across the market most crypto assets were down for the week again. Interestingly for the second week in a row the Bletchley 40, small cap assets, performed best. Whilst it is still too early to call a resurgence in the small cap market, two consecutive weeks of strong returns against the large caps could indicate that investors are finding value at current levels.

Small Cap assets have had a tough year in BTC terms. The market has clearly favoured Bitcoin so far this year after experiencing 2.5-3x returns in price. Off the back off this performance, small caps have struggled to rally and their relatively low levels of liquidity have provided little support for the sell volume that many have experienced. As mentioned above, the last two weeks have provided some respite for small caps and it will be interesting to monitor how this progresses over the next month.

Subscribe and Past Issues
If you'd like to get State of the Network in your inbox, please subscribe here. You can see previous issues of State of the Network here.
Check out the Coin Metrics Blog for more in depth research and analysis.
