Get the best data-driven crypto insights and analysis every week:
Analyzing Recent On-Chain Trends in Stablecoin Activity
By Kyle Waters and Nate Maddrey
Stablecoins have become one of the most discussed categories within the crypto ecosystem, and for good reason: last year stablecoins settled over $6T and their total supply increased from about 28B to 143B across the major stablecoins that Coin Metrics tracks. They have grown even more remarkably since our special report on the Rise of Stablecoins in July 2020.
Stablecoins are tokens issued on public blockchains that primarily aim to track an underlying fiat currency (overwhelmingly the US dollar). Just one month into 2022, over $500B has already been settled with stablecoins (using Coin Metrics’ adjusted transfer volume figures that aim to filter out noise and other economically insignificant activity).
This is a quicker pace versus 2021 where it took until mid-February to see total stablecoin transfer volume surpass $500B. In 2020, stablecoins passed the $500B mark in October. Looking just a few years back at 2019, 2022’s total is already double the total value settled in that entire year.
The chart below shows the total value settled with stablecoins by year with Tether (USDT) in green, USDC in blue, and other stablecoins in purple.
Source: Coin Metrics’ Formula Builder
A big reason why stablecoins are handling more economic throughput is because their total supply has increased dramatically. The total supply of stablecoins is quickly approaching 150B, rising precipitously from 2020.
Source: Coin Metrics’ Formula Builder
The largest stablecoins by total supply are mostly issued and backed by third parties on a 1:1 basis with the promise of redeemability for the underlying dollar or other asset in exchange for the token. The largest such centralized stablecoins include Circle’s USD Coin (USDC), Binance’s BUSD, and Tether (USDT) which together account for over 90% of the total supply of stablecoins Coin Metrics tracks.
Source: Coin Metrics’ Formula Builder
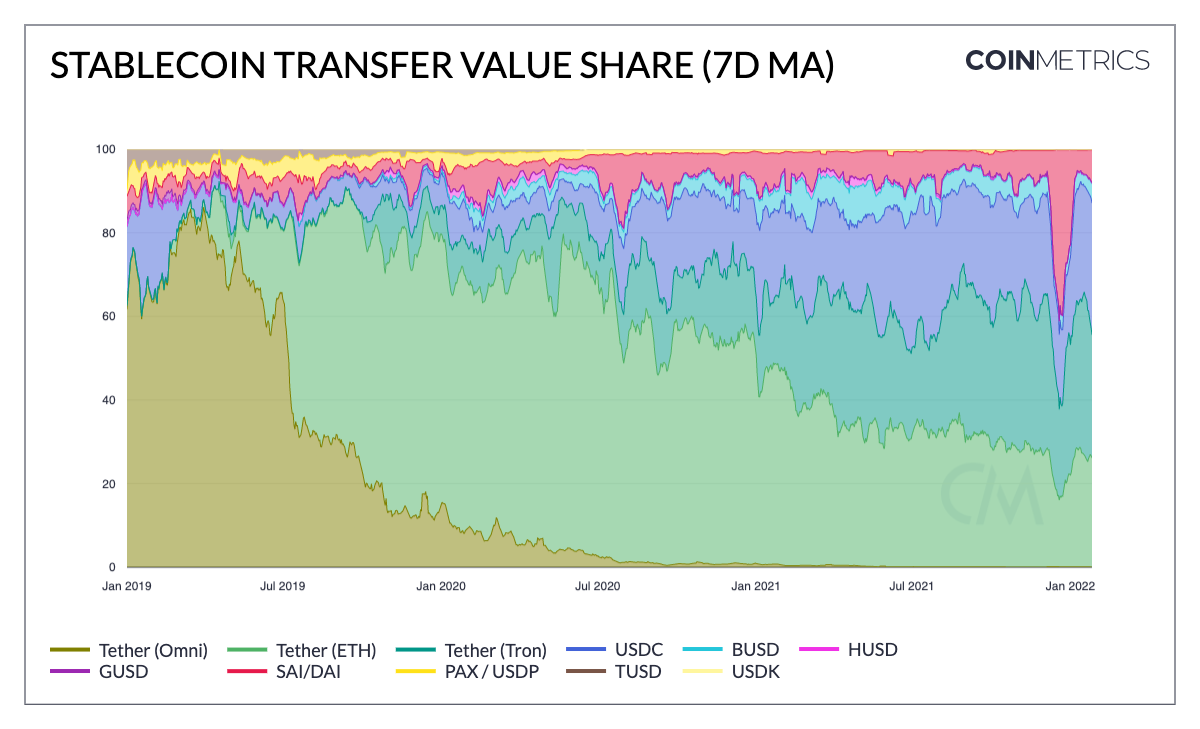
There have been a few notable trends over the last year. First, USDC has been gaining market share quickly and recently surpassed 44B in total supply on Ethereum, and is the largest stablecoin now on the network. Historically, despite being mired in controversy, Tether has been the dominant stablecoin in the ecosystem. But Tether’s share continues to shrink as demand for tokens from newer stablecoin issuers has increased. Today, its share is hovering around 50% across the three instances of USDT Coin Metrics tracks on Ethereum, Tron, and Omni. Within the three Tether versions, USDT on Tron and Ethereum are the most popular with the Omni version largely being abandoned.
The distribution of transfer volume by stablecoin largely mirrors the distribution of supply. MakerDAO’s DAI, a decentralized stablecoin, saw increased transfer volume near the end of 2021 but has since fallen back. Much of DAI’s total supply has been moved to other sidechains or layer-2 ecosystems via “bridges'' between these networks and this may have been a contributing factor. Moreover, DAI is often used in many Ethereum-based DeFi protocols as a source of collateral or liquidity and might have moved more frequently as volatility picked up in the crypto markets. MakerDAO recently handled its largest liquidation event on record as ETH price slumped on January 21st.
Source: Coin Metrics’ Formula Builder
Analyzing statistics on typical stablecoin transfer sizes can help shed light on how different stablecoins are being used. The chart below shows the average stablecoin transfer size (in USD) per day, using a 90-day moving average and log scale.
Source: Coin Metrics’ Formula Builder
The top two stablecoins that generally have the largest transfer sizes are BUSD and HUSD, issued by the exchanges Binance and Huobi. The average transfer of BUSD was ~$417K over the last 90 days while the average transfer of HUSD was even larger at $725K. One of stablecoins primary use cases to date has been to facilitate trading; providing refuge in times of market volatility and “dry powder” to deploy when the opportunity arises. This aligns with the data above as the use case of exchange-issued stablecoins is likely to primarily be for trading purposes.
On the bottom end of the chart is Tether on Tron where the average transfer size is about $8K. There is some evidence that Tether has been especially popular in high-inflation countries like Turkey as a means of accessing and transacting in dollar-backed assets more easily. Given the high fees on Ethereum, micro-transfers of under $100 are largely impractical, so this activity tends to filter to lower-fee blockchains like Tron.
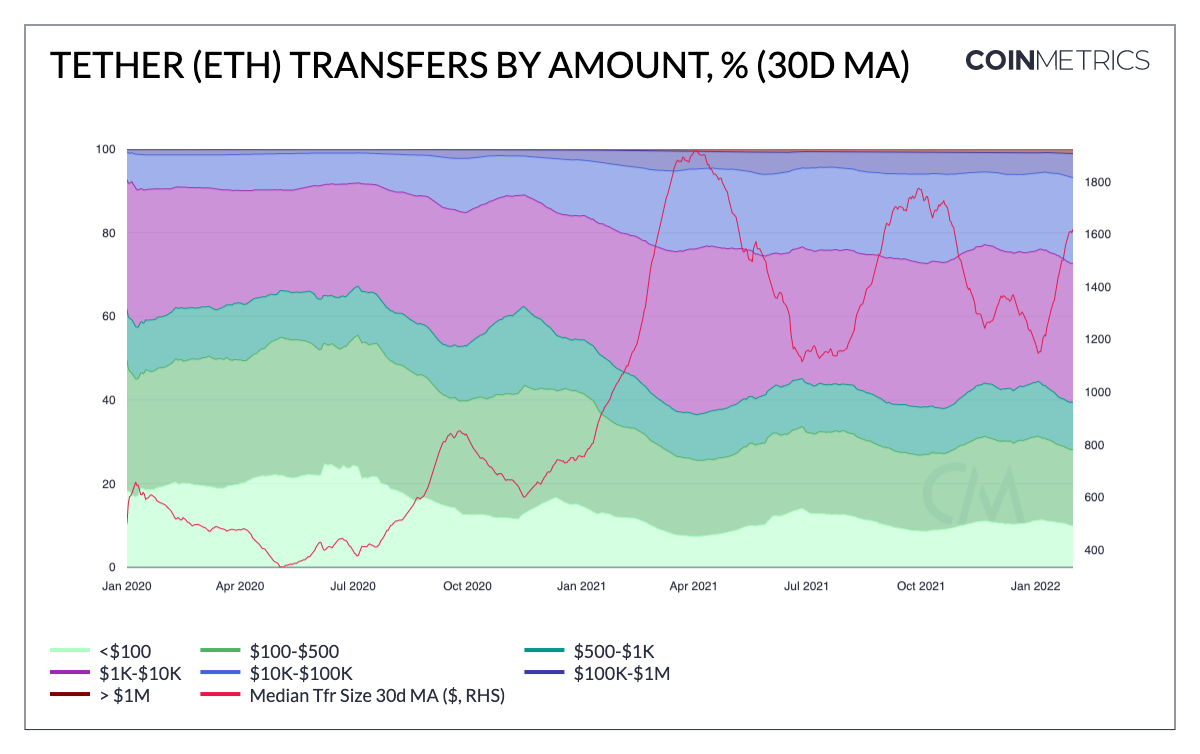
The charts below show this dichotomy between Tether issued on Ethereum and Tron by grouping transfers into buckets of different size intervals (using ‘retail’ and ‘whale’ payment metrics released in Coin Metrics’ Network Data Pro 5.0 and 5.1). For Tether on Tron, the median transfer is about $250, while over 30% of transfers are less than $100.
Source: Coin Metrics’ Formula Builder
Looking at Tether on Ethereum, smaller transfers make up a much smaller proportion. The median transfer size is about $1.6K and less than 10% of transfers are under $100. Most transfers are in the $1K-$10K range. About 1% of transfers are over $1M in size.
Source: Coin Metrics’ Formula Builder
It is difficult to tell directly from on-chain data what the purpose is of any given transfer. However, on-chain data can be very informative for analyzing general trends in adoption and use. Last year showed that there is high demand for dollar-backed tokens issued on public blockchains. As their influence in the crypto ecosystem — as well as the broader financial markets — grows, stablecoins are increasingly being the subject of new research.
To follow the data used in this piece and explore our other on-chain metrics check out our free charting tool, formula builder, correlation tool, and mobile apps.
Network Data Insights
Summary Metrics
Source: Coin Metrics Network Data Pro
The crypto markets continued to trudge through volatility in global markets last week. Activity on-chain decreased slightly with BTC and ETH active addresses falling 5.5% and 3%, respectively. Bitcoin mining difficulty, a network parameter that programmatically adjusts roughly every two weeks to target a 10-minute block time, hit a new all-time high last week. This comes as Bitcoin’s hash rate continues to increase and hit new all-time highs.
Network Highlights
Activity within the Tezos ecosystem is picking up as NFT activity on the network continues to grow. The chart below shows the daily number of transactions on Tezos broken down into transactions involving smart contracts (in red) and all other transactions (in green).
Source: Coin Metrics’ Formula Builder
Daily transactions jumped in Aug. 2021 as Tezos launched an upgrade cutting average block times in half. Transactions involving smart contracts have picked up as NFT platforms like the generative art platform FX Hash have started to see increased interest. Last December, French video game developer Ubisoft also announced support for gaming NFTs that would be built with Tezos.
Also charted on the right hand side is the number of addresses holding at least 1 XTZ, which recently surpassed 300K, rising from 120K at this time last year.
Active addresses on the network have ticked up as well. On the right hand side of the chart, the number of active smart contract addresses (a metric introduced in NDP 5.1) has been steadily increasing, likely as a result of new NFT contracts launching.
Source: Coin Metrics’ Formula Builder
Coin Metrics Updates
This week’s updates from the Coin Metrics team:
Check out our market-data focused newsletter State of the Market, featuring weekly updates on market conditions.
Last week we announced significant upgrades to the Coin Metrics Python API client.
Also check out the Coin Metrics mobile app. View real-time cryptoasset pricing and relevant on-chain data in a single app! Download for free here: https://coinmetrics.io/mobile-app/
As always, if you have any feedback or requests please let us know here.
Subscribe and Past Issues
Coin Metrics’ State of the Network, is an unbiased, weekly view of the crypto market informed by our own network (on-chain) and market data.
If you'd like to get State of the Network in your inbox, please subscribe here. You can see previous issues of State of the Network here.
Check out the Coin Metrics Blog for more in depth research and analysis.
© 2022 Coin Metrics Inc. All rights reserved. Redistribution is not permitted without consent. This newsletter does not constitute investment advice and is for informational purposes only and you should not make an investment decision on the basis of this information. The newsletter is provided “as is” and Coin Metrics will not be liable for any loss or damage resulting from information obtained from the newsletter.


