Get the best data-driven crypto insights and analysis every week:
Halfway to the Next Halving: The State of Bitcoin in 8 Charts
By Kyle Waters and Nate Maddrey
Bitcoin is approaching the halfway point to yet another milestone for the protocol, the 4th halving event – the 4th protocol designed 50% reduction in block rewards that occurs every 210,000 blocks (roughly 4 years). The predetermined halving schedule allows anyone to make confident estimates of future supply. And as expected on April 1st, the 19 millionth bitcoin (BTC) was mined, leaving only 2M BTC left to be issued. But outside of Bitcoin’s predictable supply mechanics, the situation is far more fluid. In this week’s State of the Network, we check in on some important Bitcoin metrics across the dimensions of network economics, security, adoption, market mechanics, and the quickly evolving technology stack.
Supply Economics
Source: Coin Metrics Network Data
The chart above shows the current state of Bitcoin’s supply mechanics. In the third halving epoch, Bitcoin blocks currently feature a reward of 6.25 BTC per block. With 144 blocks per day on average, about 900 BTC is currently being issued and rewarded to Bitcoin miners daily. Bitcoin will undergo its 4th scheduled halving at block 840,000 (est. May 4, 2024), where the per block reward will drop to 3.125 BTC, or ~450 BTC issued per day. Halvings are the core feature of Bitcoin’s programmatic monetary policy. Their potential impact is a frequent subject of discussion.
Network Value
Source: Coin Metrics’ Network Data Charts
Bitcoin’s realized market cap, one of Coin Metrics’ flagship metrics, stands at ~$465B today. Instead of multiplying each coin by today’s current price, realized cap uses the richness of the Bitcoin ledger to find the total value of all coins based on the price of BTC when each coin last moved.
Fee Market
Source: Coin Metrics’ Formula Builder
There are many different measures of Bitcoin transaction fees, but by most accounts, fees are near all-time lows. The chart above shows Bitcoin block space use and mean transaction fees in satoshis (1/10^8 BTC) per byte. The market for Bitcoin block space is dynamic and recent research from Galaxy Digital suggests that persistently low fees are a result of more efficient use of Bitcoin block space, rather than a decline in the economic use of the network.
Security
Source: Coin Metrics’ Formula Builder
Bitcoin’s hash rate continues to push higher after recovering from China’s sudden crackdown on mining last year. Hash rate, on a 30-day moving average, is just above 200 EH/s.
Usage Patterns
The chart above shows the breakdown of Bitcoin activity (changes in address balances) by time of day, smoothed with a 3-month moving average. Bitcoin activity is increasingly concentrated during western / US business hours. This is likely in part driven by China’s crypto crackdown, which caused a large sell-off amongst Chinese crypto holders and drove many miners out of the country.
Adoption
Source: Coin Metrics’ Network Data Charts
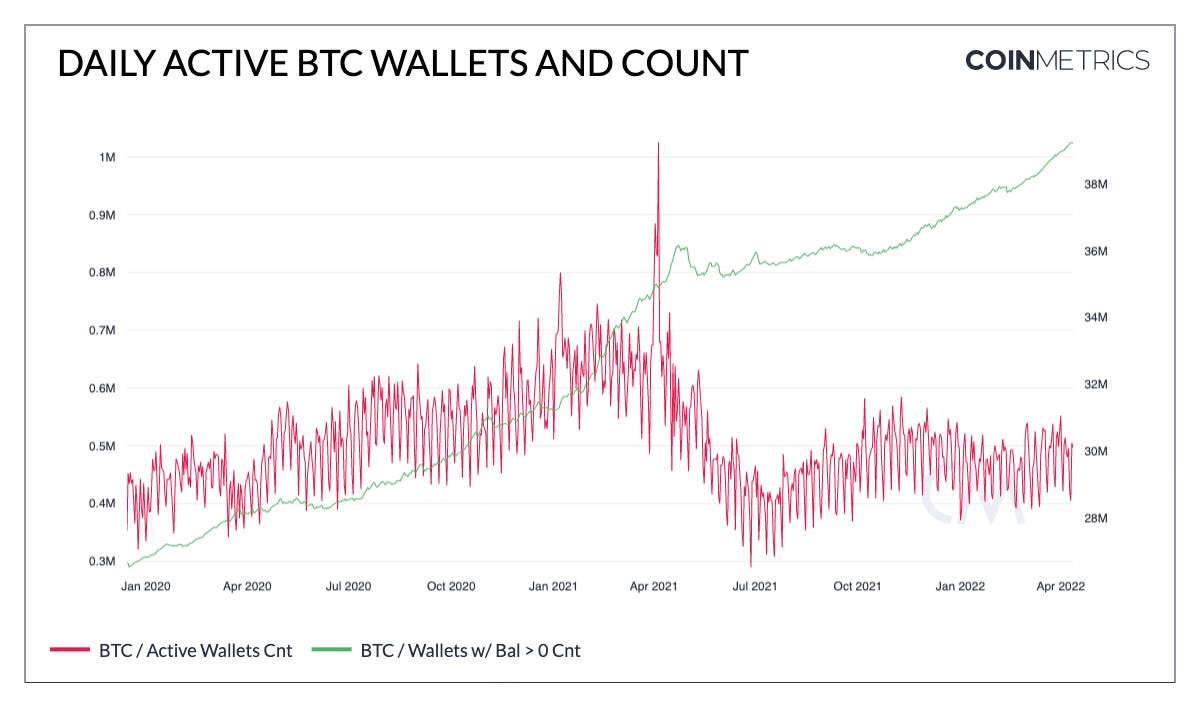
The number of daily active BTC wallets (wallets are groups of addresses that we link together through blockchain data analysis) has averaged about 500K per day, holding steady since last fall. The total number of wallets has accelerated recently, closing in on 40M.
Market Data
Source: Coin Metrics’ Network Data Charts
Daily BTC spot volume (in $, LHS) across Coin Metrics’ trusted exchanges has trended slightly lower in 2022. Reported futures open interest (RHS) stands at about $18.5B, roughly where it was at the beginning of 2022.
Technology Stack
After a breakout 2021, the amount of BTC in public lightning network channels has continued to push higher in 2022 to 3.7K BTC, albeit at a slightly lower pace. But the Bitcoin technology stack is quickly evolving. Coin Metrics’ Lucas Nuzzi presented at Bitcoin 2022 in Miami on the most exciting innovations in the Bitcoin technology stack and introduced bitcoin_ekosys, an open source map of the Bitcoin protocol ecosystem.
Network Data Insights
Summary Metrics
Source: Coin Metrics Network Data Pro
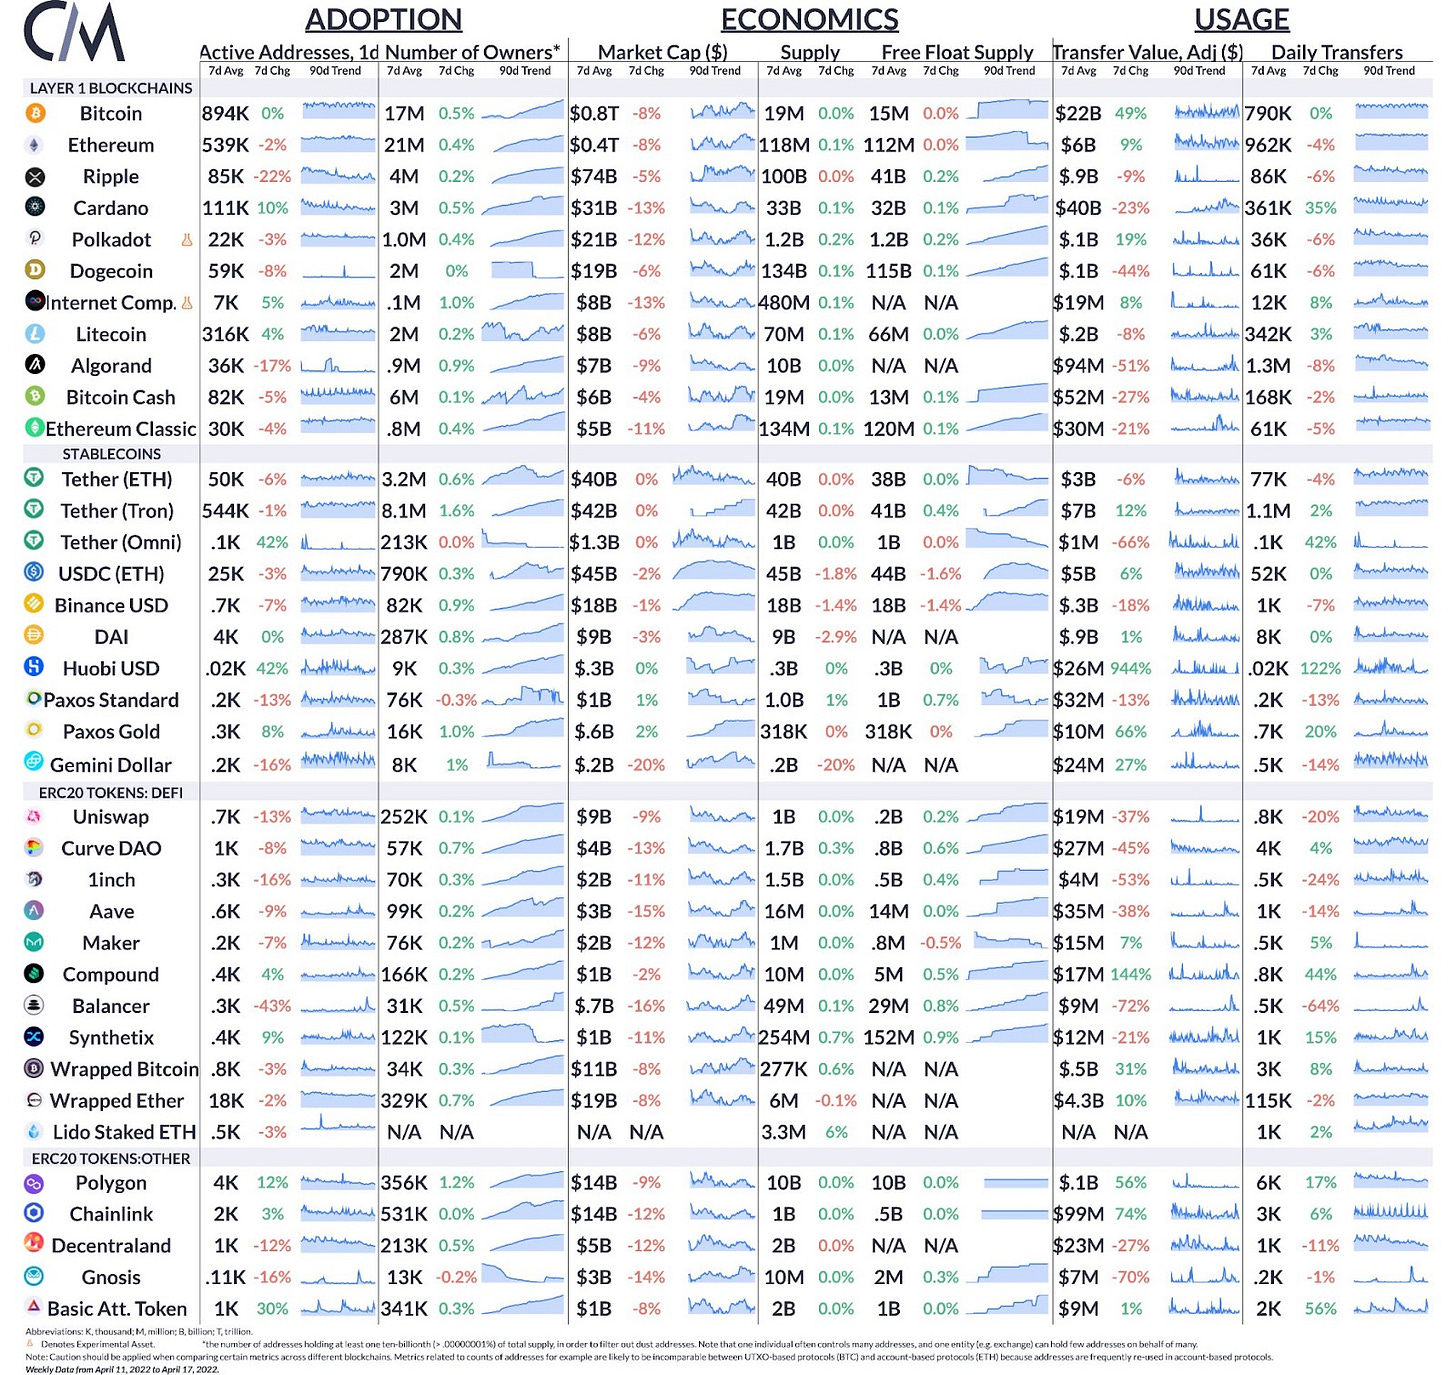
BTC and ETH, as well as most other major crypto assets, moved mostly flat or lower over the week. Adding all of the major L1s tracked above, about $70B was transferred on-chain per day on average in the last week. BTC transfer value averaged $22B per day, 49% higher on a week-over-week basis. Breaking the steady upward trend, total stablecoin supply across Tether, USDC, DAI, and BUSD has fallen slightly from a high of 156B on March 23, to 153B today.
Network Highlights
The charts below show the distribution of Ethereum’s block-level base fee by month. The base fee was introduced in August of last year with the launch of EIP-1559, which brought an overhaul of the fee market on the network. The base fee is a protocol-determined fee which all users must pay to have their transaction included in that block. Base fees can only go up or down a max 12.5% from one block to the next, and thus can help show prolonged periods of demand for block space.
The distribution (presented in GWEI or 1/10^9 ETH) has narrowed and shifted to the left in recent months as congestion on Ethereum has abated somewhat.
Source: Coin Metrics Network Data Pro
Coin Metrics Updates
This week’s updates from the Coin Metrics team:
For the best in-depth discussion of CM data and research, come check out our research community on the web3 social media platform gm.xyz.
Check out Coin Metrics’ market-data focused newsletter State of the Market.
As always, if you have any feedback or requests please let us know here.
Subscribe and Past Issues
Coin Metrics’ State of the Network, is an unbiased, weekly view of the crypto market informed by our own network (on-chain) and market data.
If you'd like to get State of the Network in your inbox, please subscribe here. You can see previous issues of State of the Network here.
© 2022 Coin Metrics Inc. All rights reserved. Redistribution is not permitted without consent. This newsletter does not constitute investment advice and is for informational purposes only and you should not make an investment decision on the basis of this information. The newsletter is provided “as is” and Coin Metrics will not be liable for any loss or damage resulting from information obtained from the newsletter.


