Coin Metrics' State of the Network: Issue 156
Tuesday, May 24th, 2022
Get the best data-driven crypto insights and analysis every week:
Ethereum’s Token Shakeout
By Kyle Waters and Nate Maddrey
Ethereum’s 2014 whitepaper imagined many different future applications for the smart contract platform. But the very first application discussed in the paper has arguably turned out to be the most prominent of all today: token systems. Broadly speaking, tokens are sub-currencies built on top of Ethereum that represent a utility or asset. Token account balances are enforced via smart contracts on Ethereum.
The concept of crypto tokens actually pre-dates Ethereum itself (e.g. colored coins) and there is already a long history of tokens on Ethereum. But the evolution of tokens on Ethereum is rapidly ongoing. In this week’s State of the Network, we examine some of the most important high-level data trends involving tokens on Ethereum.
ERC-20 vs. ERC-721
There are two main types of tokens on Ethereum today: fungible (i.e. identically alike in type and value) and non-fungible (unique) tokens – NFTs. For convenience and interoperability, smart contract developers have long rallied around token standards that specify a basic set of functions and rules for token implementations. The two most well-known are ERC-20 and ERC-721. ERC-20 refers to a standard for fungible tokens while ERC-721 specifies a standard for NFTs.
Aside from a few isolated periods like the 2017 CryptoKitties mania, ERC-20 tokens have been the most active token type in Ethereum’s history. That started to change during last year’s rise of NFTs when ‘non-fungible’ went mainstream. But only recently has the data started to show a flip of ERC-721 and ERC-20 tokens in some areas.
The chart below shows the total number of transfer events of ERC-20 tokens and ERC-721 tokens per day. For example, a transfer of 100 USDC (an ERC-20 token) from 0xabc.. to 0x123.. would count as one transfer. Likewise, a sale of one CryptoPunk on OpenSea would trigger a transfer of ownership.
The number of ERC-721 transfers hit its highest level since 2019 (only beaten by the 2019 God’s Unchained trading card game release) this past Sunday on May 22, 2022 at 660K.
Source: Coin Metrics Formula Builder (Methodology: TxTfrERC20Cnt & TxTfrERC721Cnt)
While this an interesting data point, it’s not an entirely fair comparison because many ERC-20 tokens can be transferred in a single event while each ERC-721 transfer only includes that unique token. Many ERC-20 transfers are initiated by swaps on decentralized exchanges such as Uniswap, where small-value transfers are usually impractical. A better comparison would be on-chain transfer volume, but this is difficult to calculate across heterogenous NFTs.
Another way to gauge activity by token type is by counting the number of transactions involving each type (a single transaction can include multiple transfers so this metric will differ from the data above). By this measure, ERC-20s are still far ahead, but ERC-721 activity is catching up.
Source: Coin Metrics Formula Builder (Methodology: TxERC20Cnt & TxERC721Cnt)
Both ERC-20 and ERC-721 tokens play an important role within Ethereum today, and often complement each other with ERC-20s being used as payment for NFTs. Other synergies exist in protocols like Uniswap V3 which uses ERC-721 tokens to represent unique liquidity positions within ERC-20 trading pools. This interplay is likely to continue with the introduction of OpenSea’s Seaport protocol, allowing for exchanges of arbitrary bundles of NFTs and fungible tokens.
Stablecoin Shifts
Today, the total value of USD-backed stablecoins on Ethereum (which are ERC-20 tokens) is at least $108B. This is compared to $86B worth of major ERC-20 tokens ($69B DeFi and $17B other major ERC-20s, excluding the long tail of assets). The market cap of ether (ETH) itself stands at $240B today. The chart below shows the market cap of these groups over time.
Source: Coin Metrics Formula Builder DeFi ERC-20 tokens: 1INCH, AAVE, LEND, BAL, COMP, UNI, YFI, ZRX, SNX, SUSHI, MKR, CRV, UMA, PERP. Other major ERC-20s: BAT, CRO, FTT, GNO, HT, LINK, LPT, MANA, OMG, POWR, QNT, WBTC, WETH.
After the latest swings in the crypto market, the token value of stablecoins to the network value of ETH is the highest it’s ever been. The ratio of stablecoin market cap to DeFi tokens’ market cap is also the highest it has been since the beginning of 2020’s ”DeFi Summer” with stablecoins’ market cap ~7x that of the major DeFi tokens tracked above. Just last year DeFi tokens had a total market value of $100B, double that of stablecoins’ $50B.
Stablecoins have come under increased scrutiny recently in the wake of the algorithmic stablecoin TerraUSD’s collapse. The stablecoin landscape on Ethereum is in flux, with USDC’s market share at its highest level since 2019 when Tether was just starting to launch on Ethereum and stablecoins only totaled a couple billion dollars in total value (note: Tether is still the larger stablecoin when taking into account USDT issued on other blockchains like Tron).
Source: Coin Metrics Formula Builder
Tether’s free float supply on Ethereum has fallen from a high of $39B in January to $34.5B today after a wave of redemptions. It is important to look at Coin Metrics’ free float supply to better understand USDT supply dynamics as redeemed USDT are held in Tether’s treasury address. Free float supply removes this portion of supply in addition to any USDT permanently destroyed or burned.
There has been particularly high churn among the largest addresses holding USDT and USDC. On May 12th, the number of addresses on Ethereum holding at least $1M of USDC surpassed the number of addresses holding at least $1M of USDT. This likely reflects the fact that only large holders are generally privileged to redeem USDT and mint new USDC (capturing any arbitrage in the process).
Source: Coin Metrics Formula Builder
But it might also be the case that some large accounts are de-risking their holdings, turning to the perceived assurances of USDC’s monthly attestations and full-reserve backing.
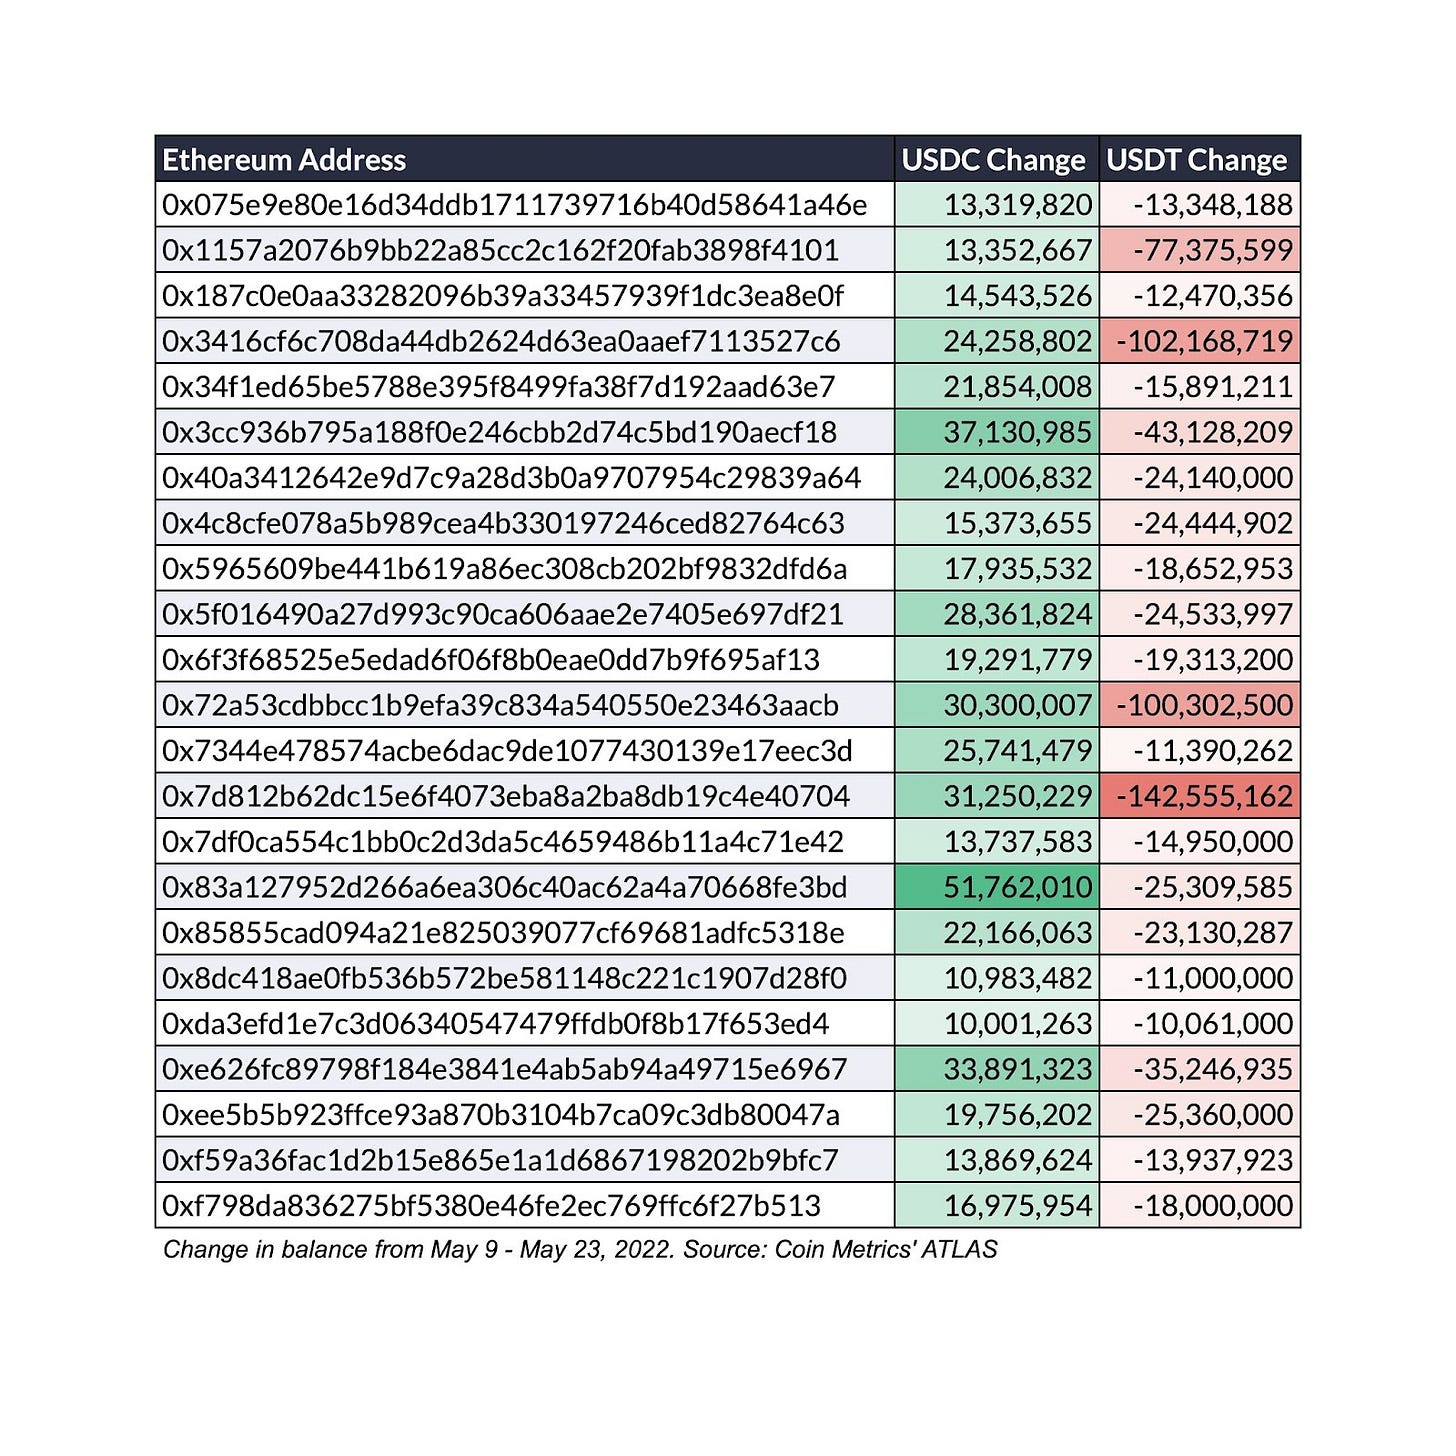
Using data from Coin Metrics’ ATLAS blockchain and account explorer API, we discovered that there were 147 Ethereum addresses that increased their USDC balance by at least $1M and decreased their USDT balance by at least $1M since May 9th. Of these addresses, there were 23 that added at least $10M of USDC and shedded $10M of USDT. These addresses (many of which are exchanges or custodial services, as well as DeFi protocols) are presented in the table below.
As Ethereum adoption accelerates, tokens are becoming an increasingly important vector of analysis, rivaling the economic activity of the native network currency ETH itself.
To follow the data used in this piece and explore our other on-chain metrics check out our free charting tool, formula builder, and correlation tool.
Network Data Insights
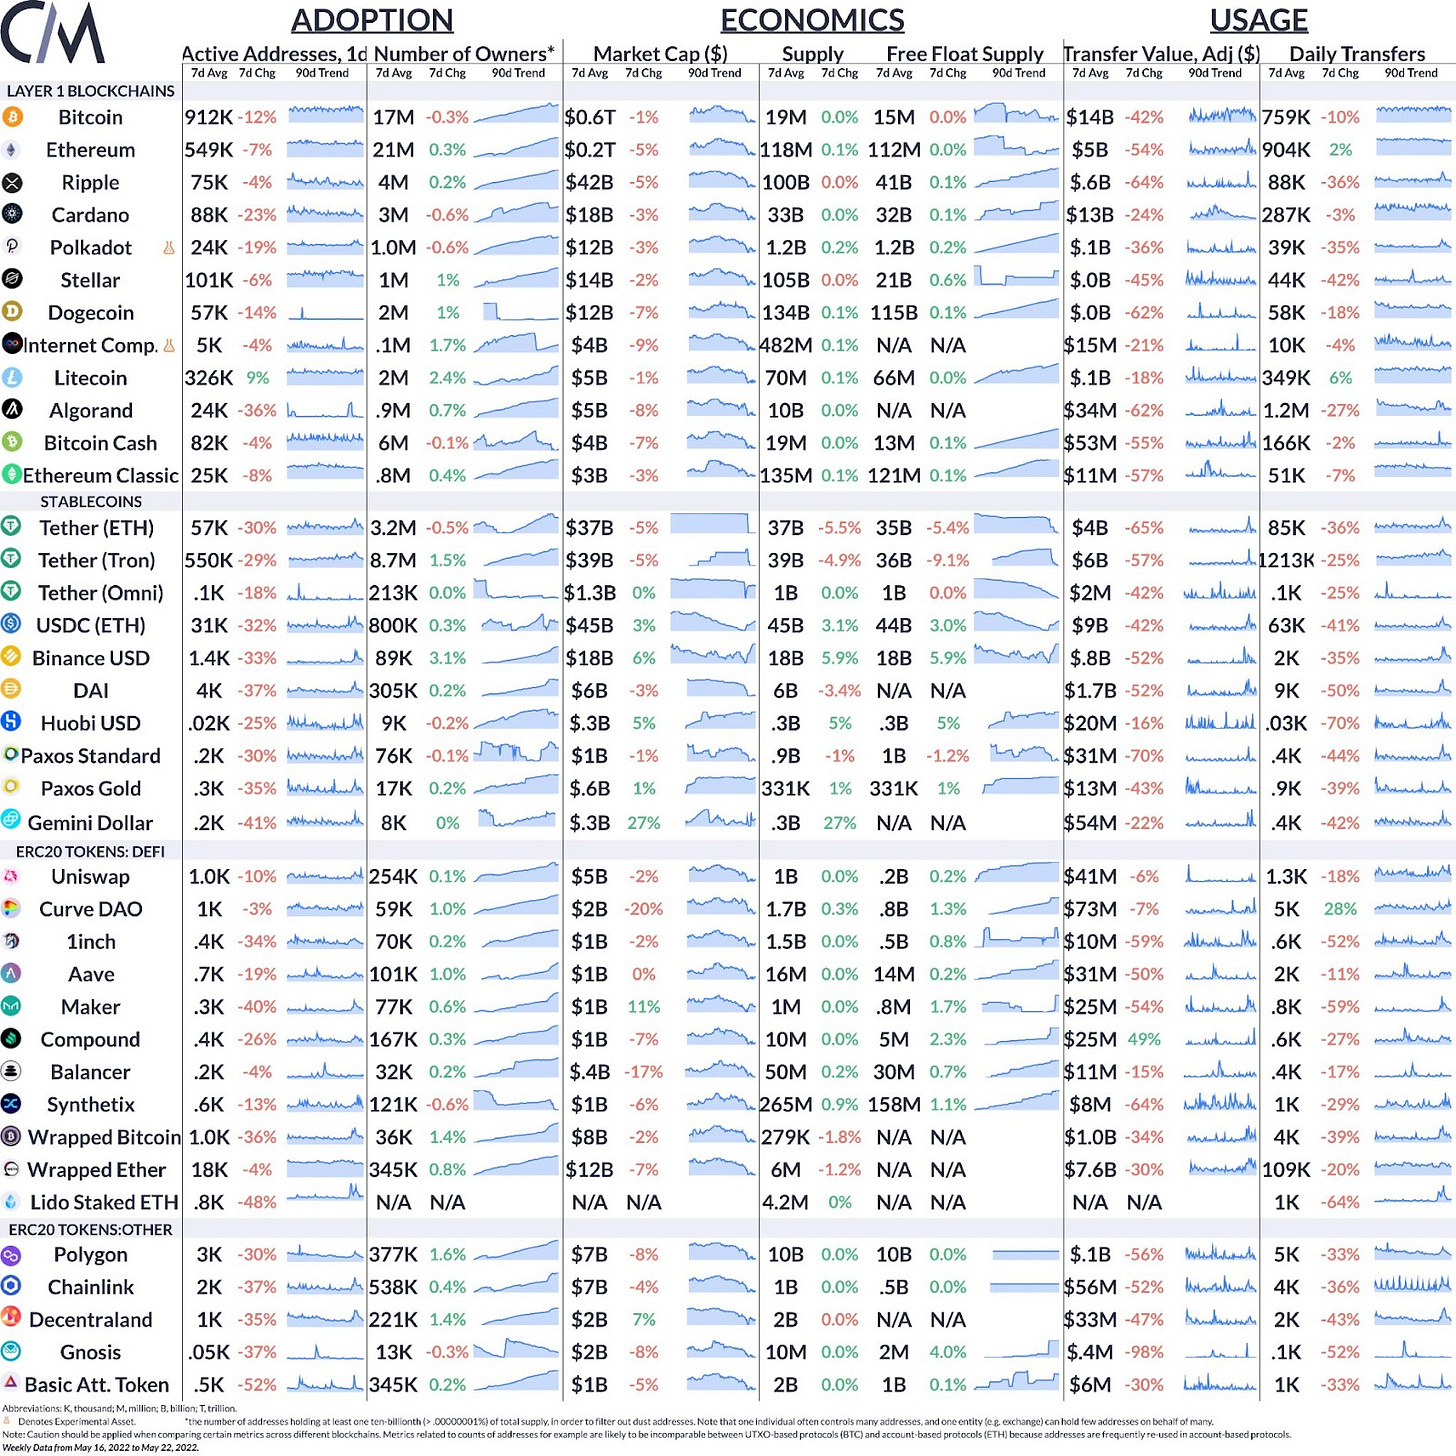
Summary Metrics
Source: Coin Metrics Network Data Pro
The relatively quieter crypto markets resulted in reduced on-chain activity on a week-over-week basis. Daily active BTC addresses averaged 912K over the last week, 12% lower compared to the week prior.
Network Highlights
May 22nd marked another Bitcoin Pizza Day, the 12th anniversary of the first real-world purchase using bitcoin - 10,000 BTC for two pizzas.
Coin Metrics Updates
This week’s updates from the Coin Metrics team:
For the best in-depth discussion of CM data and research, come check out our research community on the web3 social media platform gm.xyz.
Check out Coin Metrics’ market-data focused newsletter State of the Market.
Please note that State of the Network will be published on Wednesday, June 1st next week due to the U.S. Memorial Day holiday schedule.
As always, if you have any feedback or requests please let us know here.
Subscribe and Past Issues
Coin Metrics’ State of the Network, is an unbiased, weekly view of the crypto market informed by our own network (on-chain) and market data.
If you'd like to get State of the Network in your inbox, please subscribe here. You can see previous issues of State of the Network here.
Check out the Coin Metrics Blog for more in depth research and analysis.
© 2022 Coin Metrics Inc. All rights reserved. Redistribution is not permitted without consent. This newsletter does not constitute investment advice and is for informational purposes only and you should not make an investment decision on the basis of this information. The newsletter is provided “as is” and Coin Metrics will not be liable for any loss or damage resulting from information obtained from the newsletter.


