Get the best data-driven crypto insights and analysis every week:
State of the Network at Three Years Old
Celebrating Three Years Worth of Crypto Data Insights
By Kyle Waters and Nate Maddrey
State of the Network just turned three years old! Bitcoin, Ethereum, and the rest of the crypto ecosystem has grown a lot since our first issue.
In a special edition to celebrate 3 years of State of the Network we’ve put together a collection of crypto data insights highlighting just how much things have changed since we released our first issue on May 29th, 2019. These insights include a mix of on-chain data and crypto market data, all sourced from our in-house data products.
But first, we’re incredibly grateful for the more than 18,000 State of the Network readers today, some of whom have kindly shared their thoughts on SOTN with us.
Spencer Noon, Co-Founder of Variant and Creator of OurNetwork
“Congrats to SOTN on the 3-year anniversary! I’ve been a regular reader since the early days and have always appreciated your intense commitment to going as deep into the on-chain data as necessary in order to arrive at its fundamental truths. As a crypto community we are very lucky to have this caliber of research published for free and I would encourage anyone who calls themselves a data-driven investor to subscribe.”
TakensTheorem, Data Visualization Artist & Independent Crypto Researcher
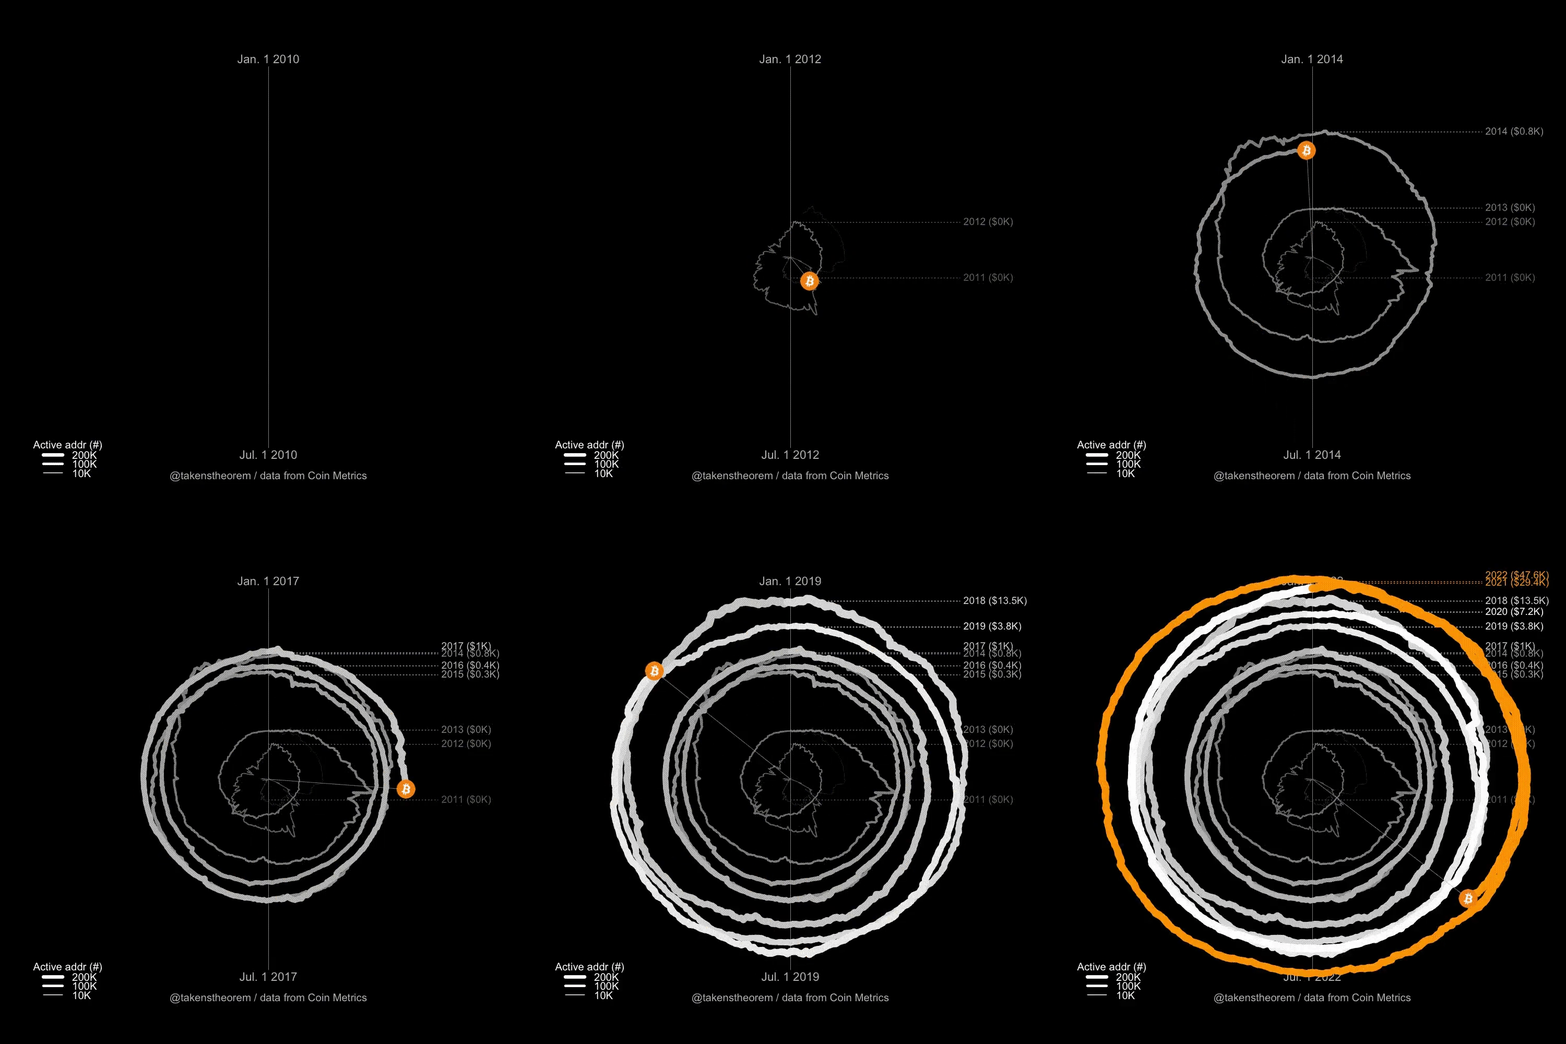
“SOTN synchronizes you to the market with crisp and clear graphs and numerics. Something I've noticed over the years: SOTN articles can also have amazing staying power. I find myself going back regularly to previously published articles for reminders of various market details, like stablecoin design features, history of crypto adoption or usage, and research that scores a blockchain's auditability (#30 from 2019 is epic!).”
Alex Mead, Technical Research Analyst at Coin Metrics
“I first discovered Coin Metrics’ State of the Network after hearing Nic Carter on the What Bitcoin Did podcast, episode 476. Nic shared many interesting thoughts about the US Dollar and its presence on the global stage. Digging deeper I found Coin Metrics and began to read back issues of the State of the Network. The publication captured my imagination to such a degree that I decided to apply for an open position on the Coin Metrics team. I have since joined Coin Metrics and continue to read the State of the Network weekly.”
David Hollerith, Reporter, Yahoo Finance
“State of the Network is a reasonable mix of market summary and data, no frills or promotions. A great way to get a quick pulse check on one of the fastest markets around.”
As the data below shows, the digital assets industry is ever-changing, and we look forward to continuing to highlight the most interesting data and trends in this emerging space.
To revisit some of our most popular past issues check out The Best of State of The Network in 2021, 2020, and some other classics here. And to explore some of the data used in this piece and our other on-chain metrics check out our free charting tool, formula builder, correlation tool, Python API client, and mobile apps.
$100 invested in bitcoin (BTC) on May 29, 2019, when State of the Network first launched, would be worth $367 today.
On May 29, 2019 the top 10 crypto assets (excluding stablecoins) by free float market cap were (in order):
Bitcoin (BTC) $121.6B
Ripple (XRP) $34.0B
Ethereum (ETH) $28.0B
EOS $8.0B
Litecoin (LTC) $6.9B
Bitcoin Cash (BCH) $4.9B
Cardano (ADA) $2.4B
Stellar (XLM) $2.0B
Monero (XMR) $1.6B
Bitcoin SV (BSV) $1.5B
BTC’s current supply is 19.05M, on May 29, 2019 it was 17.73M.
There’s been over $8 trillion worth of BTC transferred on-chain over the last 3 years (adjusted to remove self-sends and other non-economic transfers).
To-date, BTC has settled a total of $10.3 trillion on an adjusted basis, in May 2019 that total was only $1.8T.
BTC’s realized market cap is $452B today, rising from $83B on 5/29/19.
The total number of BTC UTXOs is 82M today, rising from 56M in May 2019.
274K BTC are wrapped as ERC-20 tokens on Ethereum today, on May 29, 2019 that number was 258.
The reward for mining a single Bitcoin block today is 6.25 BTC, or ~$200K in dollar terms. On May 29th, 2019 it was 12.5 BTC, worth about $108K at the time.
Total BTC miner revenue was $5.2B in 2019, $5B in 2020, and $16.7B in 2021. All-time BTC miner revenue is $43B today.
BTC’s annual inflation rate was 3.9% in 2019, and 1.8% in 2021.
BTC’s 30-day mean hash rate today is 218 EH/s (quintillion hashes per second), a 330% increase since SOTN launched in 2019.
BTC spot volume across Coin Metrics’ trusted exchanges averaged $2.9B per day in May 2019 and $8.2B in May 2022.
On May 29, 2019 the top 5 exchanges by BTC spot volume were:
Binance: $345M
Huobi: $246M
Coinbase $130M
Kraken: $99M
Bitfinex: $95M
On May 25, 2022 (also a Wednesday) the top 5 exchanges by BTC spot volume were:
Binance: $2.63B
FTX: $853M
Coinbase: $576M
Huobi: $512M
Kucoin: $483M
All-time BTC spot volume across Coin Metrics’ trusted exchanges is $8.8T to-date, $7.3T of that occurred in the last 3 years.
BTC daily active addresses averaged 815K in May 2019 and 940K in May 2022.
There are over 10M addresses that hold at least 0.01 BTC today, rising from 7.15M on 5/29/19, a growth of 2.85M addresses.
There are 2,216 BTC addresses holding at least 1K BTC (~$31M) today compared to 1,995 in May 2019.
There have been 733M BTC transactions to-date, with about 318M happening the last 3 years.
The average BTC transaction fee was $4 on May 29, 2019. It was $1.41 on May 29, 2022.
In May 2019, 62% of daily BTC transfers were above $10K in value, today 74% of daily BTC transfers are over $10K in value.
The average BTC transaction value was ~$10K on May 29, 2019. On May 25, 2022, it was $31K.
At least 1.6M BTC (8.3% of total supply) are held on exchanges today (excluding Coinbase and FTX), rising from 1.46M in May 2019.
Binance holds at least 590K BTC today, compared to 238K in May 2019. Binance controls the largest BTC address by total supply (
34xp4vRoCGJym3xR7yCVPFHoCNxv4Twseo) which controls ~253K BTC today, worth nearly $8B.An all-time high 3,958 BTC are currently held in public Lightning Network channels, rising from 1,034 BTC in May 2019.
There are 87.8K open public Lightning Network channels today, rising from 41K in May 2019.
The percentage of BTC transactions using Segregated Witness (SegWit) has risen from 40% in May 2019 to 83% today.
$100 invested in ether (ETH) on May 29, 2019, when State of the Network first launched, would be worth $723 today.
There are currently 645K smart contracts on Ethereum holding a positive balance of ETH, rising from 496K in May 2019.
On May 29, 2019, there were 1,196 ERC-721 (NFT) contracts deployed to Ethereum. Today there are 88.65K.
On May 29, 2019, 1.14% of ETH transactions involved ERC-721 contracts. On May 29, 2022, 18% of all transactions involved ERC-721 contracts.
There have been 1.58B total ETH transactions to-date, 645M of which have involved tokens. About 1.13B transactions have occurred since May 29th, 2019.
The current supply of ETH is 118.61M. It was 106.28M three years ago.
31M ETH are currently held in smart contracts or about 26% of total supply, up from 10.9M on May 29th, 2019.
On May 29, 2019 the average transaction fee on Ethereum was 19 cents. On May 25, 2022 it was $6.33.
A total of $14.3B has been spent on ETH transaction fees all-time - about $14.06B of total ETH transaction fees have been spent in the last three years.
2.38M ETH has been burnt since EIP-1559 was activated in August 2021 - a burning mechanism did not exist in 2019.
1.4M ETH addresses hold USDC today, rising from 30K on May 29, 2019.
The average number of transactions per Ethereum block was 144 on 5/29/19 and 177 on 5/25/22.
Stablecoin supply on Ethereum was ~$1.2B on May 29, 2019. Today it is at least $108B.
ETH spot volume across CM trusted exchanges was $700M on May 29, 2019 and $3B on May 25, 2022. All-time, $4.3T of ETH has been exchanged on CM trusted exchanges to-date.
$5.85T worth of ETH has been moved on-chain (on an adjusted basis) all-time, $5T of that was recorded since 5/29/19.
There were 347K active addresses on Ethereum on 5/29/19, there were 508K on 5/25/22.
There are 23M addresses holding at least 0.01 ETH today, on 5/29/19 there were 6M.
ETH miners’ revenue is $33.3B all-time to-date. On 5/29/19 it was $6B.
There have been 57K ETH transfers above $10M in value to-date, 54K of which occurred after 5/29/19.
The last day Ethereum was not the second-largest crypto asset by total dollar market cap was November 28, 2020 when XRP had a total market cap of $62.87B and ETH had a market cap of $61.45B.
On May 29, 2019 there were 20 unique crypto assets traded on Coinbase. On May 25, 2022 there were 167.
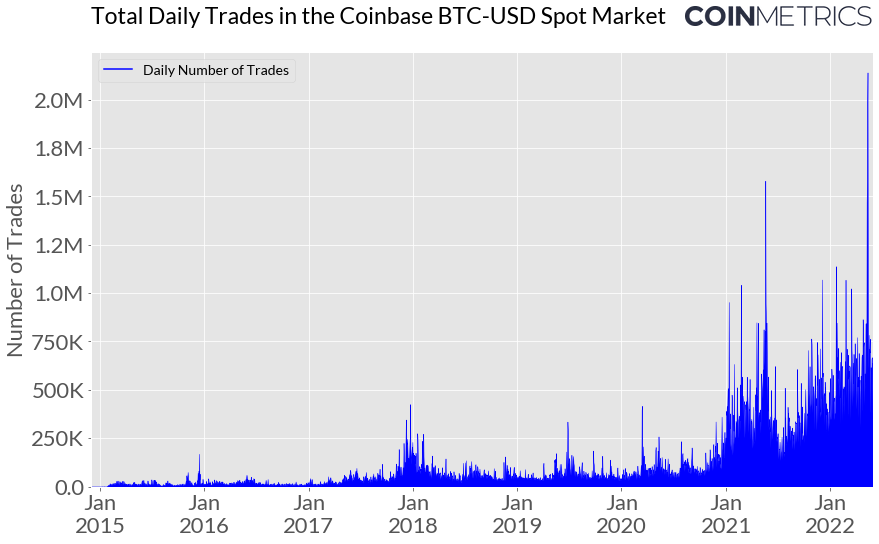
On May 29, 2019 there were 66,773 total trades in the BTC-USD spot market on Coinbase. On May 25, 2022, there were 503,784. On May 12, 2022 there were a record 2.1M trades in the BTC-USD market on Coinbase.
Source: Coin Metrics Market Data Feed
Network Data Insights
Summary Metrics
Source: Coin Metrics Network Data Pro
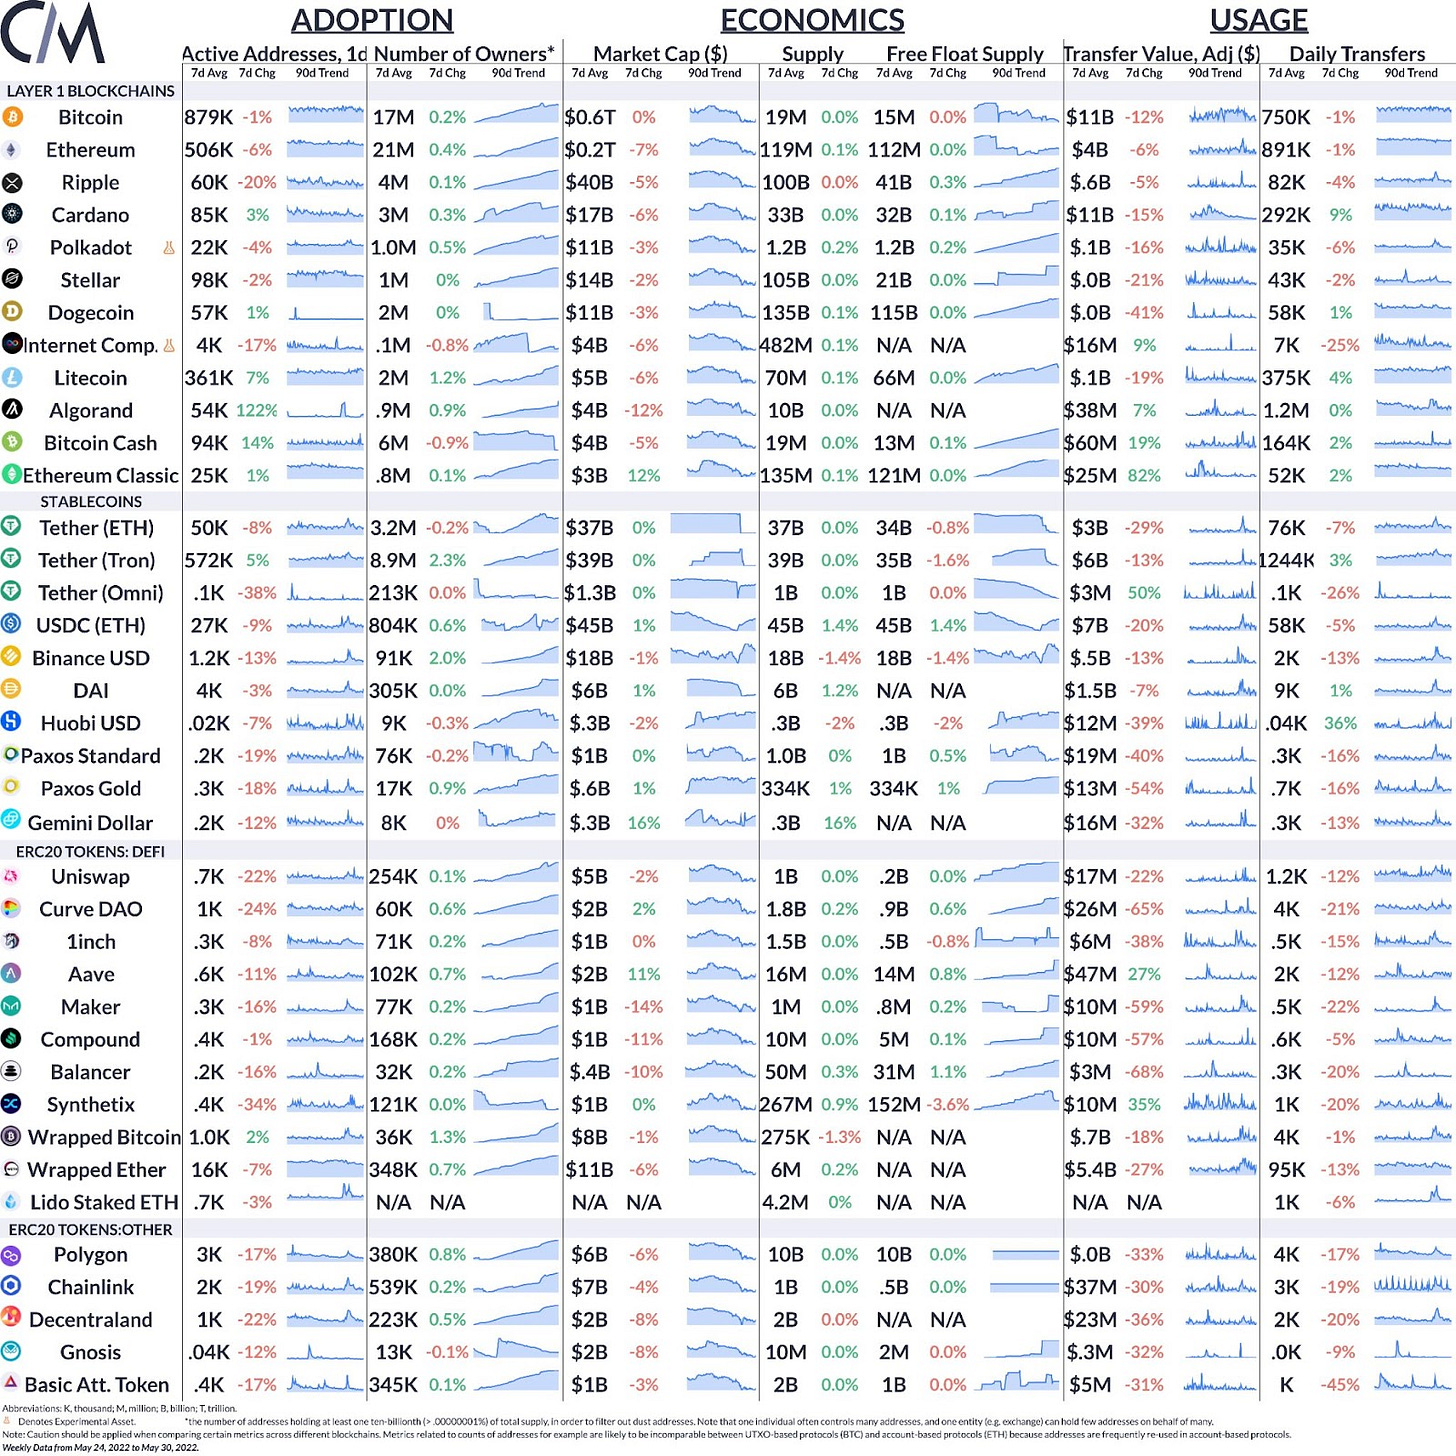
On-chain activity was relatively tepid week-over-week with average Bitcoin daily active addresses falling 1% to 879K and Ethereum active addresses falling 6% to 506K. The number of Ethereum addresses holding at least 1/10B (0.00000001%) of supply (about 0.01 ETH) crossed 21.5M while the number of Bitcoin addresses holding 1/10B of supply (~.002 BTC) held steady at around 17.3M (note that caution should be applied when comparing address counts of UTXO to account-based blockchains).
Coin Metrics Updates
This week’s updates from the Coin Metrics team:
For the best in-depth discussion of CM data and research, come check out our research community on the web3 social media platform gm.xyz.
Check out Coin Metrics’ market-data focused newsletter State of the Market.
As always, if you have any feedback or requests please let us know here.
Subscribe and Past Issues
Coin Metrics’ State of the Network, is an unbiased, weekly view of the crypto market informed by our own network (on-chain) and market data.
If you'd like to get State of the Network in your inbox, please subscribe here. You can see previous issues of State of the Network here.
Check out the Coin Metrics Blog for more in depth research and analysis.
© 2022 Coin Metrics Inc. All rights reserved. Redistribution is not permitted without consent. This newsletter does not constitute investment advice and is for informational purposes only and you should not make an investment decision on the basis of this information. The newsletter is provided “as is” and Coin Metrics will not be liable for any loss or damage resulting from information obtained from the newsletter.


