Coin Metrics' State of the Network: Issue 163
Tuesday, July 12th, 2022
Get the best data-driven crypto insights and analysis every week:
Checking in on On-Chain User Activity
By Nate Maddrey and Kyle Waters
Over the last few months the crypto market has been battered by Terra’s implosion and the ongoing fallout. But despite falling prices, how has usage and adoption held up? Have crypto users stuck around, or have they left during the downturn?
One way to gauge crypto usage is to look at the number of unique daily active addresses. An “active address” is defined as an address that either sends or receives a transaction during a specific period of time. It’s a similar concept to measuring a daily or monthly “active user” of a traditional website or app.
Active addresses are a good proxy for daily active usage but are far from perfect. An address does not necessarily represent an individual - many individuals own and operate multiple addresses - and a single address may also be operated by a group or collective. But that being said, looking at active addresses over time is still a relatively good method of gauging changes in on-chain usage trends.
Bitcoin (BTC) and Ethereum (ETH) active addresses have both dropped since the peak of the 2021 bull run. But BTC active addresses have actually held fairly steady throughout 2022.
The following chart shows BTC unique monthly active addresses on the left-hand axis, compared to BTC price on the right-hand axis. Monthly BTC active addresses peaked at a little over 22.1M on Jan. 16th, 2021. Monthly active addresses remained over 20M through the end of May 2021, and then underwent a big drop-off following the May 2021 price crash. Monthly active addresses have dropped off some in 2022, but not as precipitously as in May 2021.
Source: Coin Metrics Charting Tool
However, just looking at active addresses probably slightly overstates the amount of actual unique users. The following chart shows the number of daily active addresses (7d average) compared to the number of daily active wallets (7d average).
We define a “wallet” as a group of addresses that are likely owned by the same individual or entity. Due to BTC’s UTXO model, individual wallets are often composed of multiple addresses. Over the last year there have been an average of about twice as many daily active addresses as daily active wallets.
Source: Coin Metrics Charting Tool
ETH monthly unique active addresses topped at 13M on May 19th 2021 after ETH price surged to a new all-time high of over $4K. But following the May 2021 crypto crash, ETH monthly active addresses dropped below 8M and has not hit 10M since.
ETH active addresses rebounded in late 2021 and early 2022, reaching about 9M in late March of this year. But ETH monthly active addresses have since dropped as low as 6M, which is the lowest level since June 2020.
Source: Coin Metrics Charting Tool
ETH active addresses tend to be correlated with ERC-20 transactions. ERC-20 tokens are the most common type of token issued on Ethereum, and include most of the large DeFi tokens like Uniswap (UNI) and Aave (AAVE), as well as stablecoins like USDC and Tether (USDT). The number of daily ERC-20 transactions peaked in mid-May 2021 along with active addresses.
Source: Coin Metrics Charting Tool
ERC-721 transactions, on the other hand, tend to move in the opposite direction of ERC-20 transactions and active addresses. ERC-721 is the most common token standard used for NFTs.
ERC-721 transactions peaked in late September 2021, and again in February 2022. ERC-20 transactions hit local bottoms during both of those periods. This is likely because NFTs (especially popular NFT mints) have typically led to high gas prices, which can make it prohibitively expensive to use some DeFi applications and generally crowds out small transactions. ERC-721 transactions rose again in June 2022, mostly thanks to the rise in popularity of free NFT mints. Note that the following chart shows ERC-721 transactions on the right-hand axis - daily active addresses are still significantly higher than the number of ERC-721 transactions.
Source: Coin Metrics Charting Tool
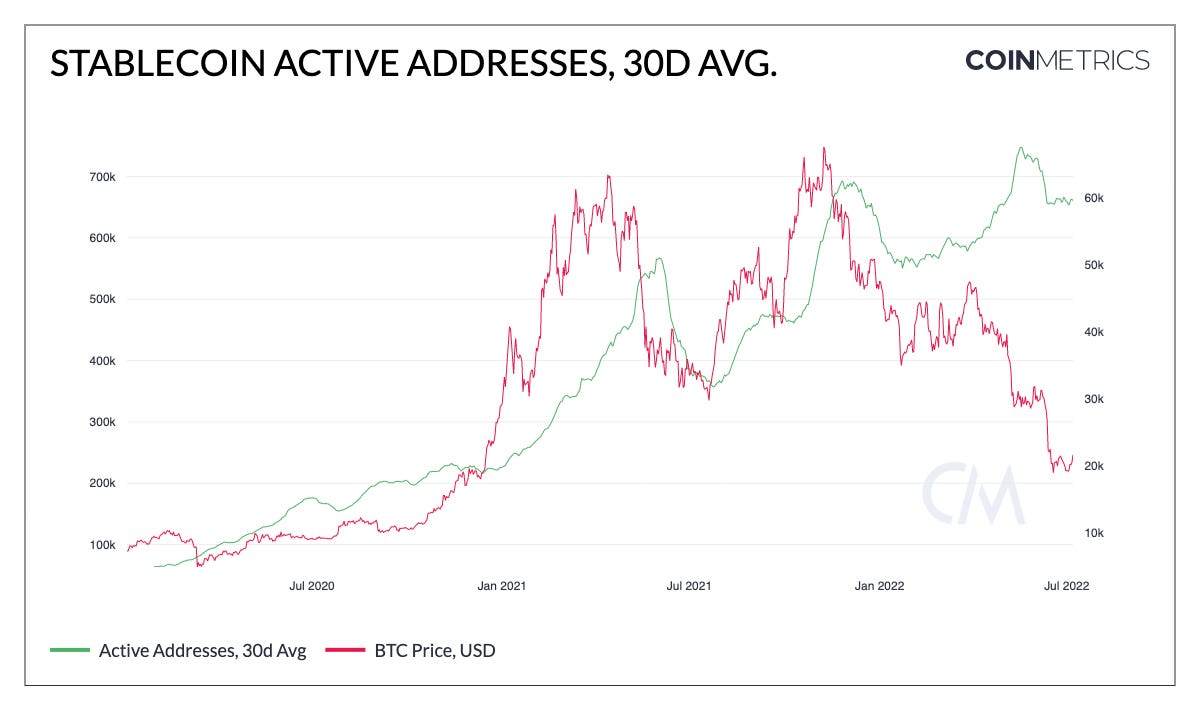
As might be expected, stablecoin active addresses hit a new all-time high in May 2022. Following the collapse of LUNA & UST and the subsequent crypto crash, many market participants started moving their crypto investments into stablecoins to escape falling prices. Stablecoin daily active addresses (30d average, LHS) peaked at over 748K on May 18th, and has remained at over 650K since then.
Source: Coin Metrics Formula Builder
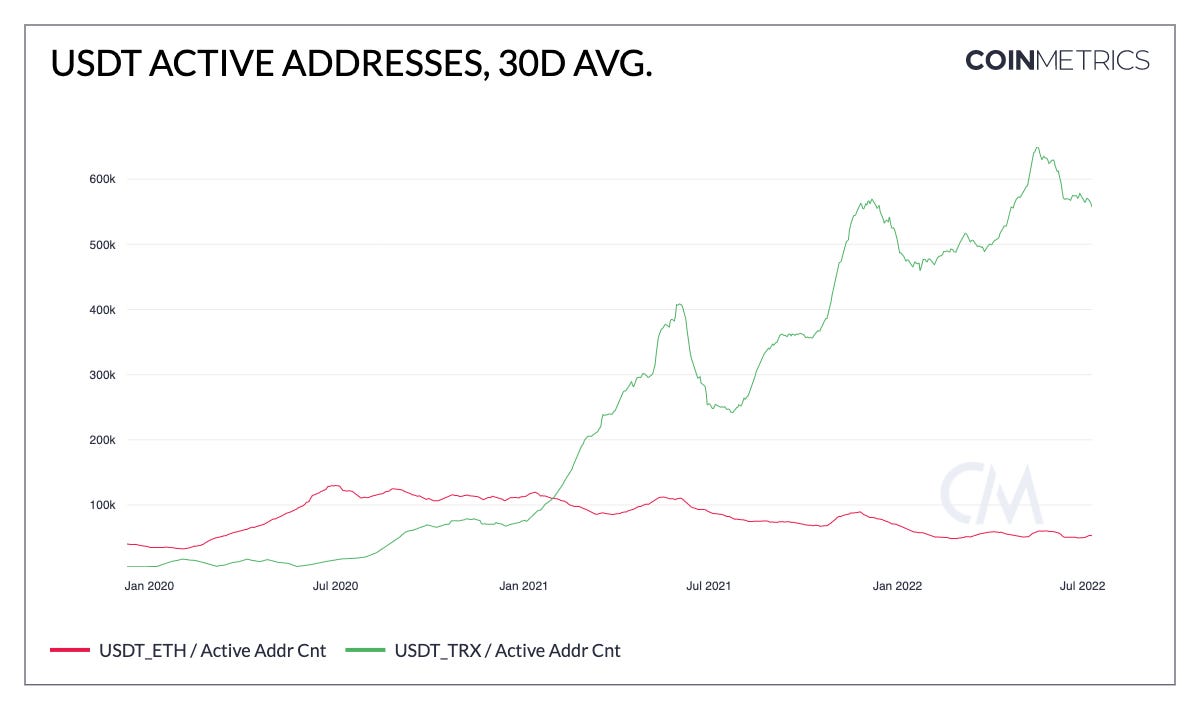
However, different stablecoins have shown different behaviors. A majority of the stablecoin active address growth came from Tether issued on Tron (USDT_TRX), while activity involving Tether issued on Ethereum (USDT_ETH) has actually dropped off in 2022.
Source: Coin Metrics Charting Tool
Meanwhile USDC daily active addresses surged in May 2022, reaching its highest levels since May 2021. Stablecoin activity will be an important metric to watch as the market continues to recover and stabilize after May’s crash.
To keep up to date on the data covered in this report and explore the rest of our metrics check out our free charting tool, formula builder, correlation tool, and mobile apps.
Network Data Insights
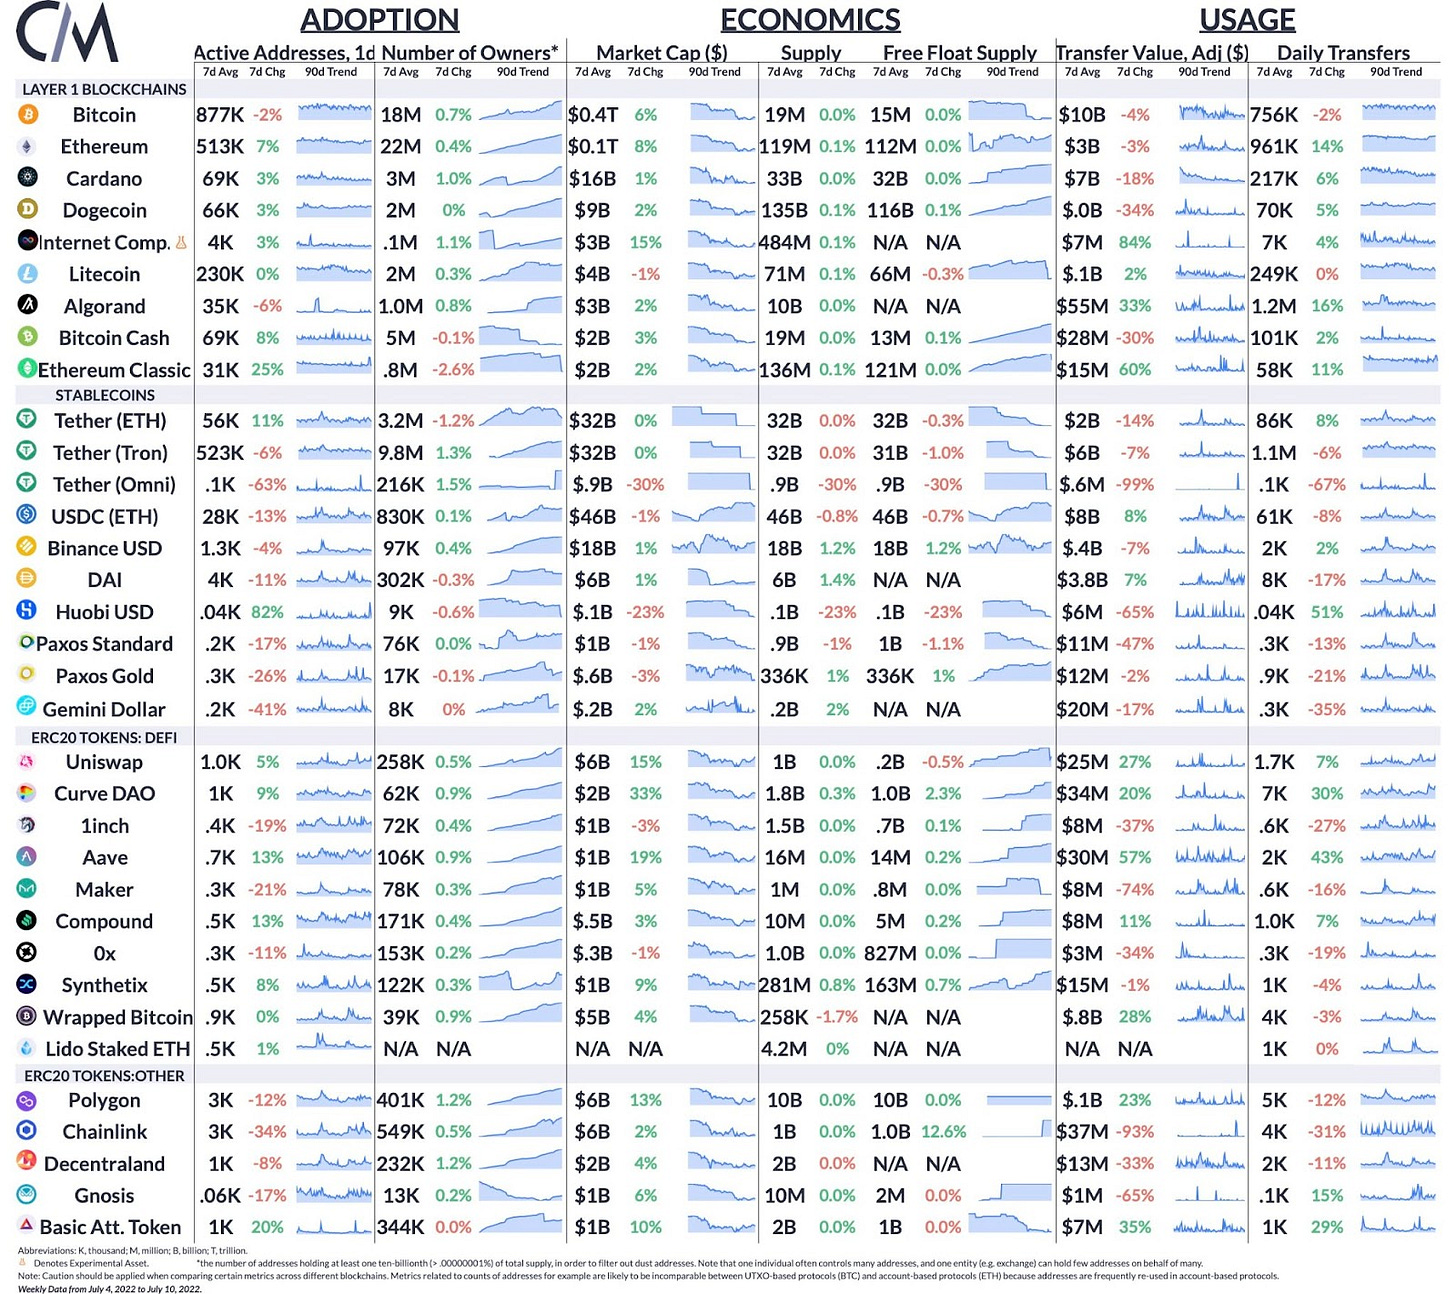
Summary Metrics
Source: Coin Metrics Network Data Pro
Bitcoin’s daily adjusted on-chain transfer volume averaged $10B last week, slightly down from the week prior. Despite BTC’s fall in price, on-chain volume is still well above levels from just two years ago when daily value settled was ~$1.8B. Ethereum’s daily adjusted on-chain transfer volume averaged $3B last week, slightly down from the week prior.
Network Highlights
On July 2nd Tether conducted a burn of 447M USDT tokens on Omni, lowering free float USDT supply on the Omni protocol to 888M, the lowest level since December 2017.
Omni is a platform for building tokens that settle on Bitcoin using OP_RETURN transactions that store arbitrary data rather than transferring BTC around.
Tether first issued USDT on Omni as laid out in the original Tether whitepaper. For the first four years of Tether’s existence, USDT on Omni was the main version of the stablecoin. But after launching on Ethereum, Tron, and other blockchains, the share of USDT on Omni fell substantially throughout 2019-2021, with the share of USDT on Omni now standing at less than 2% of total free float supply.
Source: Coin Metrics Network Data Charts
The reduction of USDT activity on Omni has been posited as one contributing factor for low transaction fees on Bitcoin.
Coin Metrics Updates
This week’s updates from the Coin Metrics team:
For the best in-depth discussion of CM data and research, come check out our research community c/coinmetrics on gm.xyz.
As always, if you have any feedback or requests please let us know here.
Subscribe and Past Issues
Coin Metrics’ State of the Network, is an unbiased, weekly view of the crypto market informed by our own network (on-chain) and market data.
If you'd like to get State of the Network in your inbox, please subscribe here. You can see previous issues of State of the Network here.
To learn more, acquire our data, or contact Coin Metrics reach out here.
© 2022 Coin Metrics Inc. All rights reserved. Redistribution is not permitted without consent. This newsletter does not constitute investment advice and is for informational purposes only and you should not make an investment decision on the basis of this information. The newsletter is provided “as is” and Coin Metrics will not be liable for any loss or damage resulting from information obtained from the newsletter.


