Get the best data-driven crypto insights and analysis every week:
Ethereum After EIP-1559
By Matías Andrade, Kyle Waters, and Nate Maddrey
As the upcoming merge with the Beacon Chain approaches, the upgrade to Ethereum’s fee market mechanism brought on by EIP-1559 has had nearly one full year to develop and for participants to habituate to the new conditions. In recognition of this first year, we take this opportunity to take a closer look at our Ethereum data to see how this important change has shaped Ethereum’s fee market.
EIP-1559 and the London Hard Fork
On August 5, 2021 at Ethereum block height 12,965,000 the Ethereum Improvement Proposal (EIP) EIP-1559 mechanism was activated via the London hard fork, which brought about new ways to set gas prices intended to help users avoid overpaying for their transactions and promise faster inclusion for lower-cost transactions. Ethereum gas is important because it allows miners to distribute their compute fairly among transactions, and prevents any malicious transaction from hoarding the network’s resources by setting a gas limit on every transaction signed. If you would like to find out more about Ethereum’s gas mechanism, check out our past research covering this very topic.
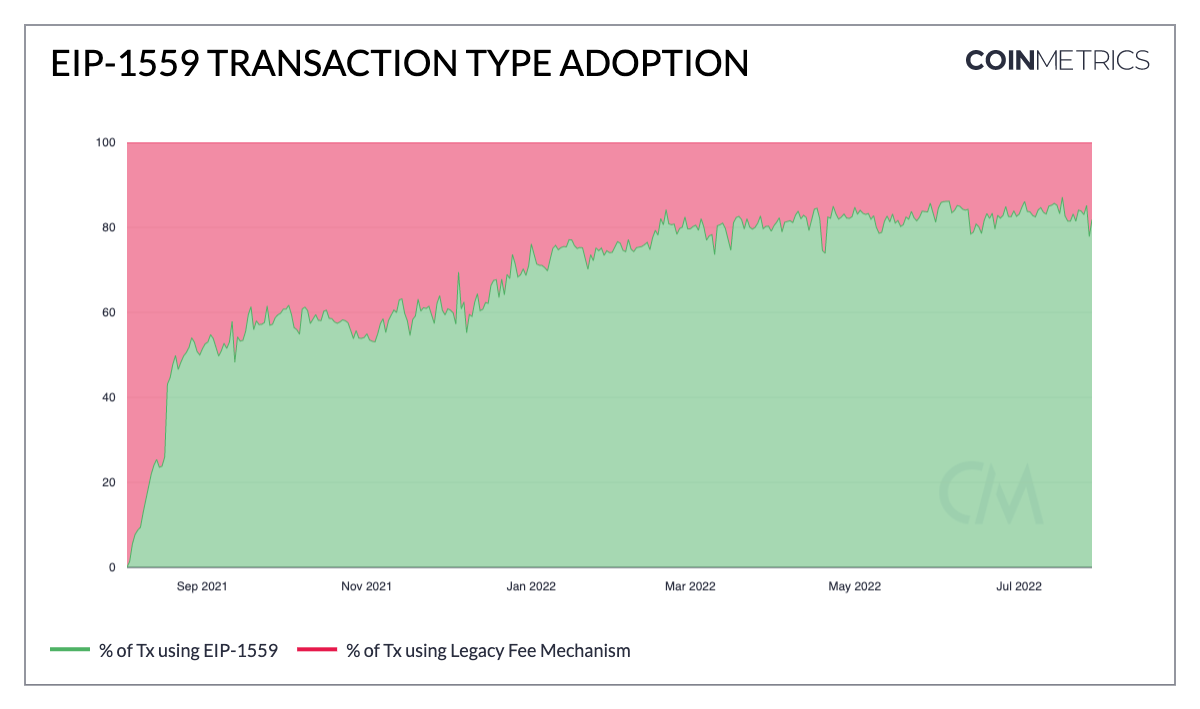
EIP-1559 introduced a new auction mechanism whereby users provide a price per unit of gas at least as high as the current protocol-determined base fee, which is burned, as well as specify a priority tip, which is paid to miners in compensation for timely inclusion in a block. As seen in the chart below, up to 80% of transactions are now consistent with the new EIP-1559 transaction type.
Source: Coin Metrics Formula Builder
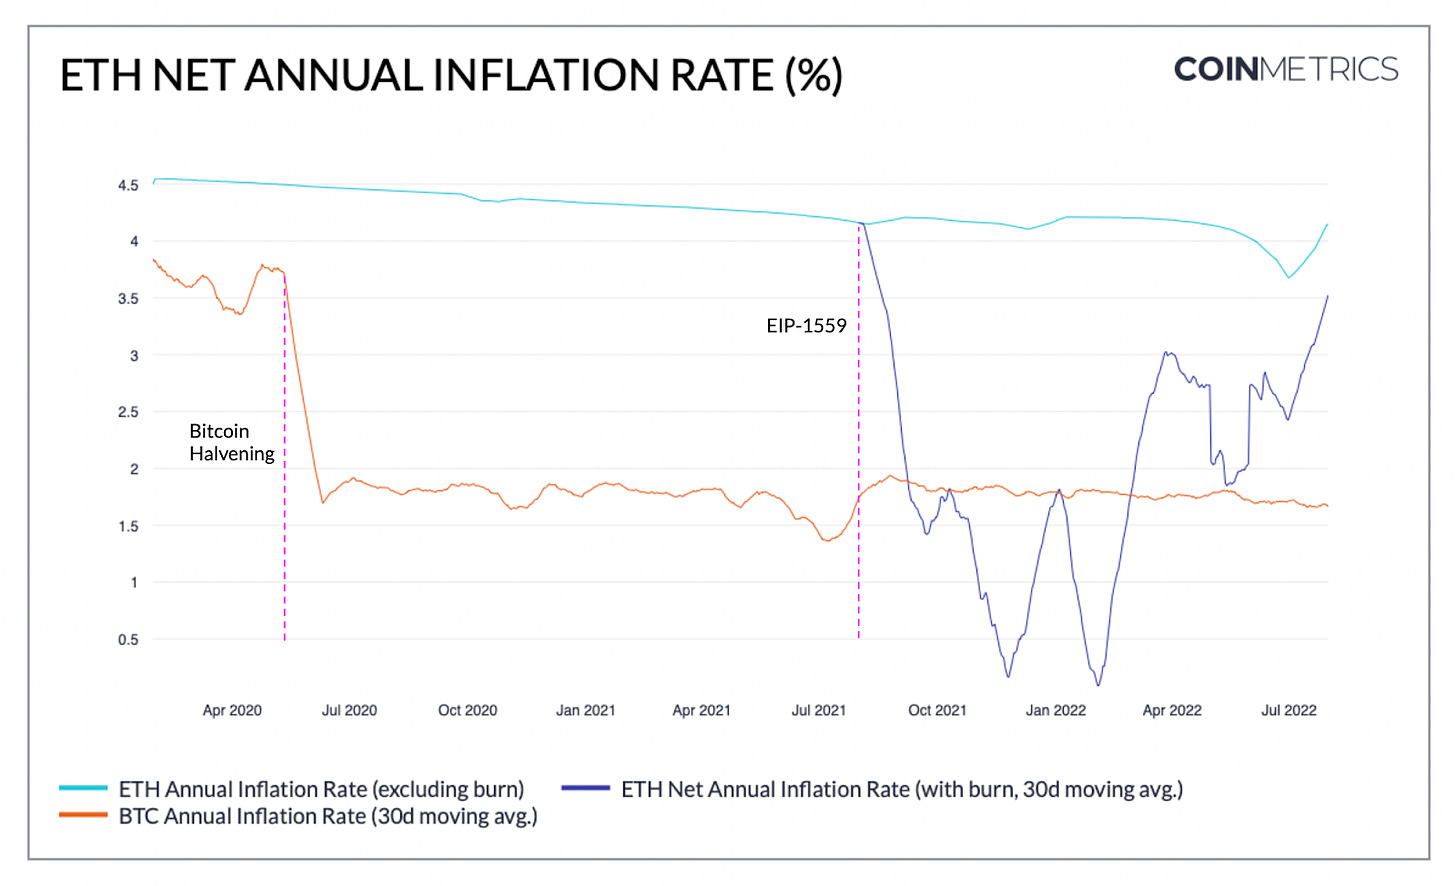
There are almost too many implications arising from this change to mention, but one of the most clear is that ETH is no longer a monotonically-inflationary asset, and is now subject to deflationary bursts in proportion to excess fees burnt. When the base rate rises, as it does in periods of high market activity, it will (over time) reduce the supply of ETH and tighten the rate of emission. Since the EIP-1559 upgrade, 2.56M ETH have been burnt.
Source: Coin Metrics Formula Builder
Although negative emissions have only been observed on 29 days since the London hard fork (8% of all days since August 5, 2021), they have contributed spectacularly by burning ETH supply. However, these days only accounted for a fraction of the total amount burnt, 110K out of the 2.6M ETH. This outcome is most striking when we compare it against the rate of emission of Bitcoin, and we note that Ethereum in some periods is close to parity and, at times, less inflationary than Bitcoin.
Source: Coin Metrics Formula Builder
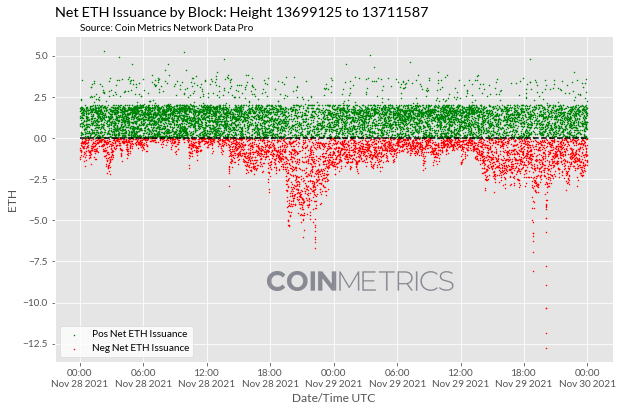
We can also consider net ETH issuance on a block by block basis, since it gives us an insight into the behavior of uncle rewards and the prevalence of negative issuance by block. In the sample period below, we can see the displacement in the net issuance distribution, which is sometimes shifted upward by uncle rewards, as well as a smaller distribution with two or more uncle blocks. But the main story is the prevalence of blocks with net-negative ETH issuance, as we see that blocks are consistently burning ETH.
Source: Coin Metrics Network Data Pro
Gas Price Volatility
One of the principal stated goals of EIP-1559 is a reduction in gas price volatility. This is meant to provide users of the protocol access to a gas market that provides transactions more certainty of inclusion in the next couple of blocks while avoiding paying excessively for fees. Although this topic warrants further exploration, there are some interesting data points that are worth discussing.
Source: https://pintail.xyz/posts/gas-market-analysis/
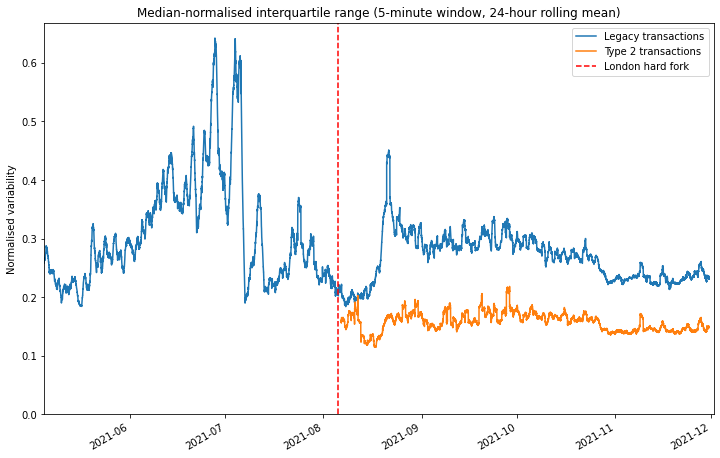
In an insightful report crypto researcher Pintail reviews the change in the distribution of the interquartile range (the difference between the first quartile and the third quartile), which is a measure of the spread between the highest and lowest fees paid in a 5-minute period. This is evidence that after EIP-1559 was implemented the variance in fees decreased for the median transaction, benefiting the greatest number of users, as well as some evidence of faster inclusion for some transaction types.
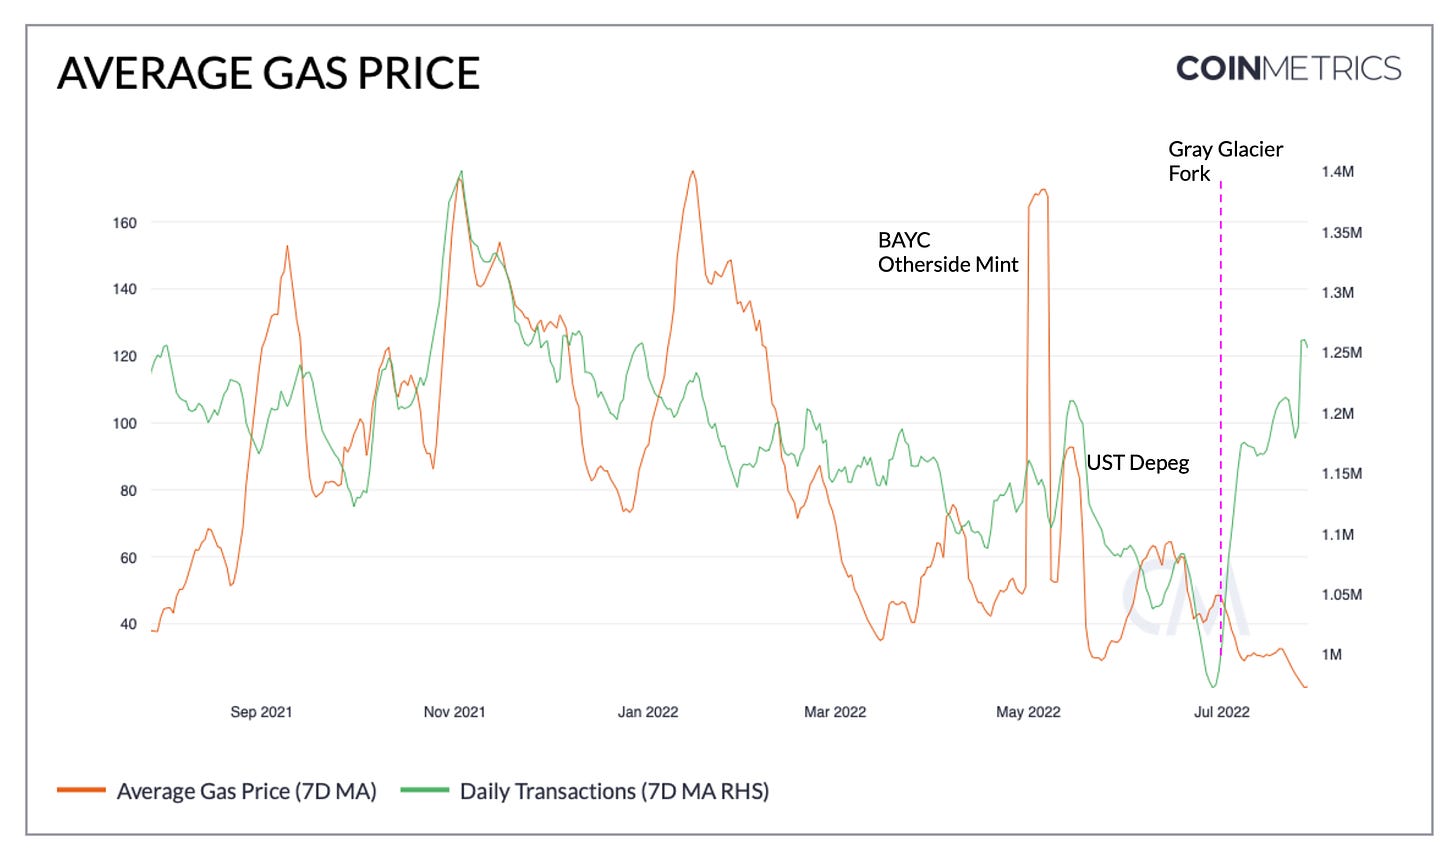
Nevertheless, periods of high volatility can increase base fees significantly, and by design burning a large amount of supply in a short period of time. One event where large-scale burning took place was the BAYC Otherside mint —at its peak, burned base fees reached 219 ETH in a single block. Another moment worth considering is the period when the UST stablecoin lost its peg to the dollar.
Source: Coin Metrics Network Data Pro
Current State of the Ethereum Fee Market
The average daily gas price has decreased since the volatile period in May, going as low as 20 gwei at the time this article was written, even as the number of transactions has increased following the Gray Glacier hard fork which returned average block times to a more normal level.
Source: Coin Metrics Formula Builder
While the average price has gone down in the last few months, this is likely in part due to decreasing daily use of smart contracts, which is consistent with a broad contraction in DeFi, NFT mints, and other smart contract offerings.
Conclusion
EIP-1559 has shown how an alternative auction mechanism can produce real-world benefits to users in the Ethereum ecosystem, making fee markets easier to navigate. A common misconception of EIP-1559 is that it was intended to address high transaction fees and bring down average fees paid by users. But persistently high fees is ultimately an issue of scalability and is not a function of an inefficient or unpredictable fee mechanism.
Even if alternatives such as Layer-2 protocols offer a different way of avoiding high on-chain fees, the Merge sets off in a path laid out by EIP-1559, including further reductions in ETH emissions and scaling of transaction processing to reduce fees.
To keep up to date on on-chain data across the entire crypto ecosystem check out our free charting tools, formula builder, and Python API Client.
Network Data Insights
Summary Metrics
Source: Coin Metrics Network Data Pro
Bitcoin addresses remained relatively stable week-over-week, while Ethereum had a large spike in active addresses that was mostly due to an apparent Binance hot wallet consolidation. The wallet sweep may have had an effect across some ERC-20 tokens as well, including USDT (ETH) and 0x. On-chain usage metrics picked up in ETC and ICP as well.
Coin Metrics Updates
This week’s updates from the Coin Metrics team:
For the best in-depth discussion of CM data and research, come check out our research community on the web3 social media platform gm.xyz.
As always, if you have any feedback or requests please let us know here.
Subscribe and Past Issues
Coin Metrics’ State of the Network, is an unbiased, weekly view of the crypto market informed by our own network (on-chain) and market data.
If you'd like to get State of the Network in your inbox, please subscribe here. You can see previous issues of State of the Network here.
To learn more, acquire our data, or contact Coin Metrics reach out here.
© 2022 Coin Metrics Inc. All rights reserved. Redistribution is not permitted without consent. This newsletter does not constitute investment advice and is for informational purposes only and you should not make an investment decision on the basis of this information. The newsletter is provided “as is” and Coin Metrics will not be liable for any loss or damage resulting from information obtained from the newsletter.


