Coin Metrics' State of the Network: Issue 168
Tuesday, August 16th, 2022
Get the best data-driven crypto insights and analysis every week:
Mapping Account-based Blockchain Data to Virtual UTXOs
By Aryan Chaudhary, Kyle Waters, and Matías Andrade
At its core, cryptocurrency utilizes complete transparency to help create trust between anonymous users. By running a node and interpreting the data, any member of the network can access information regarding any transaction ever made. In comparison to traditional finance, analyzing on-chain data provides an enormous advantage in metric creation. Investors can now answer questions like: Are holders moving coins at a profit or loss? Is increased movement of tokens on-chain indicative of long term holders liquidating positions or have short term transactions increased? Investors can also create new models to compare currencies and isolate trends.
UTXO vs. Account Based Blockchains
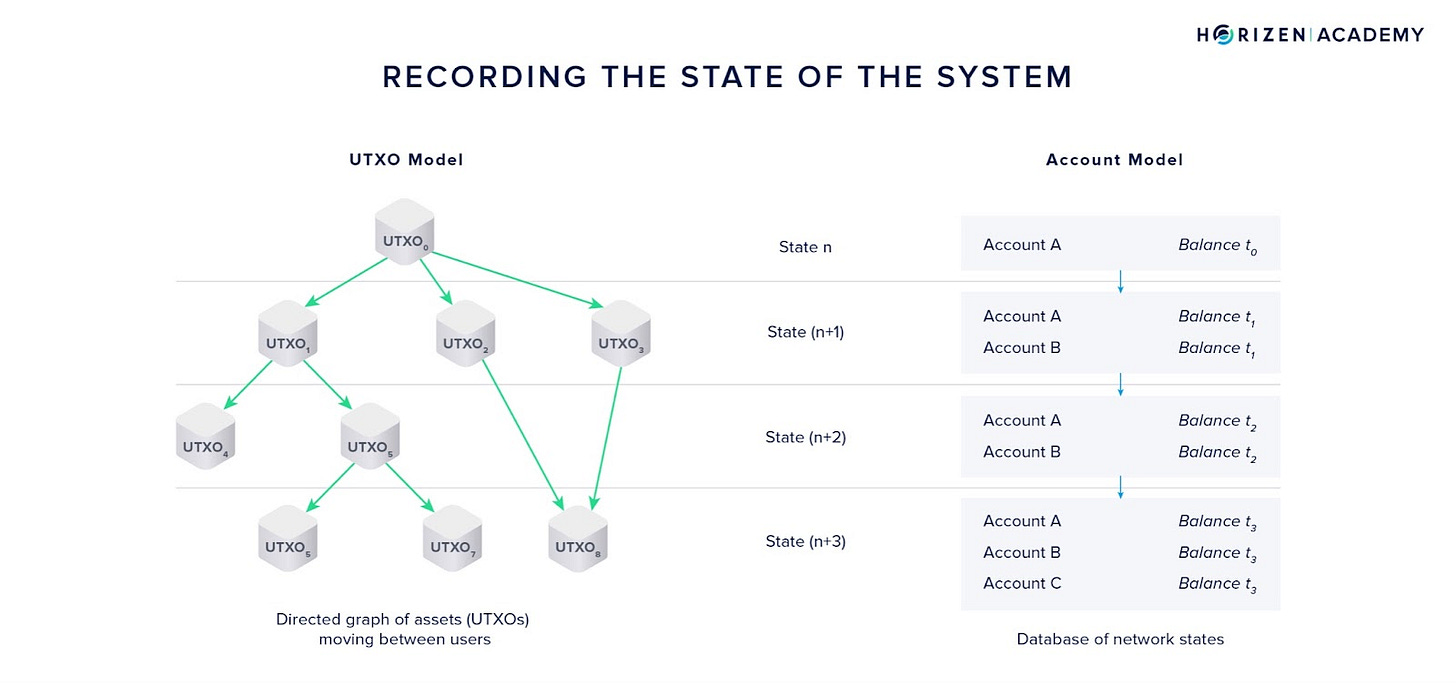
Different blockchain data models can have an impact on our ability to uncover these trends. Some blockchains like Bitcoin use something called an unspent transaction output (UTXO) based model. UTXO-based chains are conceptually similar to physical wallets. A wallet with $100 could be composed of any combination of $1, $5, $10 and $20 bills. When purchasing an item, you must use some combination of these bills that is equal to or exceeds the required amount. For example, if you want to purchase an item for 15 dollars but only have two 10 dollar bills, you must use both and then receive 5 dollars in change. Similarly, when a Bitcoin wallet wants to make a transfer, it must choose which of the associated UTXOs (dollar bills) to include in the transaction. Observing this process allows anyone to trace the provenance of individual UTXOs over time.
Other blockchains, such as Ethereum, use an account based model, which is conceptually similar to bank accounts. When completing a transaction, the network simply updates the total balance and does not select which incoming transfer to use.
Due to the fungibility of their coins, current metrics for account based blockchains often struggle to show the behavior of holders and profit realization. One potential solution to expand account based metrics is to map transactions to virtual UTXOs, allowing one to see both how long coins were held and whether they were last moved at a profit. In this week’s State of the Network we present a virtual UTXO model for Ethereum and other account-based tokens.
Methodology
Mapping transactions to virtual UTXOs involves two separate components: converting incoming transactions to UTXOs and a coin selection algorithm to complete outgoing transfers.
First, one must first create a new UTXO for every incoming transfer. For example, if an account receives incoming transfers of 5 and 2 ETH, the account gets mapped to a list of the two UTXOs whose balance sums to 7 ETH. When a user wants to then transfer some amount out, a coin selection occurs on the available UTXOs (usually executed by wallet software). This research utilizes a custom coin selection algorithm similar to the one proposed by Bitcoin Core, the software implementation of the Bitcoin protocol. When an outgoing transaction is triggered, the program first checks whether there is an available UTXO with the same value as the outgoing transaction. If the target amount is not found, the program then merges the UTXOs with a value less than the target amount together. For example if an account had ten UTXOs of 1 ETH each and wanted to send 5 ETH, the program would use all ten of the UTXOs and simply send one UTXO with a balance of 5 back as change. Lastly, if merging does not fund the outgoing transfer, the program searches for the smallest UTXO with a balance larger than the target.
Coin Age & SOPR
Using the virtual UTXO mapping, one is able to create two new metrics for account based chains: coin age and spent output profit ratio (SOPR). Coin age is calculated as the time between a UTXO being received and spent by a given account. By plotting a cumulative density function of coin ages for transactions between two given days, one can see the probability that a UTXO will be spent as a function of the time since it last moved.
Since Ethereum currently has over one hundred million accounts and over a billion transactions, we started with a random sampling of accounts created since the genesis block. The random sample’s transaction volume was compared with on-chain ETH transaction volume to ensure a viable sample with similar trends. In total the random sample scanned 75,000 accounts with over 500,000 virtual UTXOs. Coin age was calculated for each transaction in the sample. The following chart shows the cumulative density function that spans the entire history of the network. From this chart we can see that a vast majority of virtual UTXOs on ETH move within the first few days. In fact, 75% percent of UTXOs included in transactions have a coin age less than 3 days, highlighting ETH's role as a native token to pay for computation on the network.
One can also create a SOPR metric, an indicator for realized profit on-chain, that is calculated as the ratio between the dollar value of a UTXO at creation and when it gets spent. A SOPR value greater than 1 for any given date indicates that the tokens moved at a higher price. However, it is important to remember that not all transactions are investors selling, some transactions simply move or reshuffle funds. The following chart shows the SOPR values for dates after December 17, 2017 based on the random sample outlined above. Due to the nature of a random sample, some of the SOPR values may not be fully indicative of the market but the trend of values likely is.
Source: Coin Metrics Atlas
As one might expect around the Ethereum price boom of late 2020, the SOPR value increased dramatically as prices reached new highs. In the years prior, the SOPR seemed to stay at or below 1 indicating users largely moving at a loss. One particularly interesting period comes between March 2018 (day 100) and May 2019 (day 500) when the SOPR breaks below 1. In the following chart, one can see that even though the price of ETH fluctuates dramatically, the SOPR value held steady around 1 until falling below in late 2018 (day 300).
Source: Coin Metrics Atlas
The SOPR value can provide insight into how strongly an asset is falling or rising and whether long term holders are exiting the network. While moving tokens is not necessarily indicative of selling, tokens moving at a loss for a continued period of time could potentially signal investors losing faith in a project and preventing future losses. In order to truly determine long term sentiment, one can look at the coin age distribution for transactions made during a selected period. The chart below shows the coin age distribution for transactions made between February 19, 2018 and September 7, 2018, right as the SOPR falls below 1 .
Source: Coin Metrics Atlas
The outward shift depicted in the zoomed image indicates that during this time period UTXOs with a greater coin age were more likely to be included in a transaction. This increased probability means more long term holders were moving their tokens, which explains why the SOPR would be around 1 even if the price is falling. Using both the SOPR and coin age distribution together we can provide a potential indicator for Ethereum prices failing to bounce until late 2020. Another way to contextualize the drawdown in early 2018 is to look at when a user would have had to purchase ETH in order to sell at a profit. The chart shows that to sell at a profit in September 2018, investors would have had to purchase their ETH more than a year earlier.
Source: Coin Metrics’ Formula Builder
This type of analysis is not limited to ETH however, any account based token can be mapped to virtual UTXOs. Currently some of the largest tokens in the cryptocurrency space are stablecoins that help investors navigate the volatility of markets and provide liquidity. As a result, it’s valuable to see which specific stablecoins are being used as a store of value and which ones are being used to facilitate transactions. Virtual UTXO analysis allows us to plot a coin age density function for any stablecoin and compare. The following chart shows the density function for both USDT and USDC on Ethereum, two of the most popular stablecoins by market cap.
Source: Coin Metrics Atlas
Based on the graph, one can see that USDT tokens have a greater velocity than USDC tokens on ETH. A potential reason for decreased velocity could be their use in DeFi protocols that lock up the token as collateral or in a liquidity pool. Lastly, it is worth noting that stablecoins have a significantly higher velocity than ETH.
As crypto adoption and access to blockchain data grows, new models and metrics can be created to better understand holder behavior beyond what has traditionally been available with other financial assets.
To explore more on-chain indicators be sure to check out our on-chain indicators report.
Network Data Insights
Summary Metrics
Source: Coin Metrics Network Data Pro
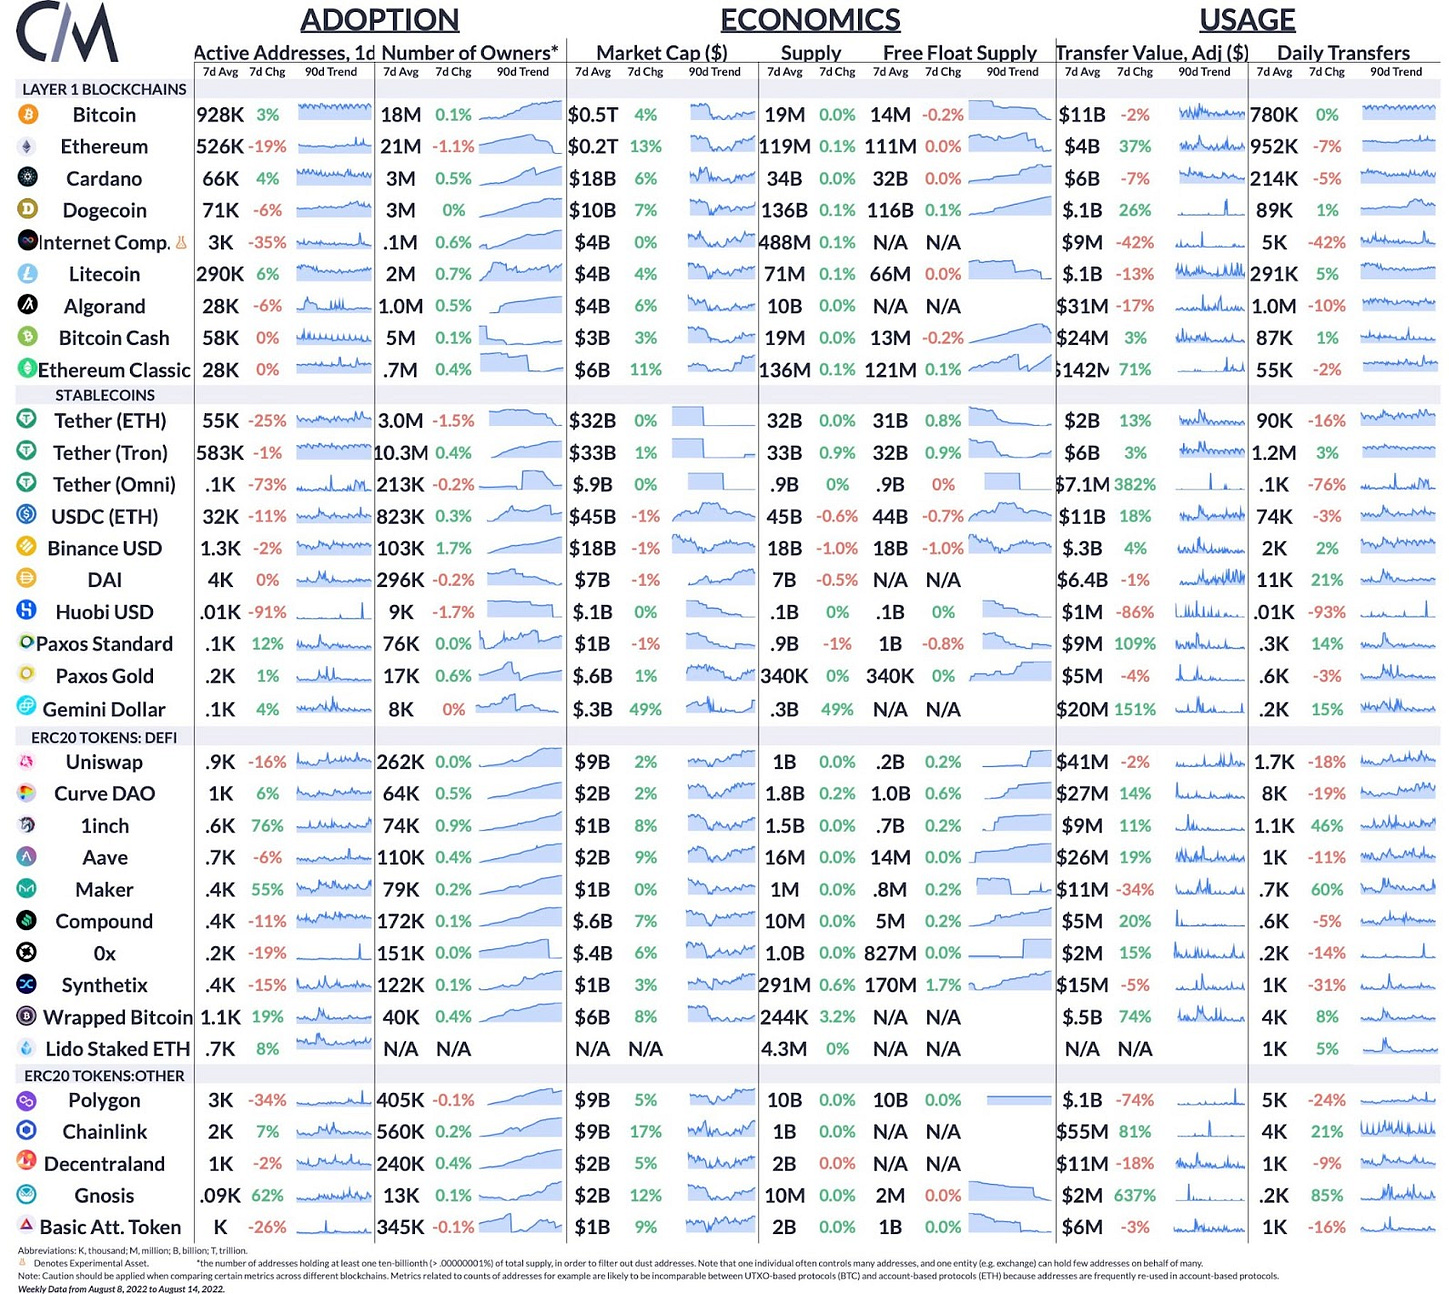
Bitcoin active addresses rose 3% from last week. Ethereum active addresses fell 19% - but have been choppy recently as some exchanges appear to be taking advantage of low gas fees to consolidate funds. Transfers of Lido’s stETH token rose 5% over the week in the wake of the final Merge sequence engaged.
Coin Metrics Updates
This week’s updates from the Coin Metrics team:
We are excited to be hosting author Omid Malekan for an AMA on our gm.xyz research community. Please post your questions before this Thursday!
Last week, we released a report walking through the core concept of gas on Ethereum. Check it out here.
As always, if you have any feedback or requests please let us know here.
Subscribe and Past Issues
Coin Metrics’ State of the Network, is an unbiased, weekly view of the crypto market informed by our own network (on-chain) and market data.
If you'd like to get State of the Network in your inbox, please subscribe here. You can see previous issues of State of the Network here.
To learn more, acquire our data, or contact Coin Metrics reach out here.
© 2022 Coin Metrics Inc. All rights reserved. Redistribution is not permitted without consent. This newsletter does not constitute investment advice and is for informational purposes only and you should not make an investment decision on the basis of this information. The newsletter is provided “as is” and Coin Metrics will not be liable for any loss or damage resulting from information obtained from the newsletter.


