Coin Metrics’ State of the Network: Issue 183
Tuesday, November 29th, 2022
Get the best data-driven crypto insights and analysis every week:
A Look at Stablecoins and Other On-Chain Derivatives
By Kyle Waters and Matías Andrade
Crypto market participants continue to recalibrate following the abrupt shocks emanating from FTX’s woes. As we have covered in recent editions of State of the Network, the on-chain footprint of Alameda’s wallets stretched long and far across many crypto assets and blockchains. As a result, the impacts are vast and evolving. We believe one area of particular interest is stablecoins.
Stablecoins are digital tokens issued on public blockchains that track an underlying asset, today, overwhelmingly the US Dollar. In the most popular fiat-backed model, issuers like USD Coin’s Circle hold reserves backing the tokens redeemable for the underlying dollar.
Stablecoins came under serious scrutiny earlier this year after the vicious spiraling of the ‘algorithmic’ stablecoin Terra USD, but have continued to be a significant area of development in the digital assets industry. How has the stablecoin ecosystem held up in the wake of FTX’s collapse?
Adoption
One simple measure of adoption is value transferred on-chain. Using a relatively longer window of a 90-day moving average, daily value exchanged on blockchains with stablecoins is near all-time highs of $25B per day. About $20B of this is sourced from USDC (on Ethereum) and Tether (Ethereum and Tron) transfers.
Source: Coin Metrics Network Data
It’s also worth considering the role stablecoins played in permitting users to withdraw funds from exchanges to reduce their counterparty risk exposure. We can note that addresses holding an excess of $10,000 denominated in various stablecoins has increased in the last few months; USDC, in particular, has seen a significant increase since the beginning of November, from 76K to 86K addresses.
Source: Coin Metrics Network Data
Free Float Supply and Redemptions
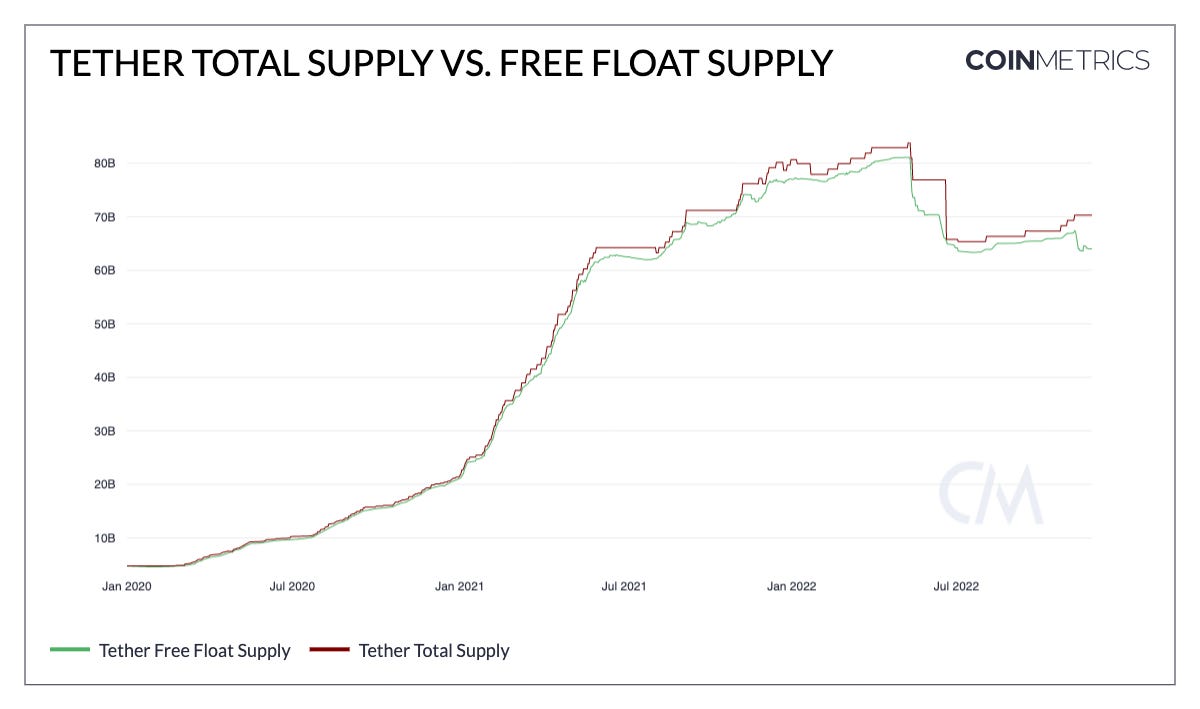
Coin Metrics calculates a free float supply metric that better captures the liquid supply in circulation not held by treasuries or redemption accounts.
This is especially important in the case of Tether, whose redemption model includes a treasury address where redeemed USDT is held. This USDT should not be considered part of circulating supply, so it is important to look at free float supply for an accurate assessment of supply trends. Since November 8th USDT supply (Ethereum, Tron, Omni) has decreased by about $4B from $67B to $63B.
Source: Coin Metrics Network Data
The redemptions come as the price of Tether dipped slightly below its $1 peg. This creates an arbitrage opportunity for certain larger market participants: they can buy USDT below $1 and redeem it at par. The rate of redemptions has not been as intense as spring of this year though, reflecting the less severe discount to the $1 peg.
Source: Coin Metrics Network Data
Meanwhile, the other fiat-backed stablecoin stalwart, USDC, has experienced a slight uptick in free float supply rising from $37B to $40B since November 8th.
Source: Coin Metrics Network Data
Looking to wBTC
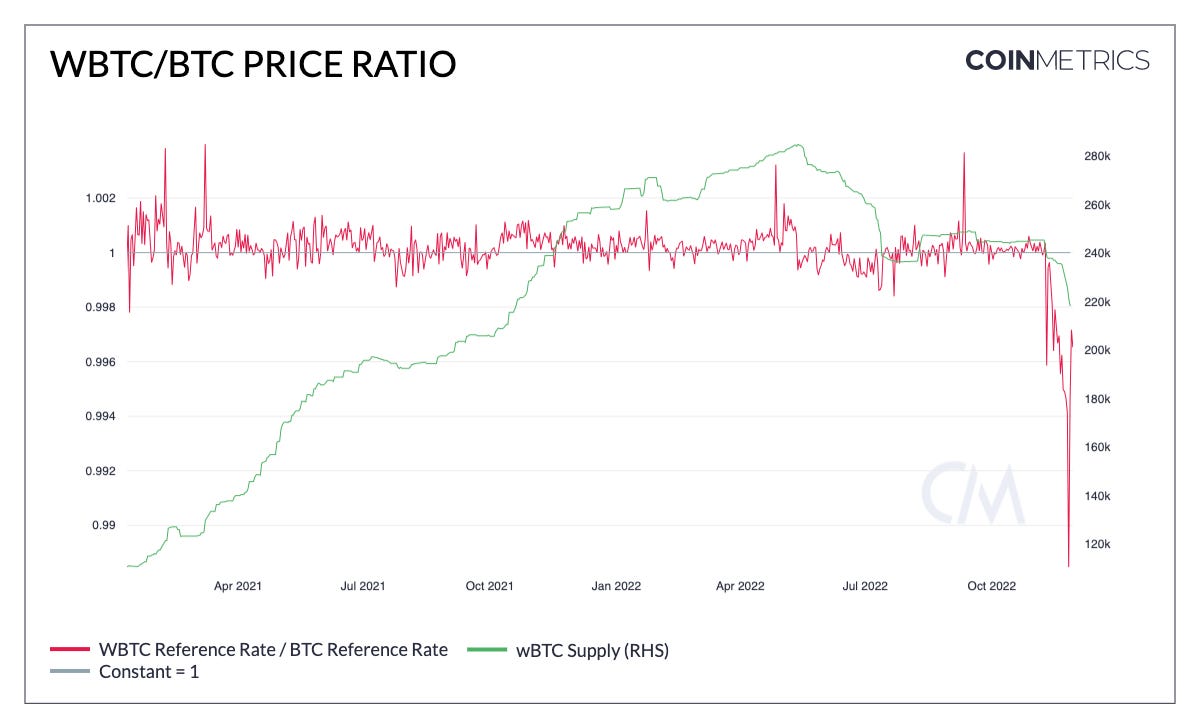
Although stablecoins are by far the on-chain derivatives with the greatest adoption, there are also “wrapped” assets, which are tokens that are used to interact with underlying assets that are not addressable from within a smart contract. Wrapped bitcoin (wBTC) is a derivative of bitcoin used in Ethereum that is managed by depositing BTC with an escrow custodian that issues wBTC tokens, making sure to keep a 1:1 correspondence between the two. Recently, the multi-sig address that is used to manage most of the wBTC funds was adjusted to remove inactive signatories (including FTX’s Blockfolio), going from 18 addresses to only 11, with eight signatures needed to approve transactions.
Source: Coin Metrics Network Data
Soon after the FTX fiasco, one of the main custodians of BTC backing wBTC, a company called BitGo, temporarily halted withdrawals, prompting the price of wBTC to deviate from that of the underlying BTC. The price of wBTC has since started to recover but remains below the BTC reference rate. wBTC supply has fallen has redemptions have accelerated.
Conclusion
As both markets and participants look to learn and recover from recent events it is critical that we keep a close eye on the financial infrastructure that undergirds many of crypto’s most popular uses. Moreover, we can gather a lot of information by focusing on stablecoins as market participants endeavor to reduce their risk exposures and to safeguard their assets.
To follow the stablecoin data used in this piece and explore our other on-chain metrics check out our free charting tool, correlation tool, and mobile apps.
Network Data Insights
Summary Metrics
Source: Coin Metrics Network Data Pro
On-chain activity slowed as the dust settled a bit after FTX’s implosion. Most coins are still seeing an uptick in the number of owners, a likely result of users continuing to withdraw tokens from exchanges to self-custody wallets.
Coin Metrics Updates
This week’s updates from the Coin Metrics team:
For the best in-depth discussion of CM data and research, come check out our research community on the web3 social media platform gm.xyz.
As always, if you have any feedback or requests please let us know here.
Subscribe and Past Issues
Coin Metrics’ State of the Network, is an unbiased, weekly view of the crypto market informed by our own network (on-chain) and market data.
If you'd like to get State of the Network in your inbox, please subscribe here. You can see previous issues of State of the Network here.
Check out the Coin Metrics Blog for more in depth research and analysis.


