Coin Metrics’ State of the Network: Issue 191
Tuesday, January 24th, 2023
Get the best data-drive crypto insights and analysis every week:
Monitoring the Currents of the Crypto Market
By Matías Andrade and Kyle Waters
The digital asset market is experiencing a surge in activity as we kick off the new year. Bitcoin is up 36% in January rising to $22,500, its highest level since last summer. This growth may seem surprising amidst the backdrop of economic uncertainty, including large-scale layoffs in tech giants and persistent macro risks. Nonetheless, this presents a unique opportunity to scout the trends in relative performance and track key market indicators to track the development of the market in upcoming months.
Market Returns
The digital asset market has seen a remarkable rebound, as evidenced by the performance of the various indices tracked by Coin Metrics. Through the lens of datonomy™—the digital assets taxonomy developed collaboratively by Coin Metrics, Goldman Sachs, and MSCI—we are able to gain a deeper understanding of the market by analyzing and contrasting different sectors against each other.
The CMBI Total Market Series indexes have all seen positive growth, all netting gains over 25% through January 22nd. The Metaverse sector is leading the market, with a near 60% rise year-to-date, followed by Smart Contract Platforms, which has seen an increase of 52%.
The Metaverse and smart contract sectors have been performing particularly well in the current bull market and continue to outpace the overall digital asset market.
Despite the move higher, there is still a lot of room to go to retake the 2021 highs. A full 400 days have now passed since BTC hit its last all-time high in November 2021.
Source: Coin Metrics Reference Rates
Likewise, ETH has also spent over 400 days now below its last ATH.
Source: Coin Metrics Reference Rates
Returns are only one part of a market’s anatomy. To understand recent market dynamics we must look at volatility as well.
Bitcoin Volatility
Realized volatility is a valuable tool for assessing historical market behavior and characterizing the performance of assets over specific time periods. Using our reference rate data, we calculate a 30 day realized volatility metric. This measurement of volatility highlights different episodes that occurred in the market over the past year, including the Terra/Luna de-pegging in May and the collapse of FTX in November.
Source: Coin Metrics Market Data
Bitcoin’s realized volatility flat-lined towards the end of 2022. However, in recent weeks, a bullish trend has pushed prices higher, reaching $22,000 and volatility rising too, although still below previous levels.
Sector Volatility
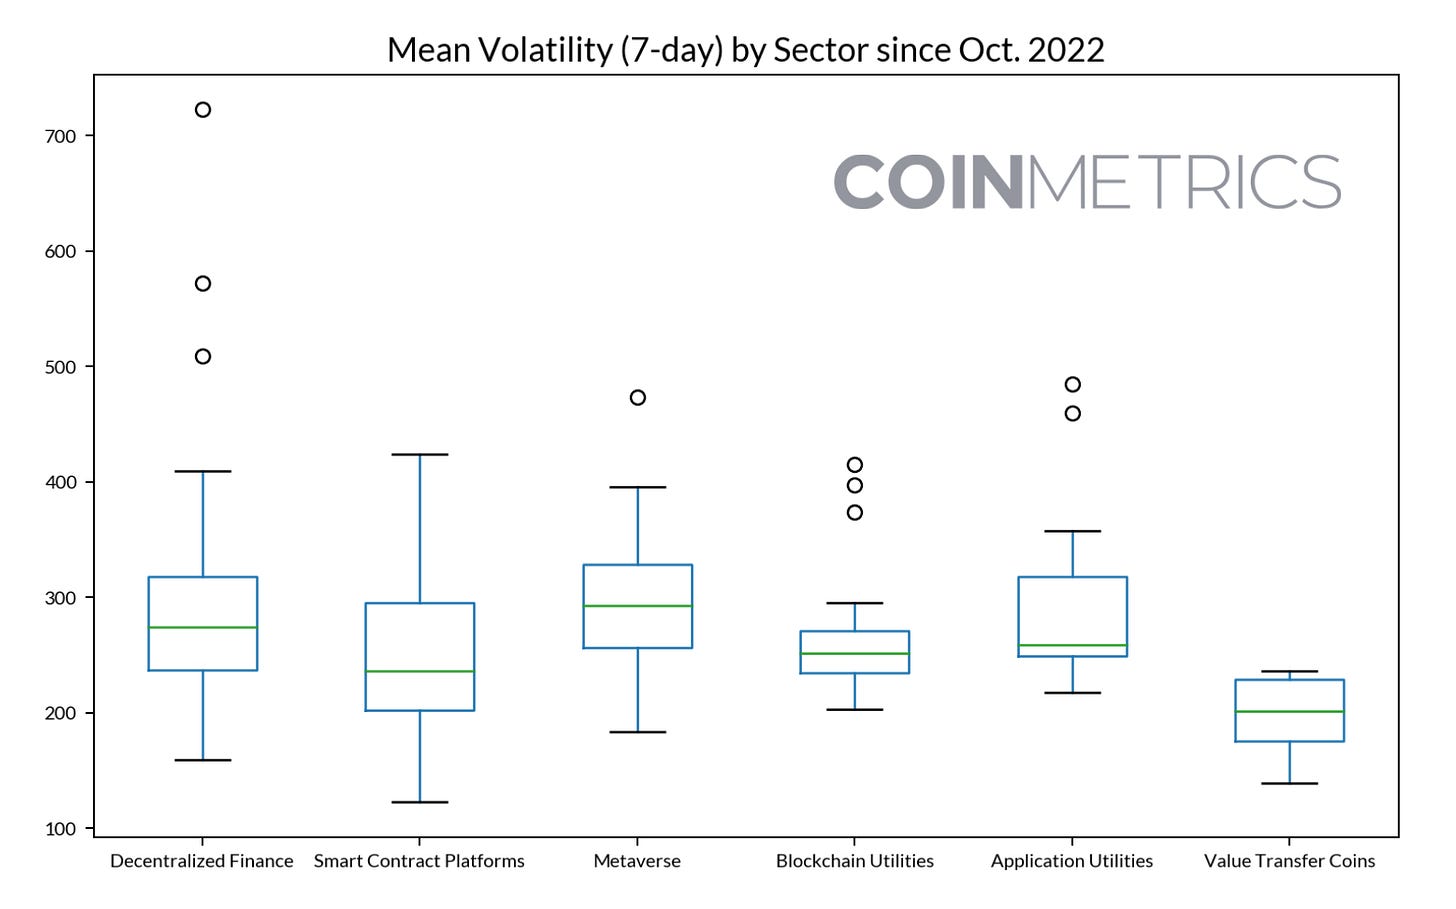
To gain a comprehensive understanding of market volatility, we can analyze volatility across various sectors of our digital asset taxonomy. In the chart presented below, we calculated a seven-day volatility for each asset in our sample, since October 2022. All of these assets experienced more than 200% volatility in the period observed. However, it is interesting to note that Value Transfer Coins had lower volatility compared to tokens used in DeFi, which exhibited some of the highest volatility levels across these sectors.
Sources: Coin Metrics Reference Rates and datonomy™
Spot & Futures Exchange Data
Recently, there have been notable shifts in the relative market share of exchange-traded volume within the digital asset market. These developments have further entrenched Binance as the leading exchange in terms of volume traded. Our sample indicates that Coinbase was the second-highest volume traded since the beginning of the year.
Source: Coin Metrics Network Data
The market for derivatives trading exhibits a slightly greater degree of diversity in the choice of venues. One easily noted player in this market is CME, which only conducts trades during U.S. open market hours and is visible near the top of the chart below. However, the majority of futures volume trades take place on Binance, Bybit, and OKX.
Source: Coin Metrics Network Data
Conclusion
In conclusion, the digital asset market has seen a remarkable rebound, as evidenced by the performance of various indices tracked by Coin Metrics. Additionally, by utilizing the datonomy framework, it is possible to gain a deeper understanding of the market by analyzing the relative performance of different sectors. These insights provide valuable information about the current state and potential future trends of the digital asset market. As global financial markets warm up to the prospect of a “soft-landing” following a turbulent 2022 of rate hikes and soaring inflation, crypto market participants would surely welcome an easing macro headwind.
Network Data Insights
Summary Metrics
Source: Coin Metrics Network Data Pro
The recent market rally has yet to lead to a boost in most measures of on-chain activity. Bitcoin active addresses fell 6% week-over-week to 932K, while Ethereum active addresses held steady at 524K. Stablecoin on-chain activity was also down slightly over the week, broadly. Some DeFi tokens saw higher activity, including a flurry of activity in Chainlink’s LINK as well as Curve DAO’s CRV and 1INCH.
Coin Metrics Updates
This week’s updates from the Coin Metrics team:
Last week, we hosted our first crypto meetup of 2023 in New York City! To look out for future CM events, make sure to follow us on Twitter, LinkedIn, and check out our events page.
For the best in-depth discussion of CM data and research, come check out our research community on the web3 social media platform gm.xyz.
As always, if you have any feedback or requests please let us know here.
Subscribe and Past Issues
Coin Metrics’ State of the Network, is an unbiased, weekly view of the crypto market informed by our own network (on-chain) and market data.
If you'd like to get State of the Network in your inbox, please subscribe here. You can see previous issues of State of the Network here.


