Coin Metrics’ State of the Network: Issue 230
Navigating the Liquidity Landscape: Insights into Digital Asset Markets
Get the best data-driven crypto insights and analysis every week:
Navigating the Liquidity Landscape: Insights into Digital Asset Markets
By: Kyle Waters & Matías Andrade
On Monday, bitcoin (BTC) rallied back above $30K, before rising strongly after US market hours and briefly hitting $35K, the highest since May 2022. Momentum appears to be building, with signs pointing to the SEC being on the precipice of approving a BTC spot ETF product in the near future. Last week’s brief rally on prematurely reported ETF news is evidence of ETF-driven pent-up demand.
However, as we noted earlier in May, events of 2023 have challenged liquidity conditions. Nevertheless, some markets have stood resilient in the face of these shocks. In today’s issue of State of the Network, we examine trends in trading volume and market data, using Coin Metrics’ datonomy™ to glean insights into the market conditions by specific digital asset sectors, while also focusing on both centralized exchanges and decentralized exchanges (DEXs).
Spot Volume
One of the key metrics to examine is Coin Metrics’ trusted spot volume, which aggregates trading volume across a whitelisted set of exchanges which is determined by rigorous quantitative and qualitative assessments of exchanges across various dimensions of quality.
In general, spot volume has trended downward this year from an aggregate of $40B per day across the datonomy universe of assets to just over $10B daily today.
Source: Coin Metrics datonomy™ & Market Data Feed
Most sectors have experienced year-over-year declines. However, spot volume is just one part of the story, liquidity on exchanges is also an important variable for market participants to track.
Market Depth & Liquidity
Exchanges serve as a foundational component of our financial infrastructure, facilitating the efficient trading of assets for a broad spectrum of participants, ranging from individual investors to institutional players. Among the key metrics used to gauge this efficiency, market depth stands out as a crucial indicator. Market depth provides insights into the ease with which an asset can be bought or sold relative to the size of the trade being executed. Essentially, it helps us assess the capacity of a market to accommodate trades of varying sizes, taking into account the existing resting limit orders within that market.
An active and liquid order book, encompassing the aggregation of outstanding buy and sell orders in a market, stands as an indispensable element of a mature financial asset. It underpins the capacity to swiftly execute substantial trades with minimal price impact, commonly referred to as slippage. This attribute holds immense importance for institutional participants in the market—which are most concerned with their ability to trade in size—enabling efficient trading and risk management.
Coin Metrics has been curating order book snapshots for prominent markets since 2019. Recently, we introduced a set of liquidity metrics aimed at providing institutional entities with a more comprehensive perspective of the evolving cryptocurrency landscape.
In the chart below, we illustrate the depth of Coinbase’s BTC order books, displaying bids and asks within 2% of the mid-market price. This data offers valuable insights into the depth of the market, and shows that although market depth is quite volatile and dependent on various factors, bid and ask volume remain relatively stable, currently adding up to $11M and $8M respectively.
Source: Coin Metrics’ Market Data (data smoothed with a 3-day moving average)
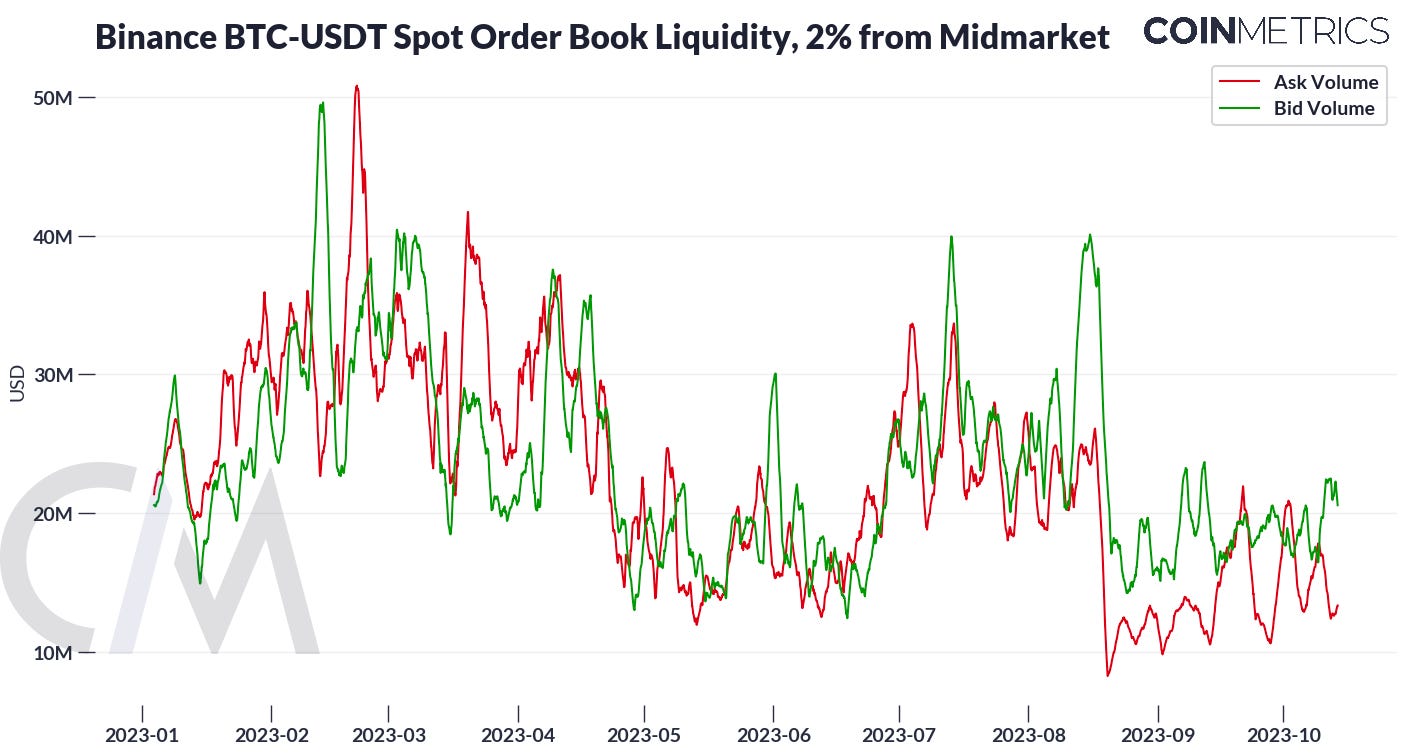
Moving from onshore to offshore exchanges, we can further consider Binance as well, which has been the most liquid international market in recent years and the most significant global exchange outside the US. As the exchange faces increased scrutiny from regulators, we can see a consistent trend with decreasing liquidity, with current bid-ask volumes at 2% hovering around $15M compared to early in the year when it ranged around $30–40M.
Source: Coin Metrics’ Market Data (data smoothed with a 3-day moving average)
While BTC remains the most liquid trading asset and serves as a rough benchmark for the rest of the digital asset market, we can go even further and track the sum of liquidity for the 200+ assets that are part of Coin Metrics, Goldman Sachs, & MSCI’s datonomy™. This allows us to evaluate the evolution of each sector’s liquidity over the last year, and compare where liquidity is concentrated across each exchange.
Looking at Coinbase, we can see the rise and fall of various markets' aggregate liquidity over the last year. Some of the most noticeable declines include the Metaverse and Decentralized Finance sectors, which have less than half the resting liquidity compared to their peak earlier this year. A broad sharp decline during the SVB crisis in March is also noticeable. However, Value Transfer Coins and Smart Contract Platforms have fared better, seeing less pronounced declines since the beginning of the year—especially when compared to the decline in spot volume.
Source: Coin Metrics datonomy™ & Market Data
If we compare this to Binance’s market we can see that this pattern holds across different exchanges, even if the level of liquidity and the exact composition of assets that trade on Binance is different from Coinbase.
Source: Coin Metrics datonomy™ & Market Data
Decentralized Exchanges
Examining decentralized exchanges over the past year, the chart shows a decline in Uniswap volumes from the start of the year and compared to 2022. The bulk of the volume is from stablecoins, corroborated by the dominance of stablecoin-to-stablecoin pools in Uniswap's TVL. Volumes also spike around specific events—notably, the FTX incident and the SVB bank run in November 2022 and March 2023.
Source: Coin Metrics datonomy™ & Market Data
We can further disaggregate these measures of volume into separate exchanges, breaking down total volume as a proportion of different datonomy™ sectors. Here we can see that Uniswap V3 dominates stablecoin volumes, since its concentrated liquidity affords lowers slippage and trading costs compared to Uniswap V2.
Source: Coin Metrics datonomy™ & Market Data
Furthermore, we can see that while sector breakdowns have been relatively stable over the last two years. This is even more noticeable when we zoom in to the bottom third of each plot, as seen below.
Source: Coin Metrics datonomy™ & Market Data
With this level of detail we can now tell how much the Metaverse was able to attract investment and swap volumes during April last year. Additionally, we’re able to notice growing participation of Decentralized Finance, which could be attributed to a period of consolidation around value. However, we should note that this rise in activity takes place across Uniswap V2 pools, which altogether account for ~10% of Uniswap’s total volume.
Conclusion
Crypto markets have surged in recent weeks over the imminent SEC approval of a BTC spot ETF, and thus the question of broad market liquidity remains critical in the event that this news piques investors’ interest. As we continue to monitor these developments, it becomes evident that liquidity will play a pivotal role in determining the market’s ability to accommodate additional trading volume.
Network Data Insights
Summary Metrics
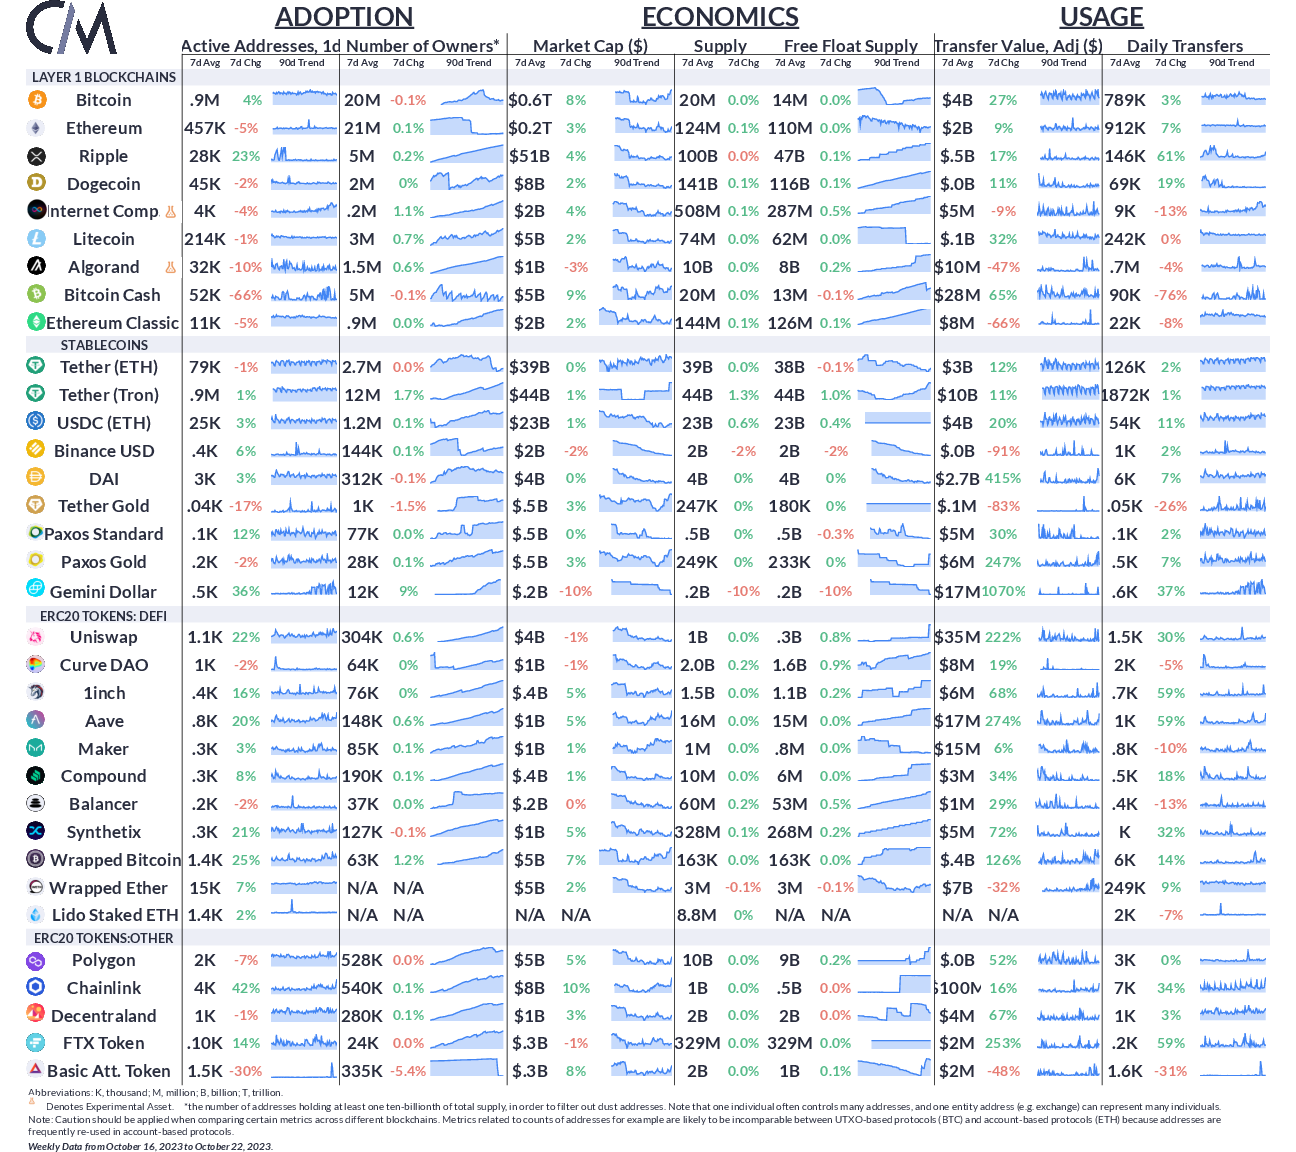
Source: Coin Metrics Network Data Pro
Bitcoin active addresses rose 4% while Ethereum active addresses declined 5% over the week.
Coin Metrics Updates
This week’s updates from the Coin Metrics team:
Last week we released a collaborative report with Bitcoin Suisse on crypto asset supply dynamics, check it out here.
Follow Coin Metrics’ State of the Market newsletter which contextualizes the week’s crypto market movements with concise commentary from the Coin Metrics team, rich visuals, and timely data.
As always, if you have any feedback or requests please let us know here.
Subscribe and Past Issues
Coin Metrics’ State of the Network, is an unbiased, weekly view of the crypto market informed by our own network (on-chain) and market data.


