State of the Network’s Q1 2024 Wrap-Up
A data-driven overview of events shaping digital asset markets in Q1–2024
Get the best data-driven crypto insights and analysis every week:
State of the Network’s Q1 2024 Wrap-Up
By: Tanay Ved & Matías Andrade
Introduction
In this special edition of State of the Network, we take a data-driven look at the most important events that impacted the digital assets industry in Q1 2024.
Source: Coin Metrics Reference Rates
Over the first quarter of 2024, digital asset markets have expanded substantially, catalyzed by an end to the decade-long quest for spot Bitcoin exchange traded products in the US. In stark contrast to the uncertainties that plagued crypto-asset markets in the past few quarters, Q1 marked a turning point for the industry. Over this period, we’ve seen the total digital asset market capitalization rise back to over $2T, with Bitcoin (BTC) reaching a new all-time high of $73K, 66% higher year-to-date.
This strength was mirrored in several crypto-assets and sectors, ranging from layer-1’s like Solana (SOL +92%) and Near (NEAR +90%) to memecoins like Pepe (PEPE +527%) and projects at the intersection of AI and compute applications such as Render Network (RNDR +141%), among several others. Moreover, we’ve seen various forms of tooling, infrastructure and applications coming to fruition, fueling a renewed sense of innovation and optimism across blockchain ecosystems. Below, we cover major developments shaping the digital asset landscape in Q1 2024.
Bitcoin Reaches a New All-Time High
The launch of Bitcoin spot ETFs emerged as a pivotal catalyst for digital asset markets this quarter, representing a highly anticipated event that broadened access to Bitcoin. This development has been appealing to retail and traditional investors alike, offering them a familiar investment vehicle with a competitive cost and fee structure to gain exposure to the largest digital asset. With 11 issuers including giants like BlackRock and Fidelity joining the fray, this launch signified a broadening embrace of digital assets.
The demand and strength of inflows into bitcoin exchange-traded products have been unprecedented, catching many by surprise and making them the fastest growing ETFs in history. After a quarter since launch, about $12B has flowed into these vehicles, holding ~4% of BTC’s current supply. Of the 11 issuers, BlackRock’s IBIT has been the clear winner, amassing close to 250k BTC (~$17B) since inception, with several other issuers gaining market share. Conversely, Grayscale’s GBTC has been an outlier with large outflows, primarily due to higher fees and the repercussions of the Genesis and FTX bankruptcies.
Despite the occasional volatility in investment flows, with some days experiencing exceptionally high activity, the introduction of spot bitcoin ETFs has undeniably been the foundation for the broader rally across digital asset markets. Q1 provided us with a glimpse of the strong market appetite for these products, however, participants will be keen to see the enduring appeal and the impact of derivatives-based ETFs entering the mix going forward.
Ethereum’s Dencun Upgrade Goes Live
With the successful completion of the Dencun hard-fork" on March 13th, Ethereum achieved yet another crucial milestone in its roadmap, undergoing a major infrastructure upgrade to enhance the blockchains scalability. This event was anticipated not only by Ethereum users, who’ve grappled with high transaction fees during periods of congestion, but also by layer-2 (L2) solutions that have faced elevated costs associated with storing or settling data that has been processed off-chain, down to Ethereum’s layer-1. However, the introduction of “blobs” through EIP-4844, has alleviated these bottlenecks, setting the foundation to improve the economic feasibility of the network for all stakeholders involved.
Blobs Land on Ethereum Mainnet
Source: Coin Metrics Network Data Pro, Dencun Metrics
EIP-4844 addresses Ethereum’s scalability issues by creating space for “blobs” of data. As a more efficient form of data-storage compared to calldata, layer-2’s can utilize blobspace to settle transactions to Ethereum’s layer-1, which acts as a data-availability and settlement layer. Since the upgrade, the network has processed over 209K blobs as of March 31st. This is brought to fruition through “blob-transactions,” a new transaction type involving the use of blobs which are made available for periods of approximately 18 days—unlike calldata, which is stored permanently. The temporary nature of blobs enable them to be priced at a lower cost, thus significantly reducing the data-availability costs (DA) costs for L2’s.
The Impact of Blob Adoption
Several rollups including Arbitrum, Optimism & ZkSync started adopting blobs shortly after the upgrade, realizing a sharp decline in data costs. Average costs, or ETH spent by the respective L2 sequencers (responsible for ordering and processing transactions on the L2 and submitting them to the L1 for settlement) dropped materially from 0.15 ETH to ~0.0005 ETH, translating to a reduction in user transaction fees by 60% to 90%. With a reduction in costs and rise in transactions through applications like decentralized exchanges (DEX’s), L2’s are likely to benefit from higher margins.
In this context, the impact of network demand on blob fee pricing dynamics will be crucial to monitor. EIP-4844 creates a new blob gas market, operating similarly to EIP-1559, with fees varying based on supply and demand. Currently, the network has a target of 3 blobs and a max of 6 blobs per block. Therefore, as the number of blobs in a block exceeds this target, blob base fees would increase. We’ve seen this playing out on a few instances, proving to be an important stress test for the network under conditions of high blobspace utilization. For instance, Coinbase’s L2 Base experienced a surge in transaction fees as the memecoin frenzy gripping Solana also made its way to Base.
Additionally, on March 27th, an inrush of inscriptions on blobs (“blobscriptions”), led to a surge in hourly average blob fees, pushing them over $60 from being effectively costless before their arrival. This heightened blob activity also caused a drop in block count on the Ethereum network. Therefore, monitoring fee dynamics and network health will be crucial going forward as adoption of rollups and their blob capacity increases. Despite these early hiccups, it's clear that the Dencun upgrade has paved the way to enable greater accessibility for users, rollups and applications alike.
Stablecoin Growth & Landscape
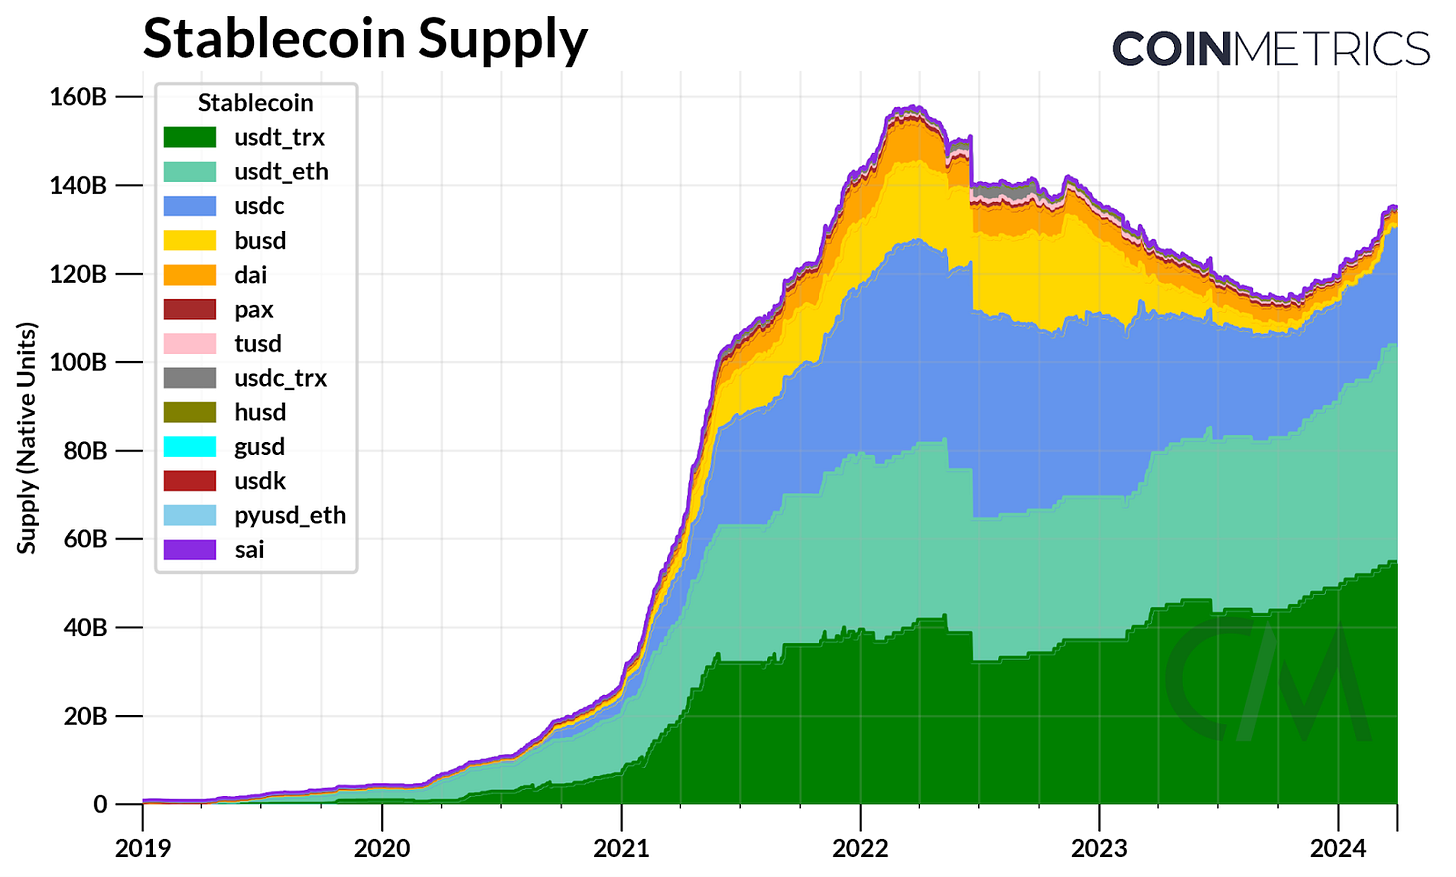
Alongside the growth in digital asset market valuations, stablecoins resumed their expansion in Q1. The supply of US dollar-pegged stablecoins surpassed $135B, growing by 13.5% over the quarter in aggregate. Tether (USDT), the stablecoin juggernaut, crossed a $100B, with its circulating supply on Ethereum growing by 16%, while supply on the Tron network rose by 11%. Circle’s USDC had a strong start to Q1, expanding by 22% to $27B in supply—close to levels observed around the regional banking crisis of last year. While USDT has dominated centralized exchange volumes, USDC trading pairs are gaining a larger presence across spot markets as liquidity improves. The increasing market share of the two leading stablecoins can also be partly attributed to the shutdown of BUSD issued by Paxos, in addition to an overall boost in demand for digital assets.
Source: Coin Metrics Network Data
Meanwhile, the supply of MakerDAO’s Dai declined by 13% to 3.2B in Q1. With interest-rates in the US near their peak, demand for crypto-collateralized yields have outpaced the attractiveness of rates offered on US treasury bills, which make up a substantial portion of collateral backing Dai. Increasing competition from high-yielding new entrants like Ethena’s USDe (collateralized by staked ETH and perpetual futures positions in derivatives markets) has also prompted a shift in rates across the ecosystem. In order to prevent a demand shock for Dai and improve its reserve liquidity, Maker raised the Dai Savings Rate from 5% to 15%, incentivizing the adoption of Dai. As a result of these dynamics, stablecoin rates across decentralized finance markets have spiked close to 15%, and have raised the costs of borrowing and leverage across the ecosystem.
Source: Coin Metrics Formula Builder
Along with deepening liquidity, the stablecoin landscape has also grown in diversity. This is exemplified by the introduction of stablecoins such as PayPal’s PYUSD which has had a challenging start to the year with supply declining by 28% since January, the Euro-backed EURCV issued by Société Générale and protocol native stablecoins like Aave’s GHO. Most recently, we also saw the launch of “BlackRock USD Institutional Digital Liquidity Fund” (BUIDL), a tokenized money market fund on Ethereum. These offerings range not only in terms of their collateral backing and risk, but also in the diversity of issuers from financial institutions to DeFi protocols. Furthermore, stablecoin issuance and transfer volumes have also expanded on layer-1 networks such as Solana, in addition to Tron and Ethereum layer-2’s, showcasing their usage across the ecosystem.
Conclusion
As the year’s first quarter draws to a close, the digital asset landscape has experienced transformative growth and pivotal developments that signal a maturing and increasingly diverse market. While speculation and exuberance has pervaded the market, progress has been made on several fronts, from the launch of spot bitcoin ETFs, to infrastructure upgrades and adoption across layer-1 and layer-2 ecosystems paving the way for greater accessibility and innovative use-cases.
Q1 also marks a pivotal turn in market sentiment as we leave behind the shadows that clouded over the industry, with the sentencing of Sam-Bankman Fried. Looking ahead, there are various developments on the horizon that could shape the digital assets industry going forward. The resumption of Coinbase’s case with the SEC, the potential introduction of Ethereum ETFs and Bitcoins fast-approaching 4th halving will undoubtedly keep particpants on their feet.
Network Data Insights
Summary Highlights
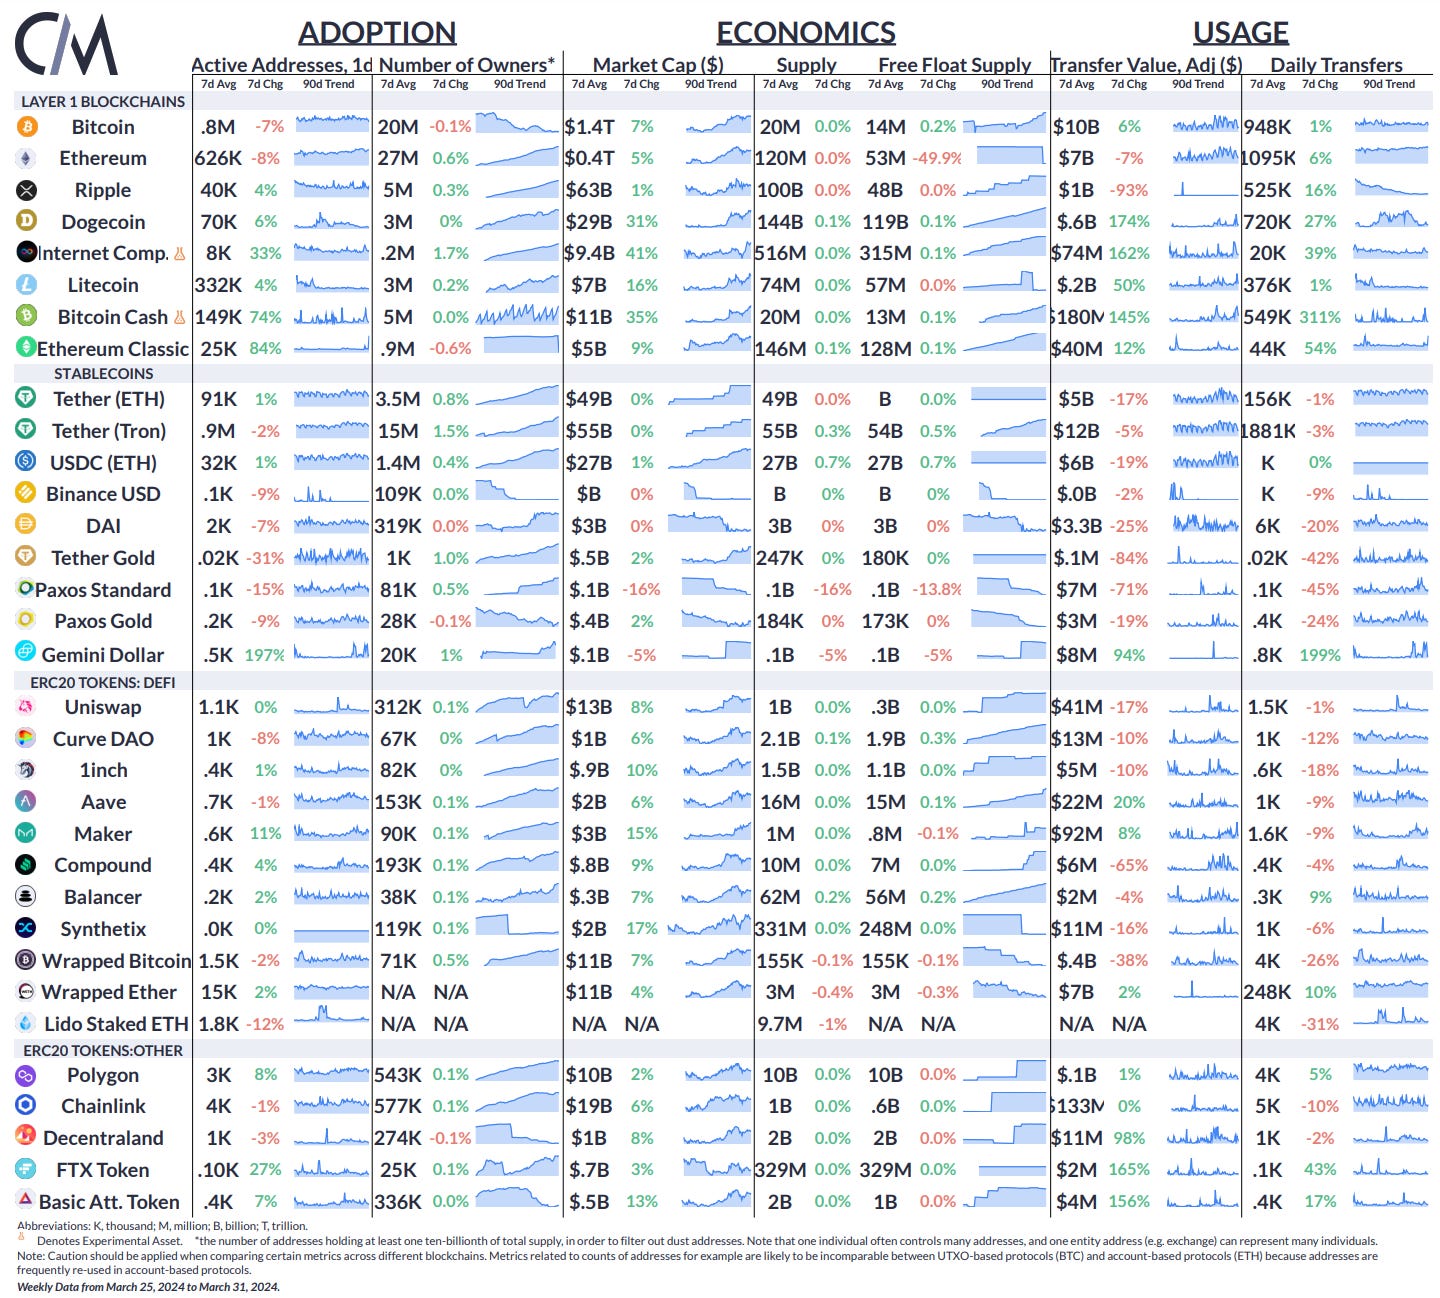
Source: Coin Metrics Network Data Pro
The market capitalization of Bitcoin & Ethereum rose by 7% and 5%, while active addresses fell by 7% and 8% over the week, respectively.
Coin Metrics Updates from Q1
This quarter’s updates from the Coin Metrics team:
Earlier this month we released new metrics around the Ethereum Dencun upgrade, helping you navigate activity around blob usage and fees. Check out the metric coverage here.
We released updates to ETH supply metrics, allowing you to track Ethereum token supply more accurately. Check out SOTN #244 for more context around the adopted methodology.
Follow Coin Metrics’ State of the Market newsletter which contextualizes the week’s crypto market movements with concise commentary, rich visuals, and timely data.
Subscribe and Past Issues
As always, if you have any feedback or requests please let us know here.
Coin Metrics’ State of the Network, is an unbiased, weekly view of the crypto market informed by our own network (on-chain) and market data.
If you'd like to get State of the Network in your inbox, please subscribe here. You can see previous issues of State of the Network here.


