
State of the Network’s Q3 2025 Wrap Up
An overview of developments shaping crypto markets in Q3-2025

Get the best data-driven crypto insights and analysis every week:
State of the Network’s Q3 2025 Wrap Up
Key Takeaways
ETH and select altcoins outperformed BTC in Q3. Spot and perpetual futures volumes climbed to new highs in August before momentum cooled.
Bitcoin long-term holder supply fell by ~507K BTC as prices hit new highs, yet the MVRV Z-score near 2 indicates the market remains well below past cycle peaks.
Structural demand from spot ETFs, the emergence of ETH & SOL digital asset treasuries, and a wave of IPOs continued to broaden market access and push crypto further into mainstream capital markets.
Stablecoins reached a $280B market cap and $3.66T in monthly transfer volume, with competition intensifying post-GENIUS between issuers and new purpose-built chains like Plasma, Arc, and Tempo.
In this issue of State of the Network, we look back at Q3 2025 and the major market trends, on-chain activity, and structural developments that shaped digital assets over the quarter.
Q3 2025 Market Performance: A Rotation Beyond Bitcoin
The quarter began with BTC and ETH surging past $120K and $4.9K, alongside positive returns across equities and gold, before upside momentum faded into consolidation. ETH outperformed over the quarter, supported by renewed inflows into spot ETFs, the emergence of Ether-focused digital asset treasuries (DATs), and tailwinds around its stablecoin dominance following the GENIUS Act.
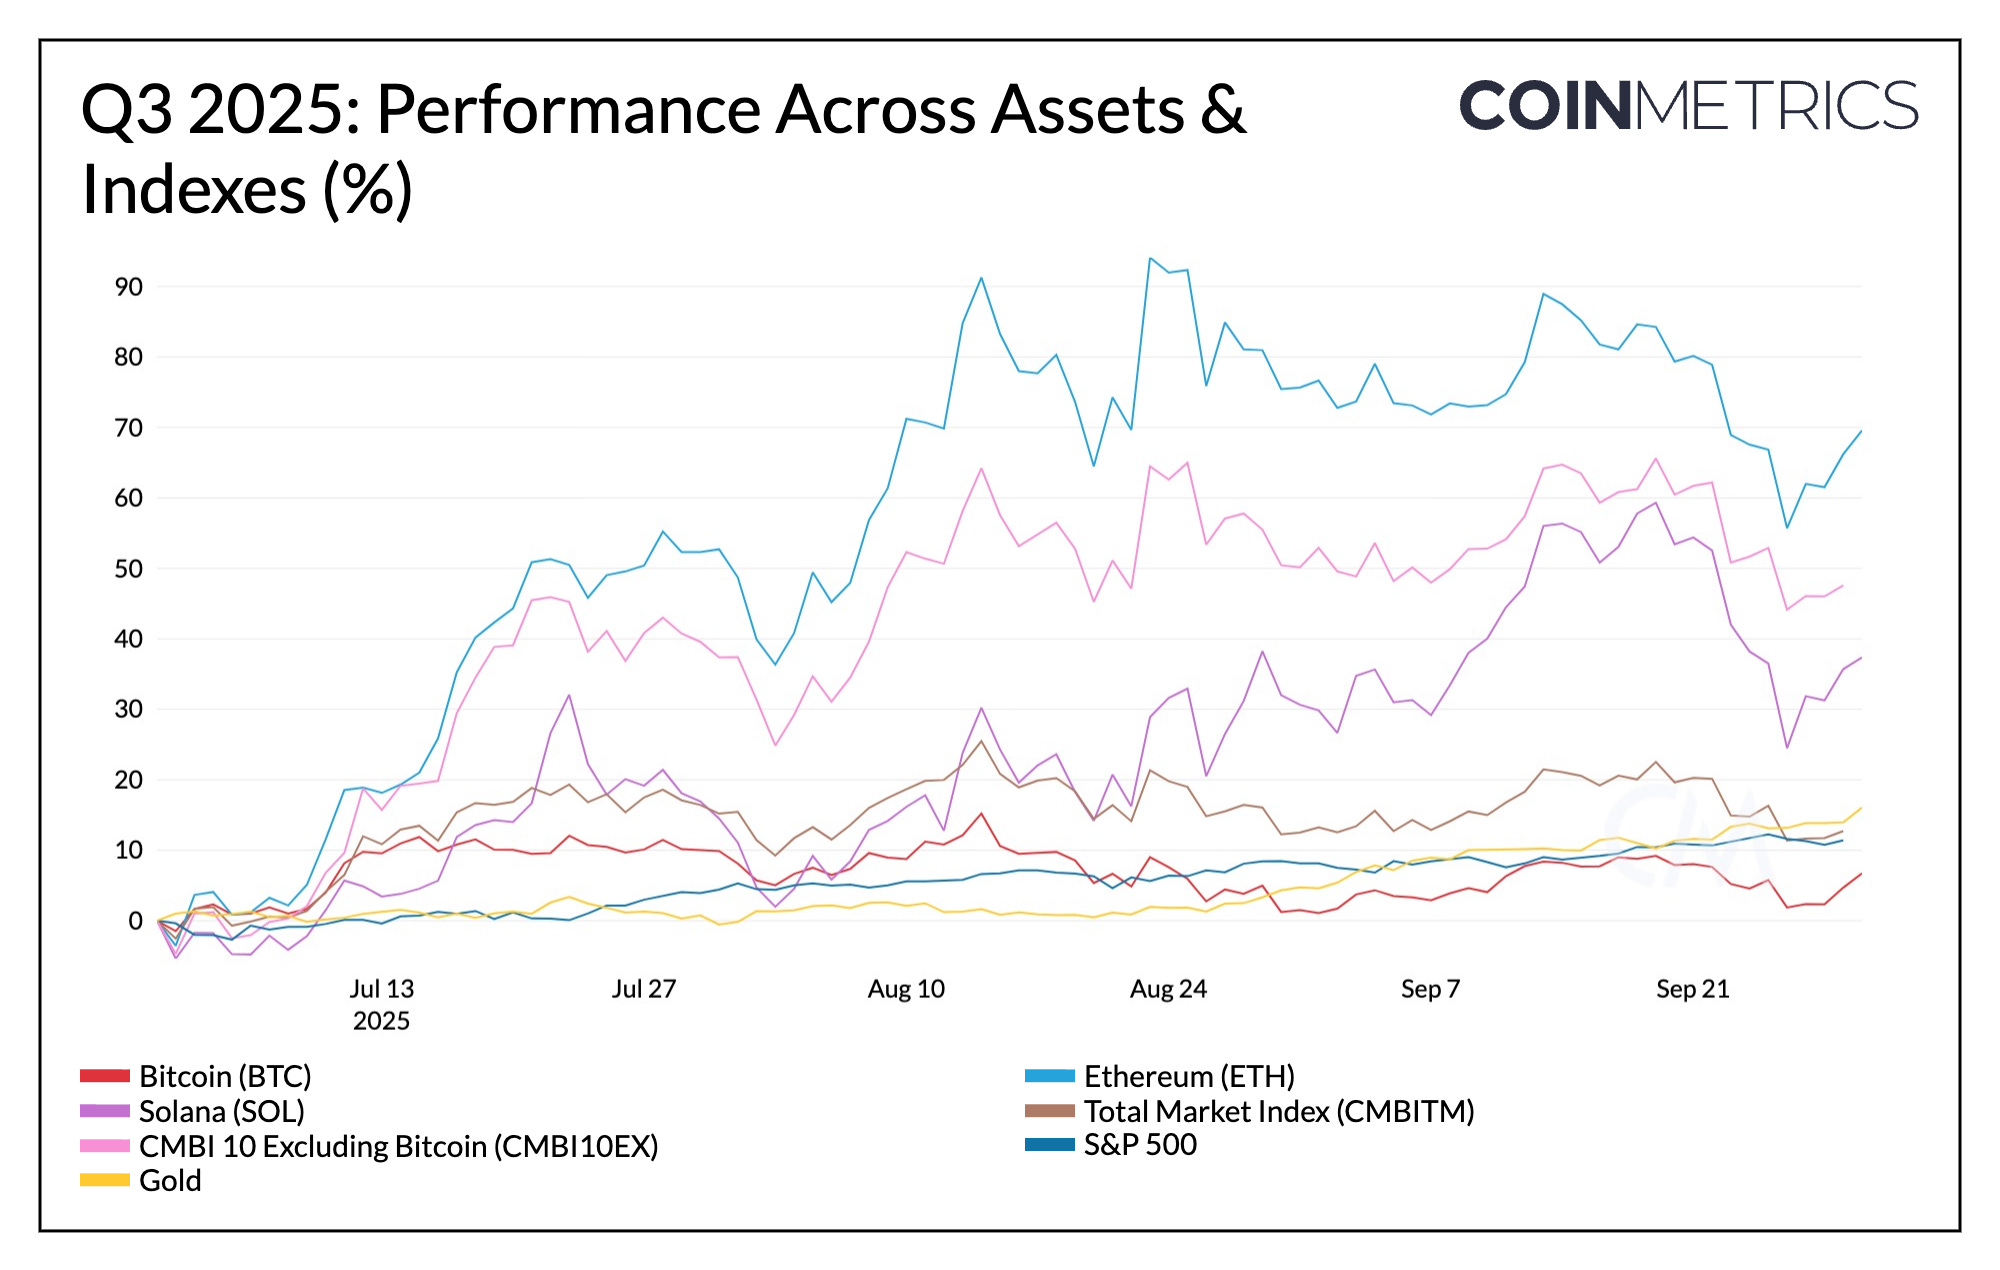
Source: Coin Metrics Reference Rates
The ETH/BTC ratio rose by 62%, reflecting this rotation in leadership, as BTC entered a low volatility phase of distribution. Bitcoin’s market cap dominance declined from 64% to 56% over the quarter, giving room for selective strength in large and mid-cap altcoins, particularly those supported by fundamental growth, ecosystem-specific catalysts, or token demand tied to DAT allocations and potential ETF listings. The CMBI 10 Index (excluding Bitcoin), which measures the performance of a basket of the largest non-bitcoin assets also increased by 45%, underscoring BTC’s relative underperformance to altcoins.
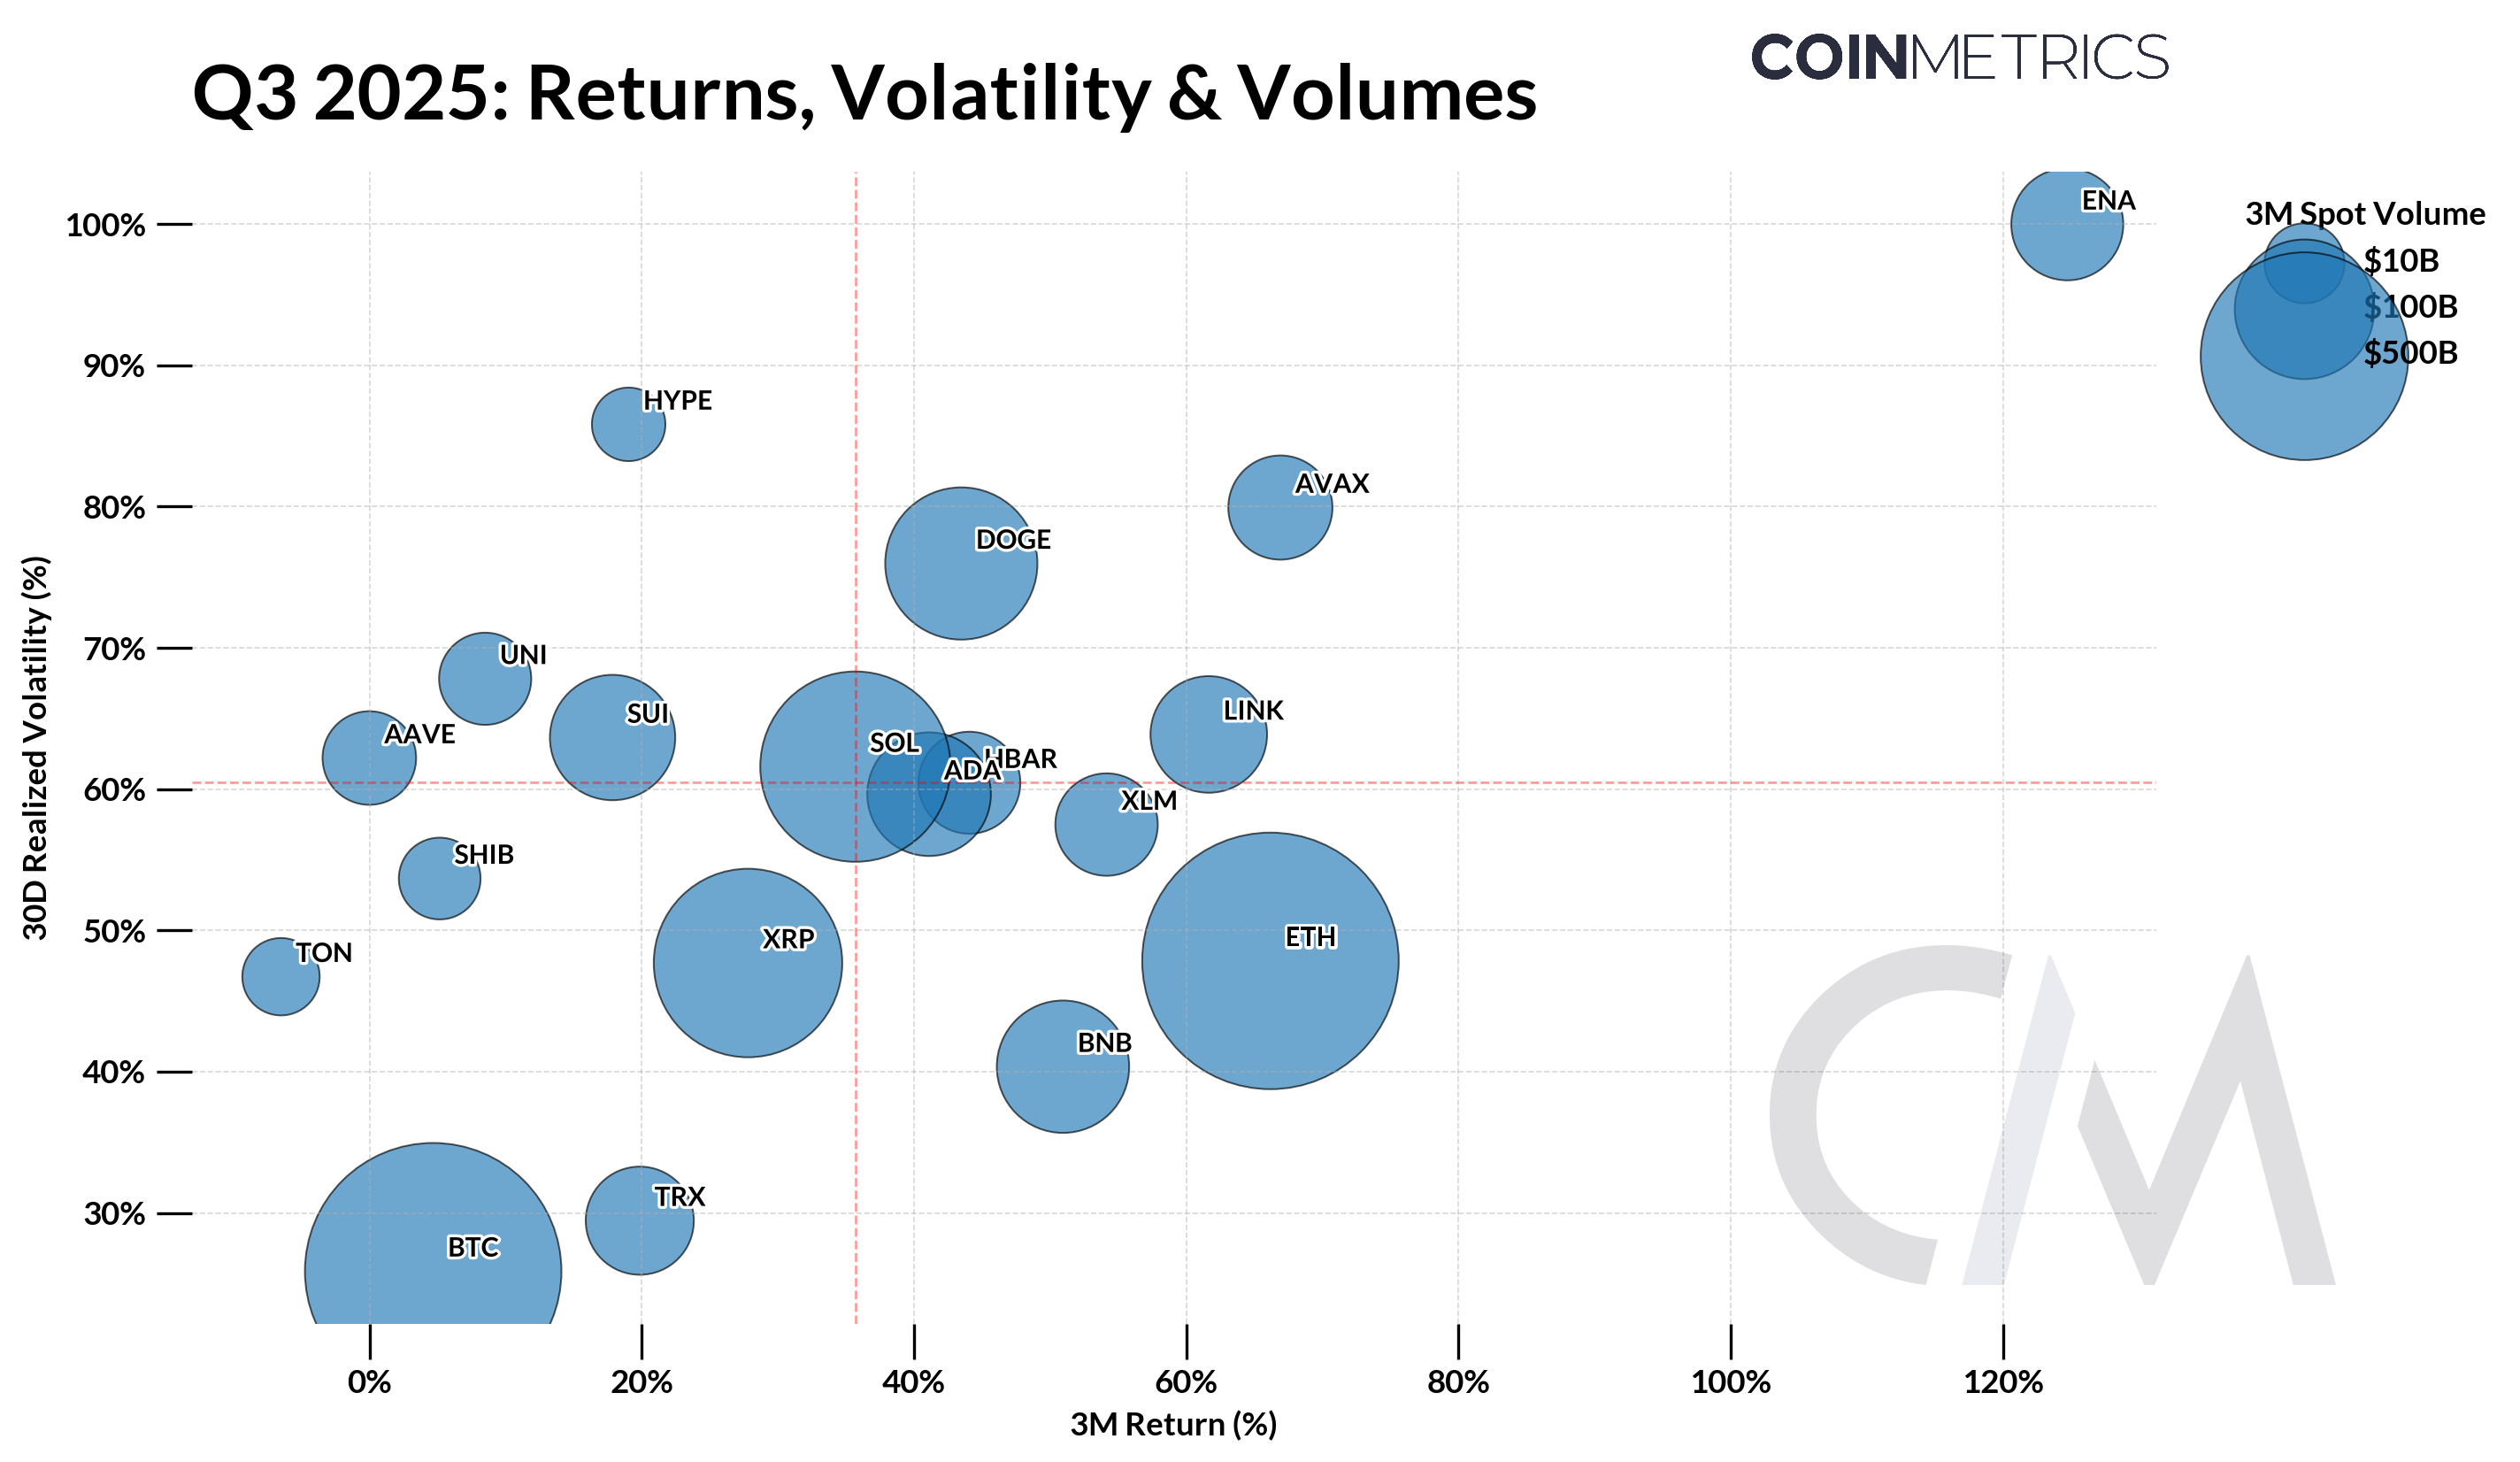
Source: Coin Metrics Market Data Pro & Reference Rates
As shown in the bubble chart, Ethena (ENA), Ethereum (ETH), and Avalanche (AVAX) were among the best-performing tokens in Q3 across the top assets by market cap. Most assets clustered near the median three-month return and realized volatility, underscoring that Q3 was defined by selective dispersion rather than a broad risk-on environment or “alt-season.”
Spot & Futures Exchange Volumes
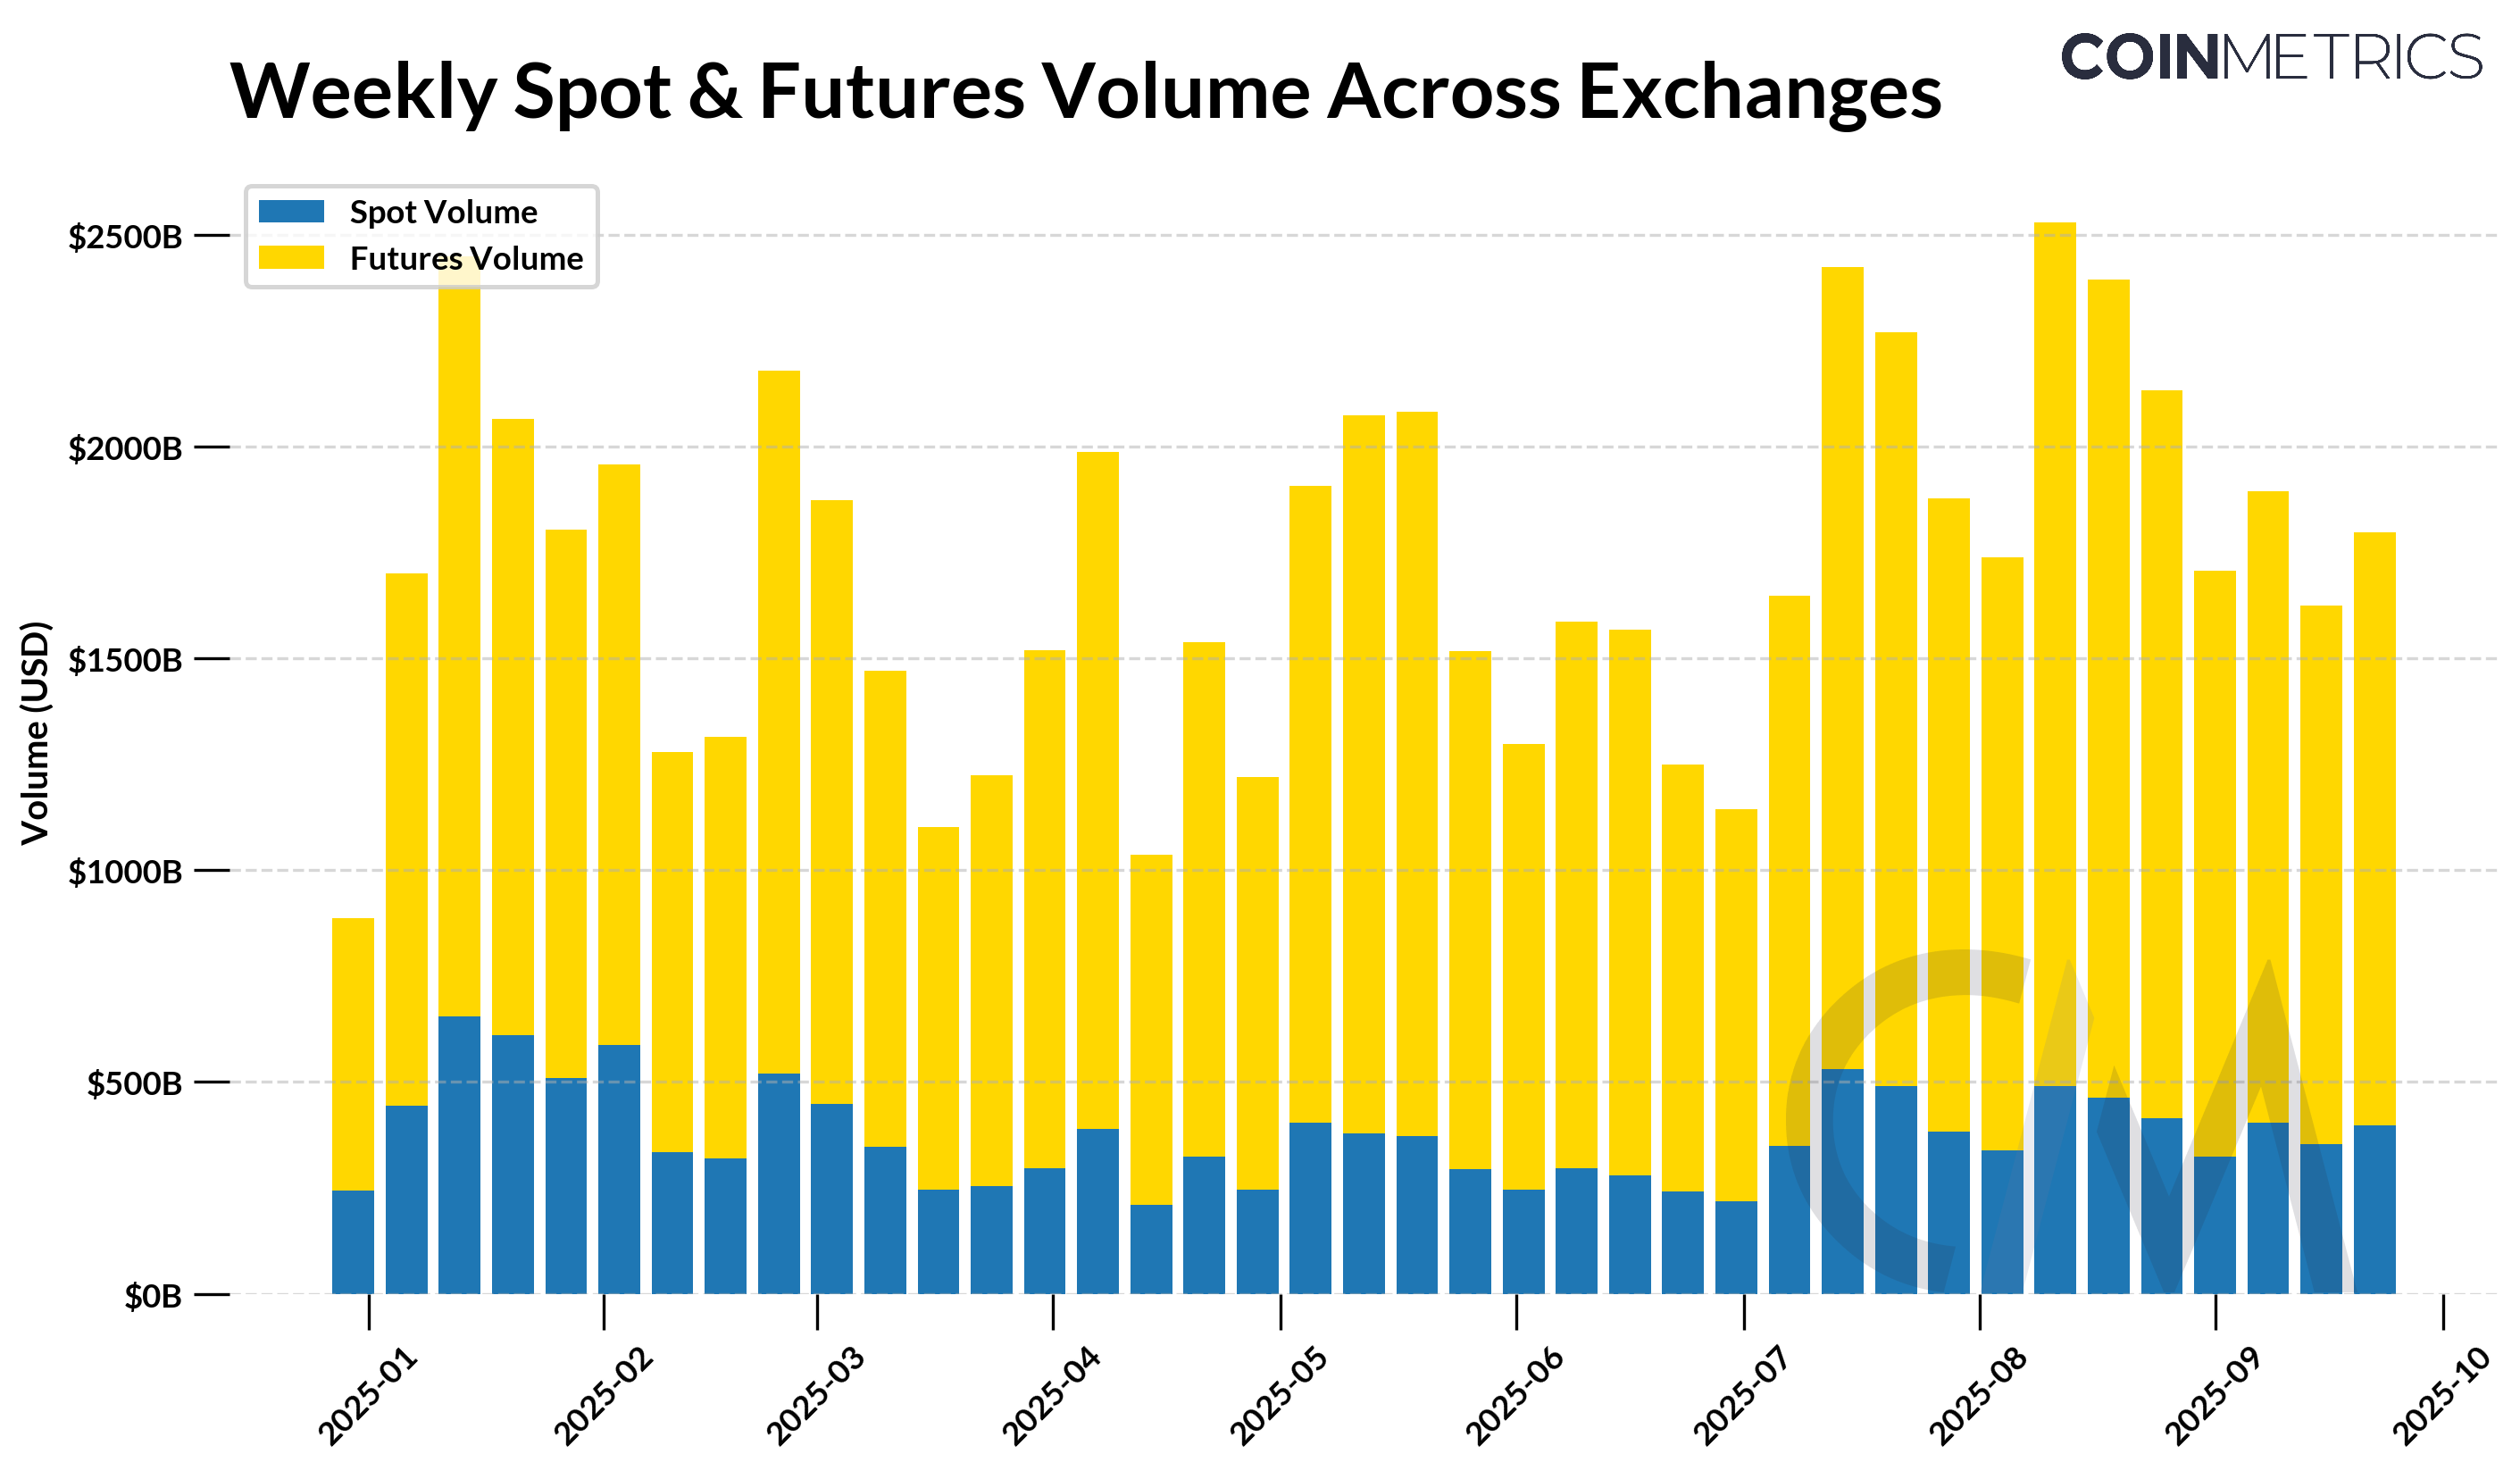
Source: Coin Metrics Market Data Pro
Trading activity picked up across centralized exchanges, with spot volumes rising 29% to $5T and futures volumes up 19% to $19.4T over the quarter. Perpetual futures remained the dominant driver, with leverage amplifying swings and contributing to sharper downside moves late in the quarter.
Regulatory developments in the US created new momentum for bringing these products into regulated channels, with Coinbase launching CFTC-regulated perpetual style futures contracts. At the same time, competition in the perp DEX landscape driven by Hyperliquid and Aster, drew liquidity and attention, capturing the growth of derivatives markets across both off-chain and on-chain venues.
Holder Behaviour & Market Cycle Dynamics
While Bitcoin’s Q3 performance may point to a cyclical rotation in leadership, with capital flowing from BTC towards altcoins, on-chain indicators suggest the market is still some distance from a “cycle top.”
From a valuation perspective, the market value to realized value (MVRV) Z-score, a metric that compares market price to the average cost basis of coins on-chain, is currently near 2. This sits above previous bear-market lows (typically <1) but remains well below prior cycle tops (historically ~7). While cycle behaviour may not play out in identical fashion, the extended length of time between past cycle tops suggests that Bitcoin still has further room for expansion before entering overheated territory.
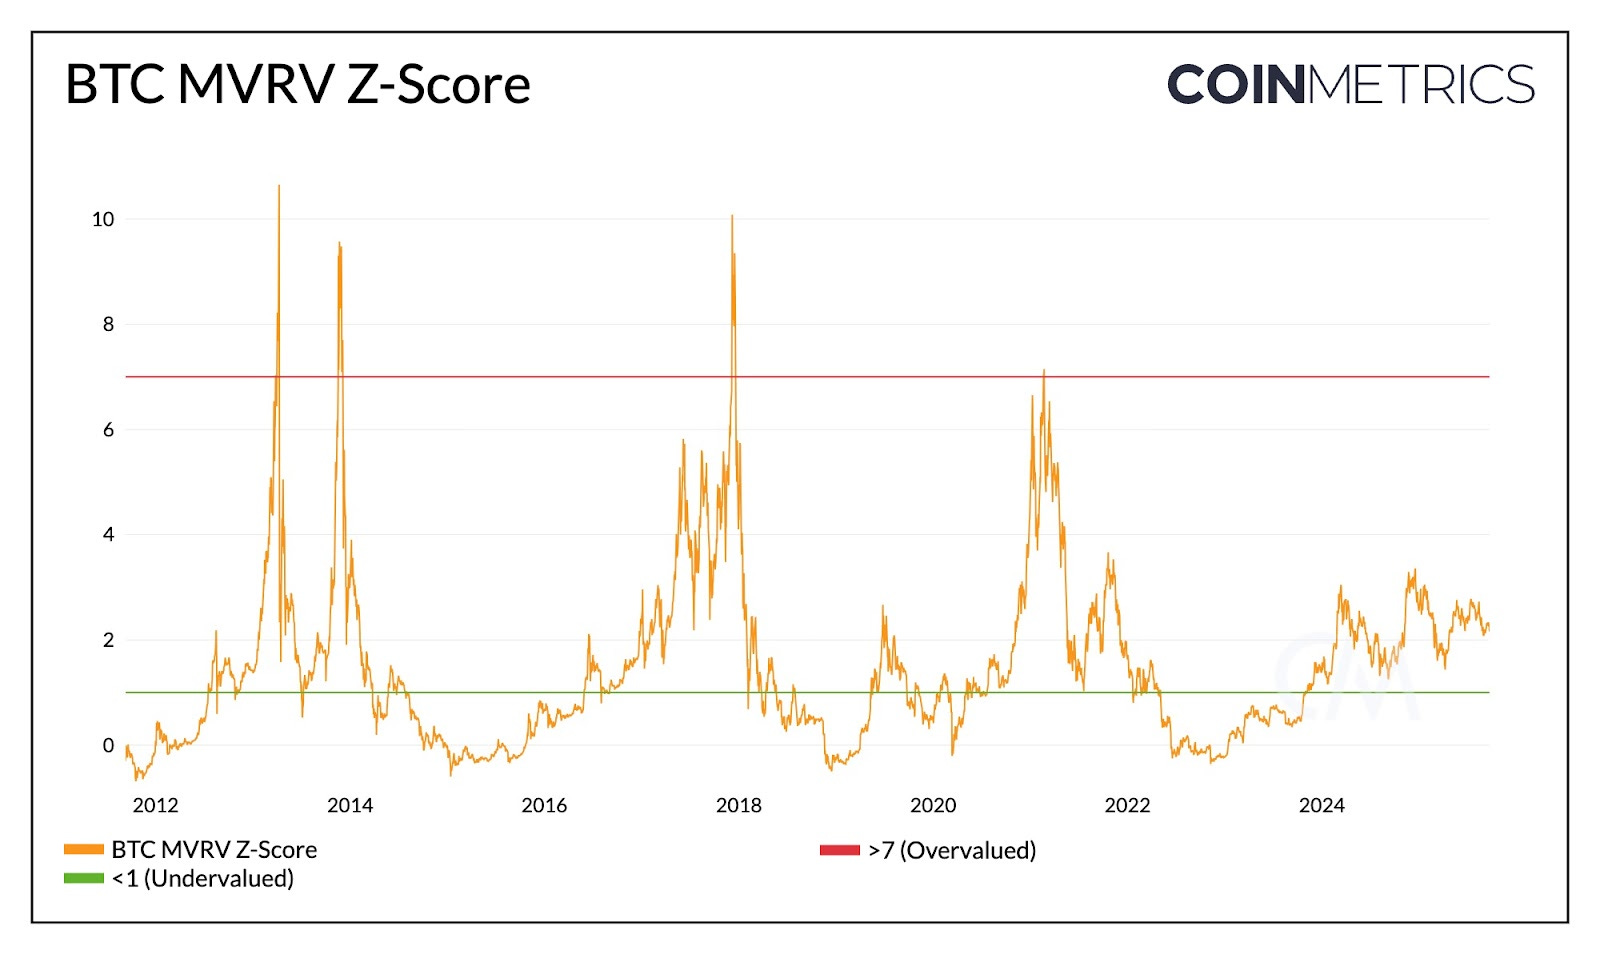
Source: Coin Metrics Network Data Pro
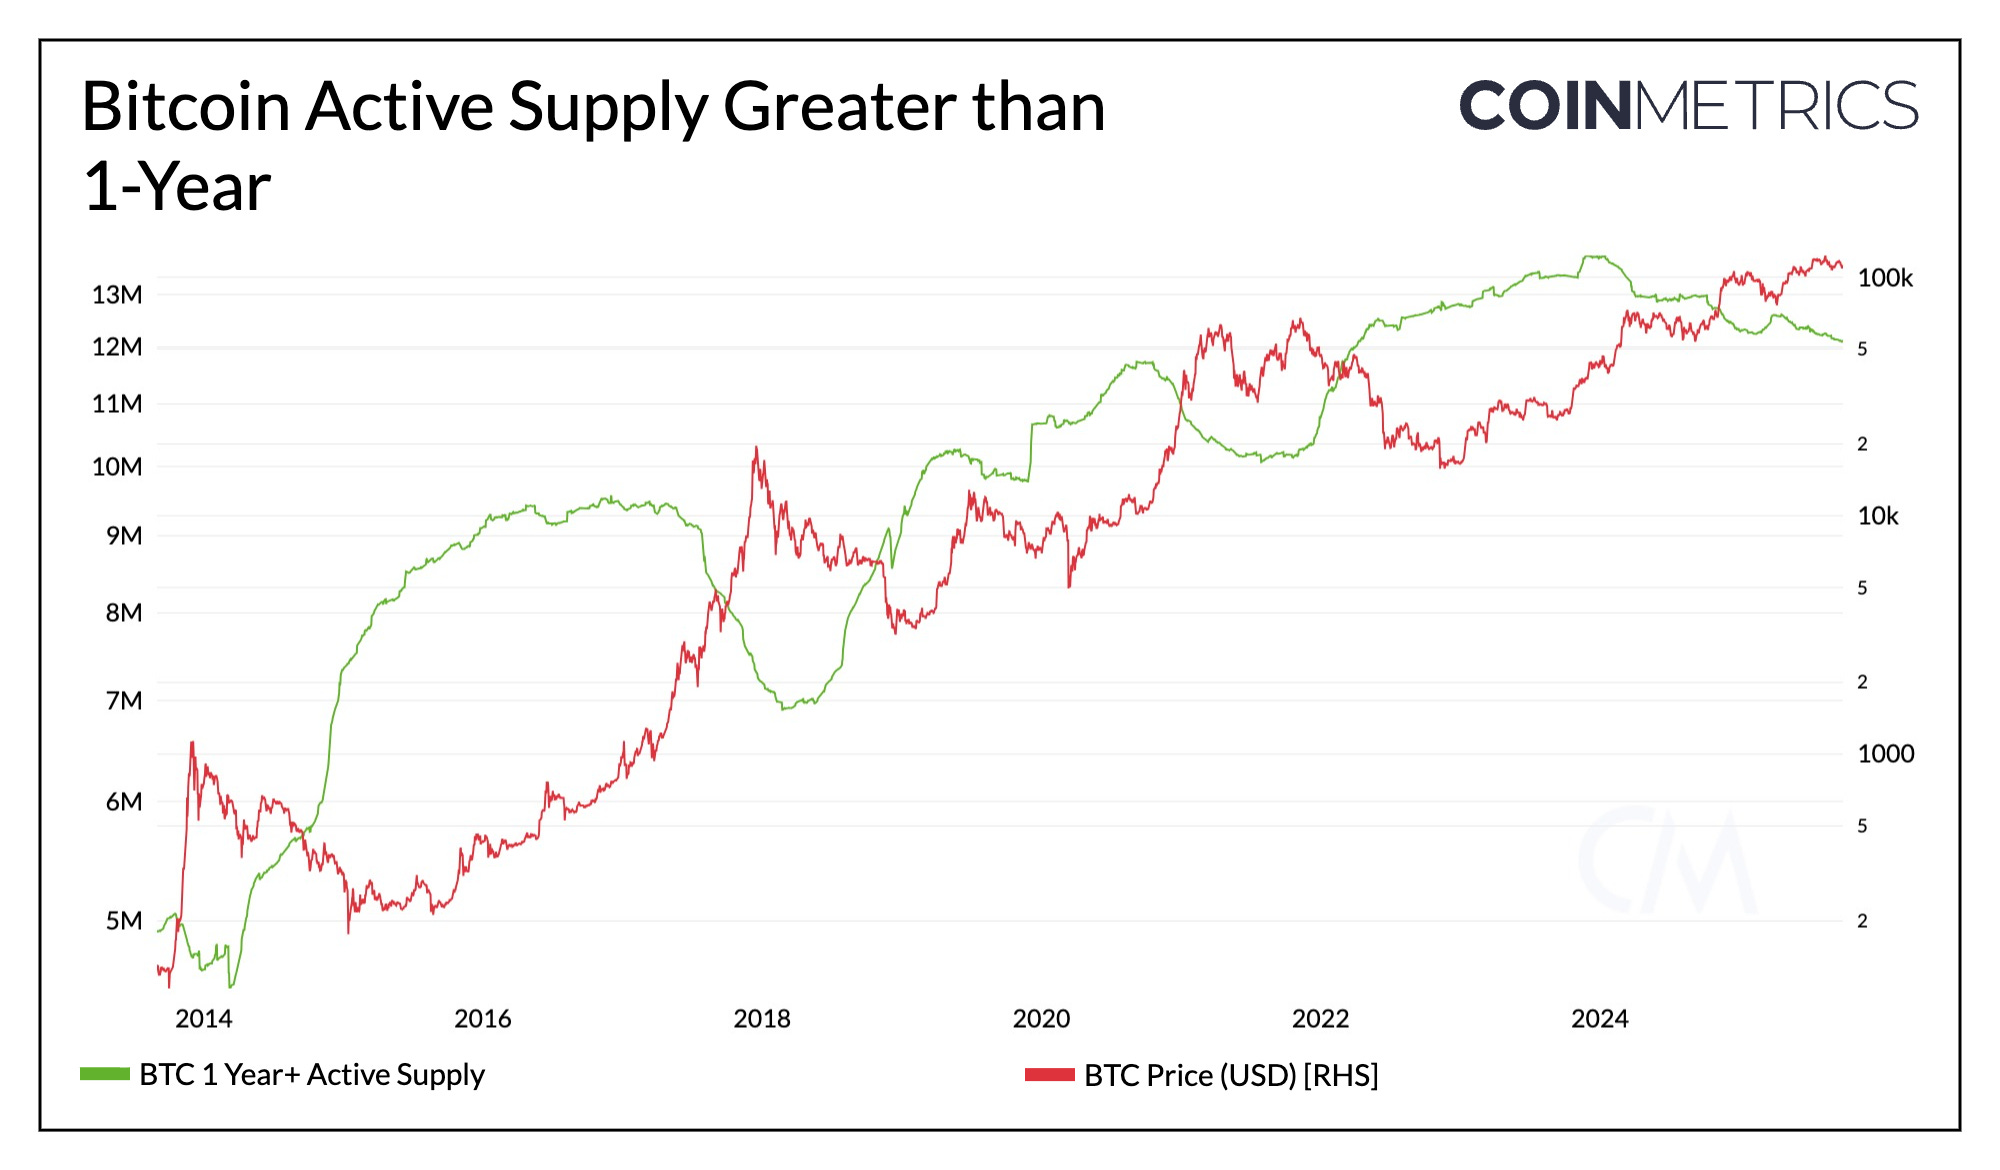
Behavior among long term holders adds further context. The active supply of coins held for more than a year declined by ~507K BTC as it reached new all-time highs. This is consistent with prior phases in bitcoin’s history where long-term holders distribute into strength.
This quarter also saw notable movement from dormant whales alongside one of the largest ever OTC sales, with Galaxy executing a sale of over 80,000 BTC in July on behalf of a “Satoshi-era” investor. These shifts contributed to a decline in whale supply (entities holding between 1K–10K BTC), adding pressure to BTC’s price action this quarter. Yet, this distribution has been counterbalanced by robust market liquidity and steady inflows from spot ETFs and Digital Asset Treasuries (DATs), which have absorbed supply and anchored demand.
Source: Coin Metrics Network Data Pro
ETFs, DATs & IPOs
The influence of spot ETFs and corporate treasuries began to extend beyond Bitcoin in Q3. While BTC accumulation from entities like Strategy slowed (now ~640K), new Ethereum and Solana focused-treasuries emerged, growing holdings through equity issuance and active management of staking and on-chain yields to increase assets per share. In aggregate, DATs now hold about 3.5% of BTC, 3.3% of ETH, and 2.3% of SOL, with newer cohorts accumulating at a faster pace. On the ETF front, Ethereum spot ETFs saw accelerating inflows while Bitcoin ETF holdings steadied. The rollout of new ETF listing standards is also paving the way for altcoin ETFs and multi-asset products, broadening investor exposure beyond BTC and ETH.
Activity in public markets reinforced this trend, with stablecoin issuers, lenders, and exchanges moving toward IPOs or large raises, from Circle’s billion-dollar IPO to Bullish’s $629M listing, Kraken’s $500M funding round, and Tether seeking a $20B raise. Together, ETFs, treasuries, and IPOs mark a structural shift in ownership, moving crypto further into mainstream capital markets and creating durable channels of institutional demand.
Stablecoin Issuer & Blockchain Wars
Stablecoins entered Q3 with renewed momentum after the GENIUS Act’s passage, pushing the total market cap to $280B. Monthly stablecoin adjusted transfer volume reached $3.66T in September, with growth expectations accelerating as use-cases broaden beyond trading and savings into consumer-facing and B2B payments (and even the agentic web).
This backdrop has intensified competition among issuers, with launches like Tether’s USAT and application-specific ones like USDH, alongside the rollout of stablecoin-focused blockchains such as Plasma, Circle’s Arc, and Stripe’s Tempo. The sector is now defined by two overlapping battles: between issuers, and between blockchains vying to capture stablecoin activity.
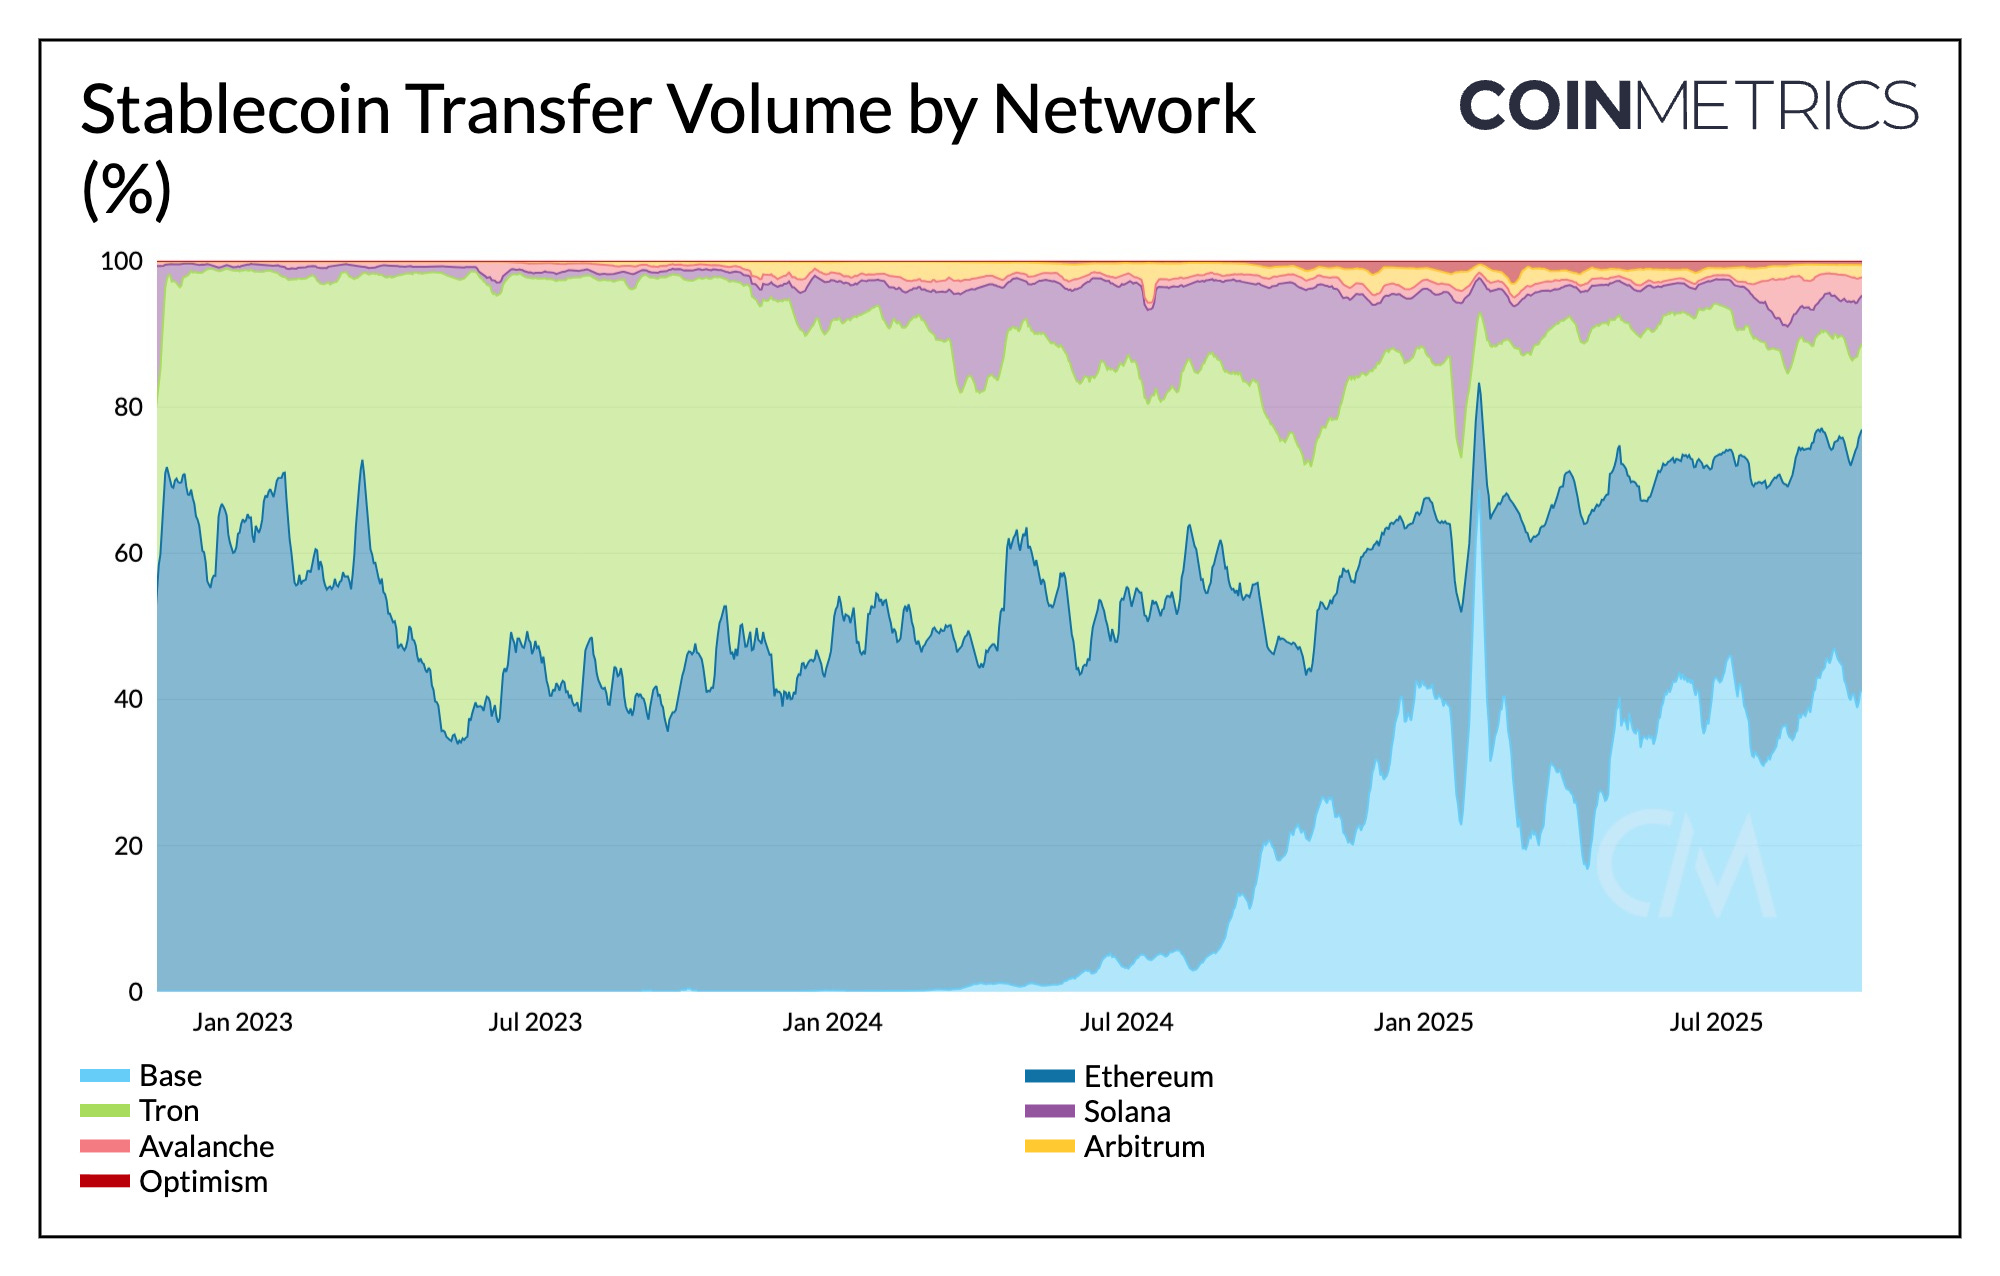
Source: Coin Metrics Network Data Pro
In Q3, Base and Ethereum saw their share of stablecoin transfer volume grow, while Tron experienced a contraction. The majority of share of stablecoin transaction volumes today remain concentrated across general purpose chains, but their dominance and end-usage patterns differ:
Ethereum: High-value, low-frequency transfers, particularly for institutional settlement and DeFi use-cases.
Base: Driven largely by USDC, with traction in consumer and fintech-style use cases.
Tron: Dominated by USDT in emerging markets, with low-cost, cross-border retail payments.
Solana: Low-value, high-velocity transfers, supported by its throughput and low fees for retail and micro-transactions.
Purpose-built networks like Plasma, Arc, and Tempo are emerging to address the tradeoffs in general-purpose architectures, offering infrastructure optimized for stablecoin use-cases, and features like gas-free transfers, stablecoins as gas tokens, predictable low fees and high-throughput settlement.
While these chains could siphon some activity away from existing ones, they might also segment the market further into overlapping niches. Plasma’s launch this week, which quickly attracted stablecoin supply and positioned itself around emerging market distribution through gas-free USDT transfers and neobank-style services, illustrates how purpose-built chains may shape adoption going forward.
Looking Ahead to Q4
Q3 saw a market in transition as Bitcoin cooled after setting fresh highs, Ethereum regained momentum, and altcoins showed selective strength. Beneath the surface, structural demand from spot ETFs, new cohorts of digital asset treasuries, and crypto IPOs continued to reshape market access and ownership. Meanwhile, competition over perpetual futures and the race to dominate stablecoin settlement accelerated, driven by regulatory tailwinds and maturing on-chain infrastructure.
Looking ahead, recent rate cuts and global liquidity could revive risk appetite, with structural demand from ETFs, DATs, and stablecoins providing a durable floor. With greater regulatory clarity, expanding institutional access, and maturing on-chain infrastructure, the market enters Q4 on a strong foundation.
Coin Metrics Updates
This quarter’s updates from the Coin Metrics team:
Follow Coin Metrics’ State of the Market newsletter which contextualizes the week’s crypto market movements with concise commentary, rich visuals, and timely data.
This quarter, we introduced new Research Metrics to support advanced market and on-chain analysis and launched Aggregated Stablecoin Metrics to provide unified, cross-network visibility for stablecoins.
As always, if you have any feedback or requests please let us know here.
Subscribe and Past Issues
Coin Metrics’ State of the Network, is an unbiased, weekly view of the crypto market informed by our own network (on-chain) and market data.
If you’d like to get State of the Network in your inbox, please subscribe here. You can see previous issues of State of the Network here.