Get the best data-driven crypto insights and analysis every week:
Analyzing Wrapped Bitcoin Usage on Ethereum
By Kyle Waters and Nate Maddrey
The growth of decentralized finance (DeFi) applications has accelerated demand for tokenized assets that can be traded, lent out, and borrowed with limited intermediation on crypto financial rails. The rise of U.S. dollar-pegged stablecoins – worth in aggregate over $150B today – is one primary example. But another is the increasing role of tokenized (aka wrapped) bitcoins (BTC) that are proliferating across smart contract platforms like Ethereum. Today for roughly every 72 bitcoins, 1 is tokenized on Ethereum. In this week’s SOTN, we jump into the latest on-chain data behind wrapped bitcoin (wBTC), the tokenized version of BTC on Ethereum, and analyze its current role and use cases.
wBTC is an ERC-20 token on Ethereum that is backed 1:1 and redeemable for actual BTC held in custody, not unlike the model of dollar reserves held by a USD stablecoin issuer such as Circle’s USDC. wBTC launched in late 2018 and was spearheaded by a consortium of industry players that first included Kyber Network, Republic Protocol (Ren), and BitGo.
To create (aka mint) new wBTC, users interact with pre-approved entities called merchants which send the underlying BTC to a custodian (currently BitGo, which holds the BTC in a multi-signature wallet) which then mints the corresponding wBTC tokens on Ethereum. This process can be put in reverse, removing (aka burning) wBTC from circulation on Ethereum and returning the locked BTC held by the custodian back to the user on the base Bitcoin layer.
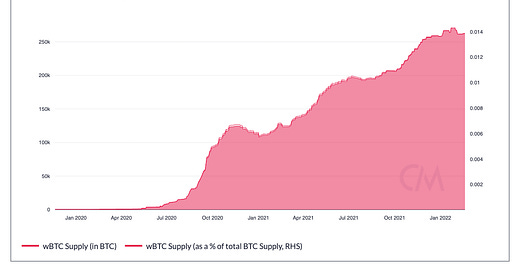
Wrapped tokens have enabled a material amount of BTC to flow into the Ethereum ecosystem. There are now over 250K BTC on Ethereum, or about 1.4% of total BTC supply. Growth in new wBTC supply has stagnated since December 2021, though.
Source: Coin Metrics Charting Tool
In addition, wBTC adoption has accelerated with over 43K Ethereum addresses now counting a positive balance of wBTC.
Source: Coin Metrics Charting Tool
To date, wBTC has maintained a stable wBTC/BTC peg and hasn’t diverged significantly from BTC’s price. The price discrepancy tightened significantly when wBTC supply increased during the explosion of DeFi on Ethereum in summer 2020.
wBTC’s liquidity profile also improved as it was listed on centralized exchanges, allowing traders to easily arbitrage away any price difference. But spot volume is only about $40M per day on centralized exchanges, compared to BTC’s $8B. Volume on decentralized exchanges (DEXs) is generally higher: there was over $60M of wBTC traded on Uniswap V3 in the last 24H for example.
Source: Coin Metrics Charting Tool
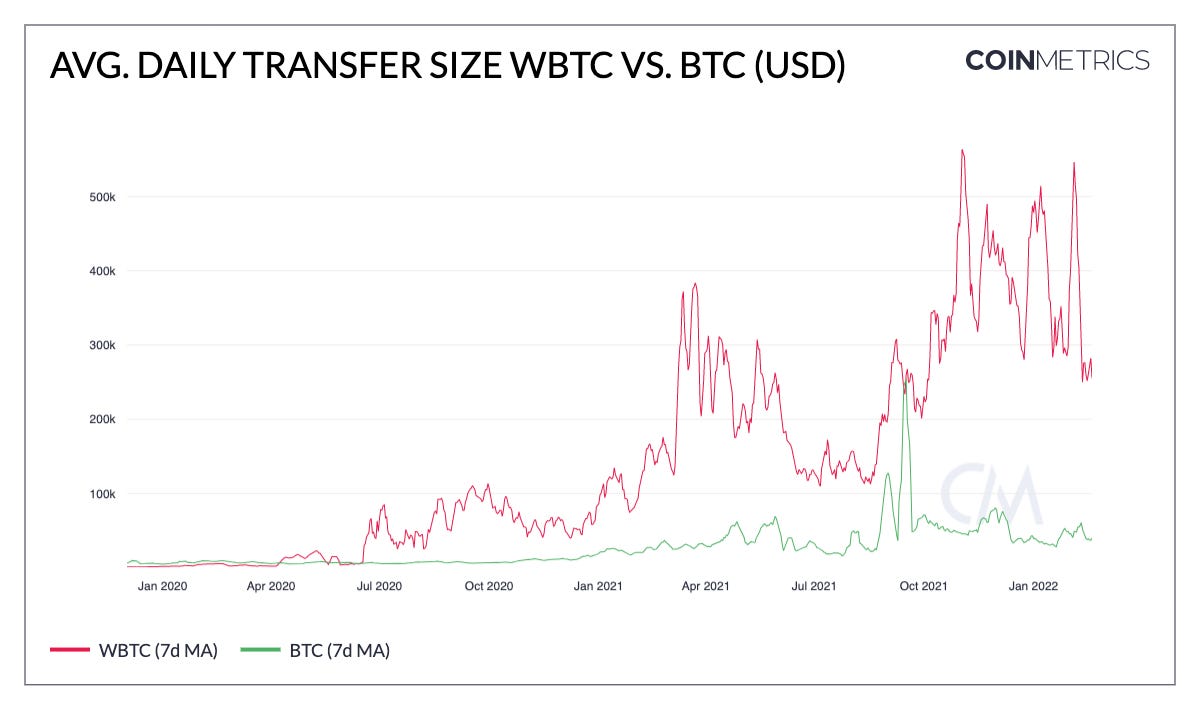
Better wBTC liquidity and more opportunities across DeFi apps has helped incentivize BTC to flow to Ethereum to be used in smart contracts. As a result, there is a noticeable difference in the on-chain footprint of BTC vs. its wrapped instance on Ethereum. The average daily transfer size of wBTC vs. BTC is generally ~7x larger with the typical wBTC transfer size at $280K vs. $40K for BTC on the base layer.
Source: Coin Metrics Charting Tool
This is evidence that wBTC is put to use within DeFi applications such as DEXs for trading and lending protocols as collateral.
Currently 66% of all wBTC supply is currently held by smart contracts. Of these, the largest holder of wBTC today on Ethereum is the Maker system, the algorithmic lending protocol behind the DAI stablecoin. wBTC was first approved as a collateral type within the Maker system in May 2020 allowing users to deposit an over-collateralized amount of wBTC and receive DAI in return. There is now about 56K wBTC within Maker, accounting for about one fifth of all wBTC supply. wBTC now encompasses a much larger portion of the total collateral backing all DAI.
DEXs also account for a big share of wBTC supply and total transfer value. On Uniswap v3, the largest pool by total wBTC locked is the WBTC-WETH (wrapped ETH, 0.3% fee tier) pool accounting for about 2.7K wBTC. A total of about 6K wBTC are held in the following five Uniswap V3 pools:
Finally, as other smart contract platforms outside of Ethereum gain traction and users, wBTC has been migrating to these other networks via bridges. Over 20K wBTC are now held in the Avalanche bridge contract – currently the fourth largest address by balance – though its balance has slowed since the beginning of 2022.
With over 250K wBTC and total market cap of ~$10B, wBTC’s adoption and importance within DeFi is growing and developing quickly. But wBTC also introduces new questions. One is the impact on Bitcoin’s base layer. If a larger pool of BTC is sitting idle on Bitcoin while moving around on Ethereum and other chains, it could mean less transaction fees accruing to Bitcoin miners. However, given the predominance of the block reward vs. miner fees, this is a longer-term consideration as BTC block rewards continue to decrease through time. Liquidity during times of market volatility and the integrity of cross-chain bridges are other items to consider. But despite this, wBTC’s growth is also evidence of BTC’s growing role as a reserve asset within the crypto ecosystem.
To follow the data used in this piece and explore our other on-chain metrics check out our free charting tool, formula builder, correlation tool, and mobile apps.
Network Data Insights
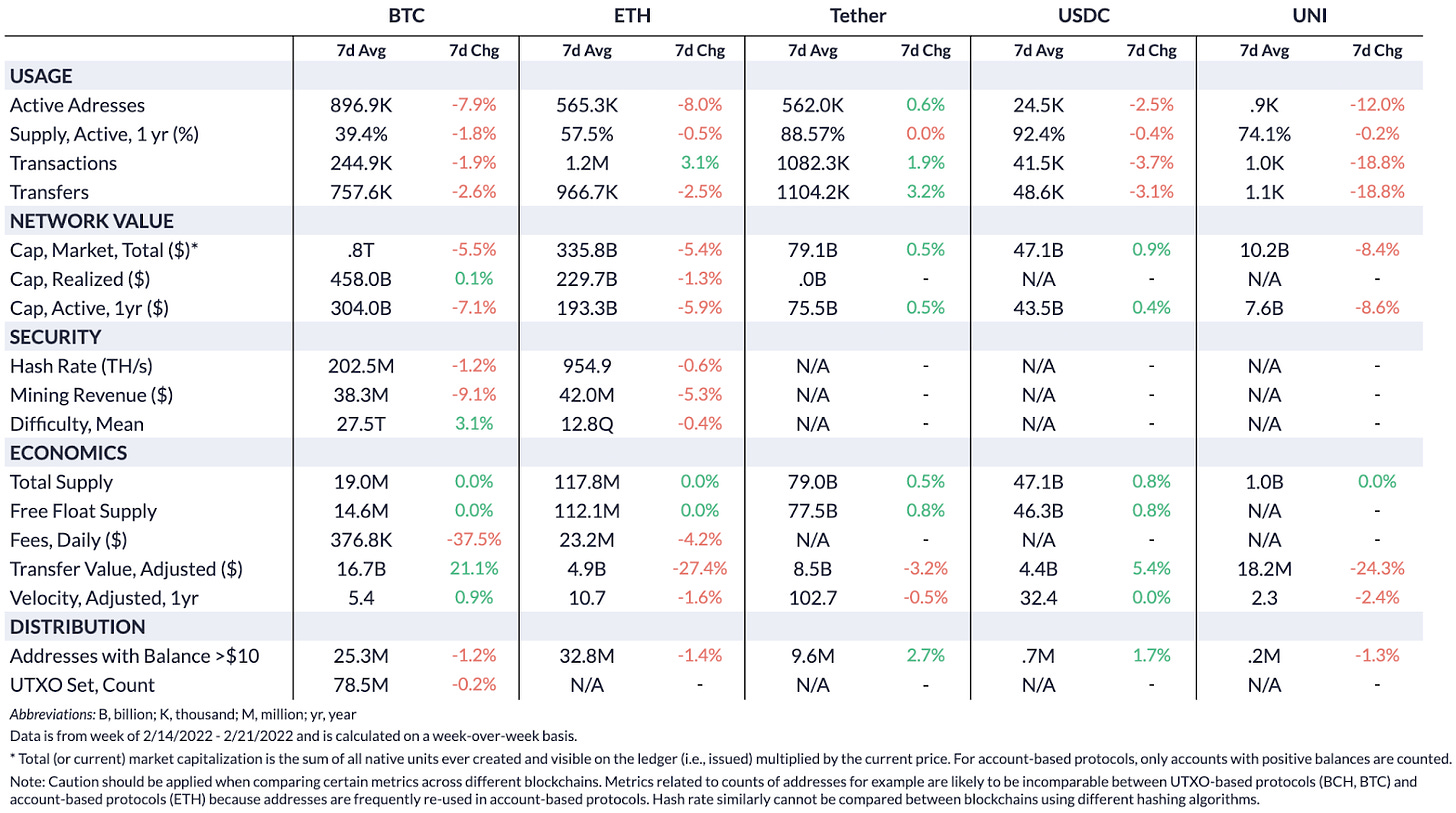
Summary Metrics
Source: Coin Metrics Network Data Pro
Most on-chain metrics dipped on the week as the crypto markets tumbled in the face of more global uncertainty. BTC and ETH active addresses both dropped about 8% week-over-week. Despite the drop, stablecoin supplies stayed relatively stagnant, with Tether (USDT) and USDC supply growing by 0.5% and 0.8%, respectively.
Network Highlights
On Saturday, OpenSea was hit with a phishing attack that temporarily threw the NFT world into a state of chaos as over the course of a few hours the attacker stole millions of dollars worth of NFTs. Although the investigation is still ongoing, the OpenSea team determined that the attacker tricked their targets into signing malicious sell orders that did not originate from the OpenSea contract.
But despite the attack, NFT transfers (ERC-721) barely slowed down over the weekend. ERC-721 transfers dropped to 284K on February 19th before bouncing back close to all-time highs.
Source: Coin Metrics Charting Tool
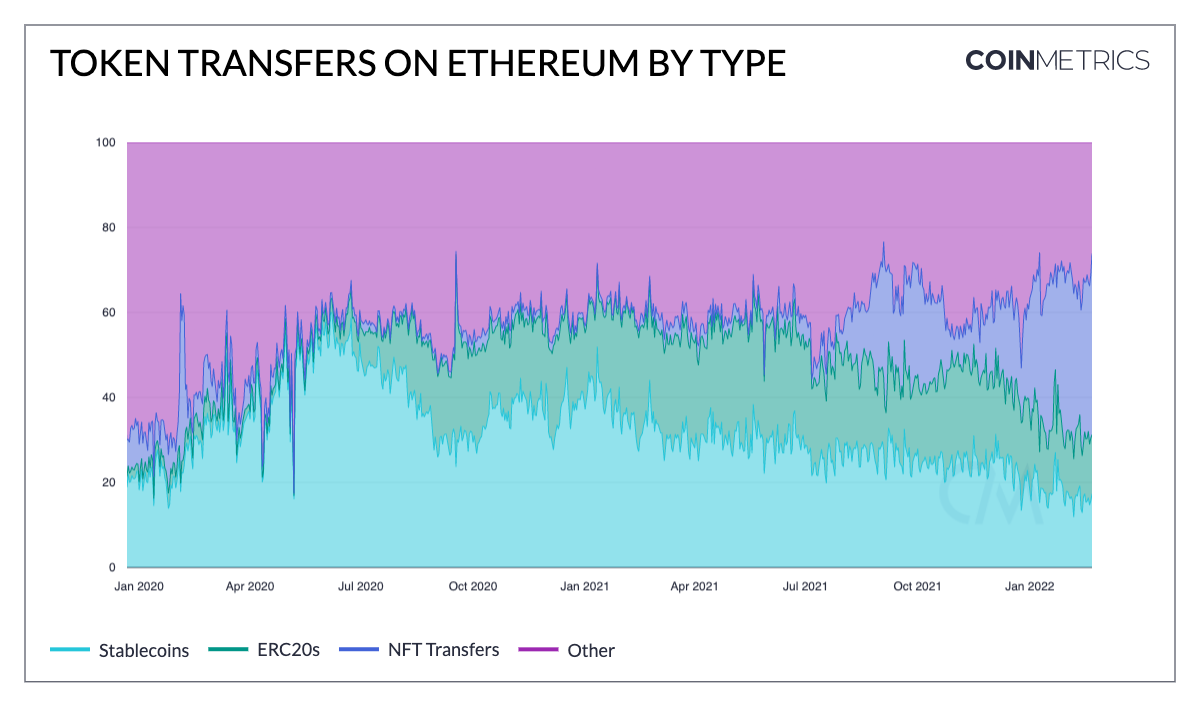
Since July 2021, NFT’s share of total Ethereum token transfers has overtaken stablecoins and the major ERC-20s. The below chart shows the percent share of token transfers by different categories using a sample of the largest ERC-20s and stablecoins by market cap compared to ERC-721 transfers.
Source: Coin Metrics Charting Tool
Coin Metrics Updates
This week’s updates from the Coin Metrics team:
Check out our market-data focused newsletter State of the Market, featuring weekly updates on market conditions.
Coin Metrics is hiring across Research, Data Science, Growth and more! Check out our open positions here.
Also check out the Coin Metrics mobile app. View real-time cryptoasset pricing and relevant on-chain data in a single app! Download for free here: https://coinmetrics.io/mobile-app/
As always, if you have any feedback or requests please let us know here.
Subscribe and Past Issues
Coin Metrics’ State of the Network, is an unbiased, weekly view of the crypto market informed by our own network (on-chain) and market data.
If you'd like to get State of the Network in your inbox, please subscribe here. You can see previous issues of State of the Network here.
Check out the Coin Metrics Blog for more in depth research and analysis.
© 2022 Coin Metrics Inc. All rights reserved. Redistribution is not permitted without consent. This newsletter does not constitute investment advice and is for informational purposes only and you should not make an investment decision on the basis of this information. The newsletter is provided “as is” and Coin Metrics will not be liable for any loss or damage resulting from information obtained from the newsletter.


