Coin Metrics' State of the Network: Issue 108
Tuesday, June 22nd, 2021
Get the best data-driven crypto insights and analysis every week:
And check out our new market-data focused weekly newsletter State of the Market.
Weekly Research Focus
Analyzing Bitcoin Dominance and the Altcoin Boom
By Nate Maddrey and the Coin Metrics Team
Bitcoin dominance dropped to under 40% on May 18th, just days before bitcoin (BTC) price crashed to its lowest levels since January. Bitcoin dominance is a measure of BTC’s share of total crypto market capitalization. The last time it dropped below 40% was July, 2018.
The following chart shows a proxy of BTC dominance against about 100 of the largest altcoins (which in this case refers to any cryptoasset other than BTC) using the free float version of market capitalization. This version of BTC dominance does not include the long tail of thousands of smaller-cap assets, but the assets included make up a large majority of the total market cap.
Source: Coin Metrics Network Data Charts
Altcoins total market capitalization peaked at over $1 trillion on May 11th, right before the market started to tumble. BTC’s free float market cap peaked about a month earlier in mid-April. A similar pattern occurred in the 2017/2018 run when BTC topped out in December 2017 and most altcoins reaching their top a month later in January.
In both cases, the surge of new altcoins diverted some capital away from BTC and spread it out across small-cap assets, many of which later died out. During the current cycle Dogecoin (DOGE), Shiba Inu (SHIB), and other meme coins have grown to market caps of tens of billions of dollars, attracting retail investors as well as mainstream media attention.
Source: Coin Metrics Network Data Charts
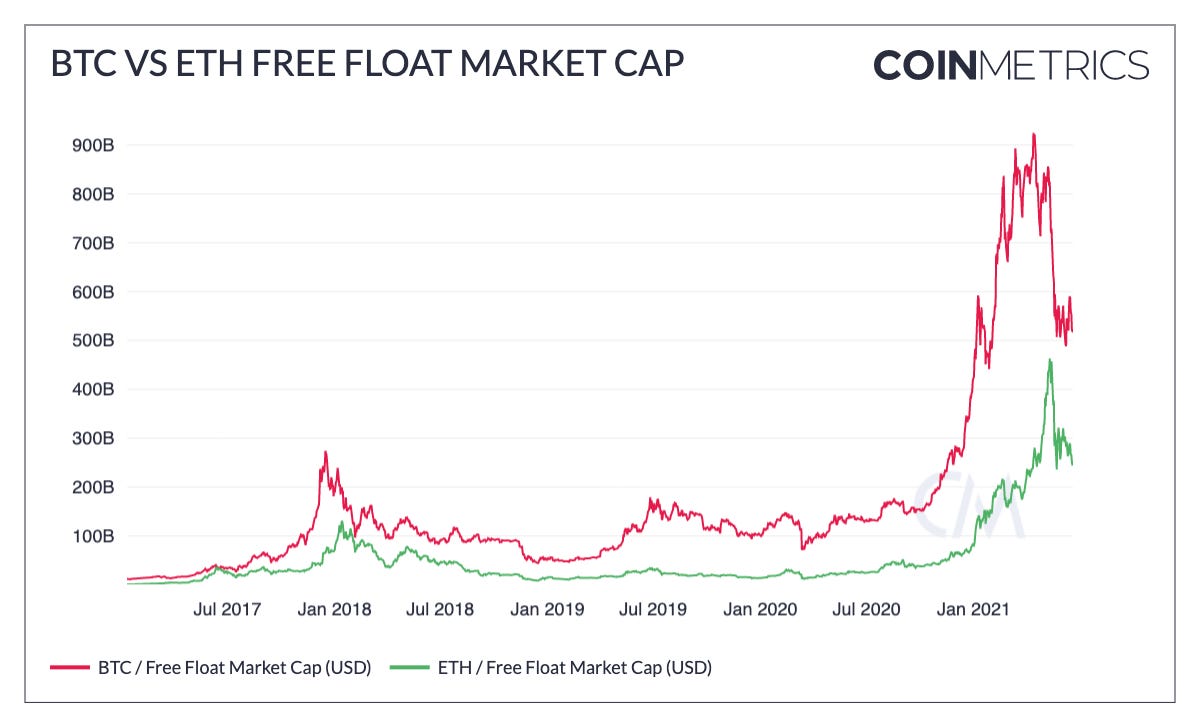
This year’s rise was partially due to Ether (ETH) which soared to a free float market cap of over $460B. But at its peak ETH made up less than 45% of the total altcoin market cap. Assets like Ripple (XRP), Cardano (ADA), Binance Coin (BNB), and DOGE also surged, pushing altcoin market cap to its new all-time high.
Source: Coin Metrics Network Data Charts
The ratio of BTC market cap to altcoins market cap peaked in January when BTC price topped $40K for the first time. It peaked again in late March before tumbling down in April and May as altcoin market caps started to surge.
Source: Coin Metrics Network Data Charts
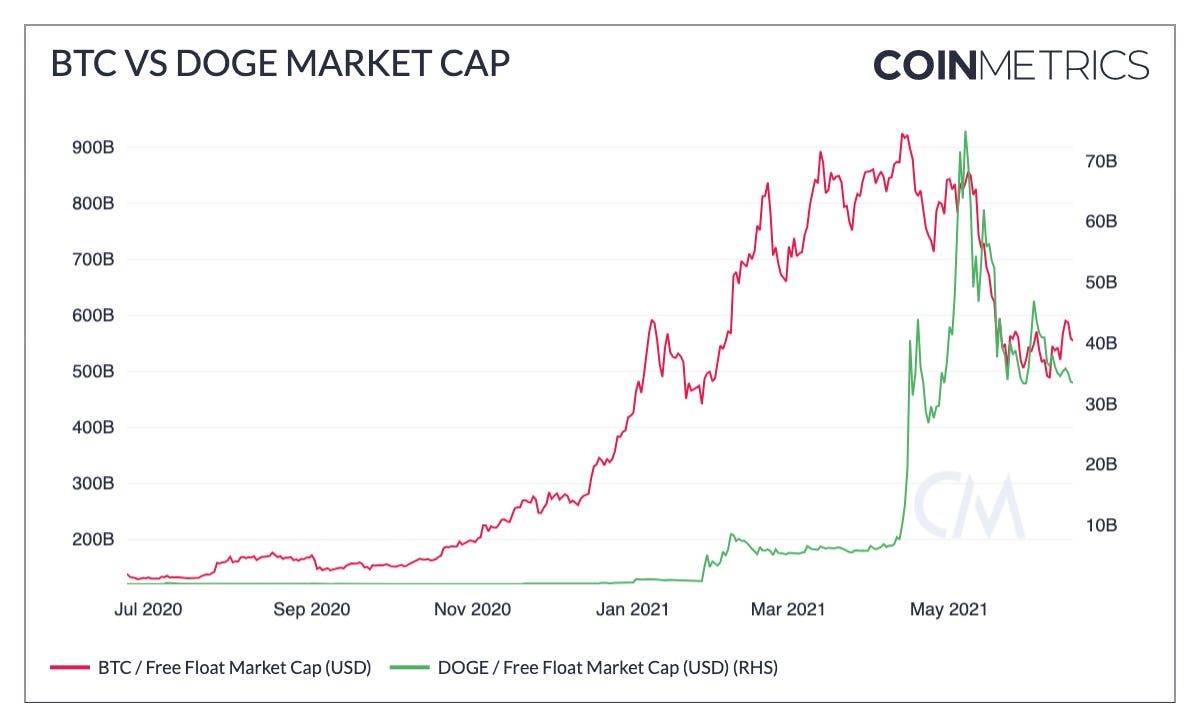
DOGE market cap, shown on the right hand axis of the below chart, grew by over 5x in less than a week in early April, ushering in a new wave of meme coin euphoria. Then in the first week of May it shot up again, nearly doubling its April high and reaching close to 1/10th of BTC free float market cap.
Source: Coin Metrics Network Data Charts
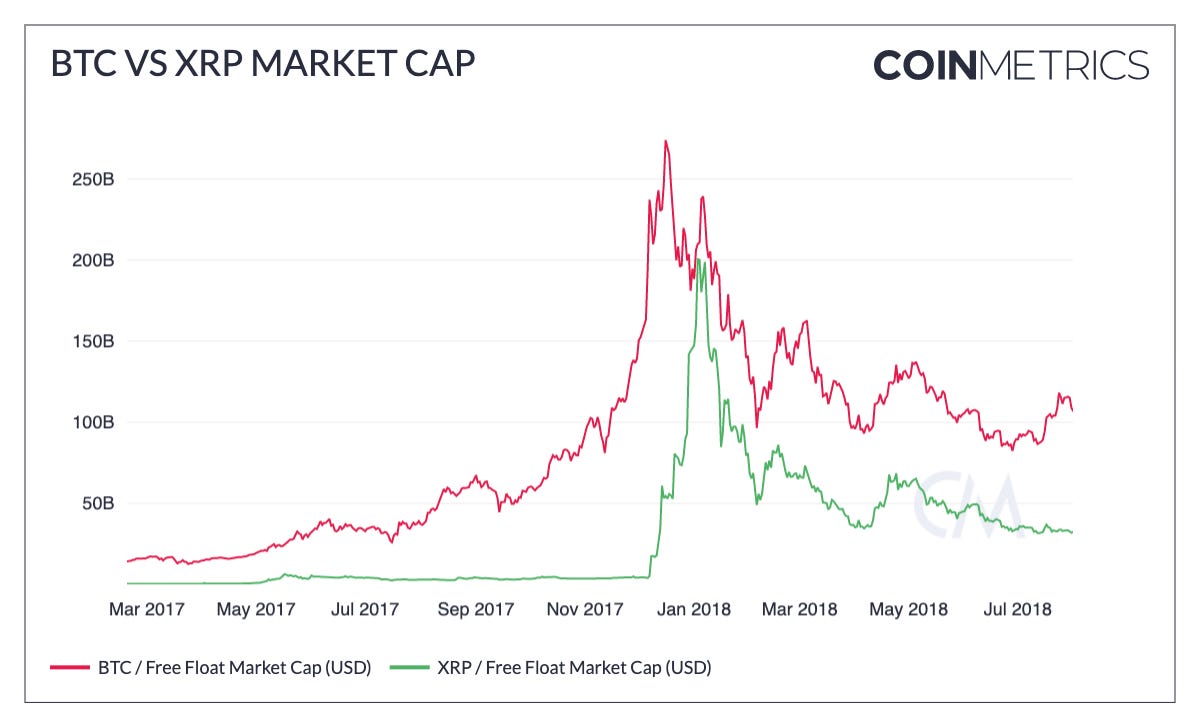
XRP’s late 2017 run looked somewhat similar to DOGE in 2021, although it was even more extreme. XRP’s free float market cap increased by over 10x over the course of a week in early December and then grew another 3x from there, peaking in early January.
Source: Coin Metrics Network Data Charts
XRP’s 90-day rolling correlation with BTC briefly turned negative in January 2018 due to XRP’s huge surge. Similarly, in 2021 DOGE’s correlation with BTC briefly reached zero as DOGE skyrocketed. The two markets had not been so divorced since January 2017.
Source: Coin Metrics Correlation Charts
In contrast, BTC and ETH have stayed relatively highly correlated throughout 2020 and 2021.
Source: Coin Metrics Correlation Charts
Bitcoin dominance reached its lowest point on May 18th and has started to rebound since then. It will be an important metric to track moving forward to help gauge the overall health of the market, as well as the relative level of retail euphoria.
To explore the data used in this piece and our other on-chain metrics check out our free charting tool, formula builder, correlation tool, and mobile apps.
Network Data Insights
Summary Metrics
Source: Coin Metrics Network Data Pro
The crypto markets tumbled again this past week before plummeting on Monday following more news of Chinese regulations. BTC and ETH active addresses both dropped over 6% week-over-week as usage continues to decline with price. Stablecoin usage, however, is increasing as investors move into less volatile assets. USDC active addresses grew by 10.8% week-over-week, and supply grew by 3.1% to over 23.4 billion.
Network Highlights
After peaking on May 19th, the amount of BTC transferred out by miners has been declining ever since. When news first broke that China was cracking down on Bitcoin mining operations some miners reportedly began to move out of the country. A portion of miners also likely sold some of their BTC, which led to the spike in the amount of BTC sent by miners. But despite subsequent news of more regulation there has not been another surge of miner transfers.
Source: Coin Metrics Network Data Charts
Meanwhile the amount of BTC held on Binance has climbed to new highs over the last month. There’s now over 570K BTC held on Binance, far more than any other exchange in our coverage. Although there are many factors at play, the increase is likely at least partially caused by investors moving their BTC off of Chinese exchanges and on to Binance, which is not officially headquartered in mainland China.
Source: Coin Metrics Network Data Charts
Coin Metrics Updates
This week’s updates from the Coin Metrics team:
Check out our new market-data focused newsletter State of the Market, featuring weekly updates on market conditions.
We’re excited to announce the new Coin Metrics mobile app. View real-time cryptoasset pricing and relevant on-chain data in a single app! Download for free here: https://coinmetrics.io/mobile-app/
As always, if you have any feedback or requests please let us know here.
Subscribe and Past Issues
Coin Metrics’ State of the Network, is an unbiased, weekly view of the crypto market informed by our own network (on-chain) and market data.
If you'd like to get State of the Network in your inbox, please subscribe here. You can see previous issues of State of the Network here.
Check out the Coin Metrics Blog for more in depth research and analysis.


