Coin Metrics' State of the Network: Issue 38
Tuesday, February 18th, 2020
Get the best data-driven crypto insights and analysis every week:
Weekly Feature
Analyzing Crypto Supply Distribution Patterns
By Nate Maddrey and the Coin Metrics Team
Those who control the wealth often control the power. But up until now, wealth distribution has been relatively hard to track. People often hide their wealth or obfuscate the true amount of assets that they hold. Cryptoassets take a big step towards making wealth distribution more transparent.
Cryptoassets are the first asset class where it’s possible to track the full supply distribution throughout its history. Since every cryptoasset transaction is public and auditable, on-chain data can be used to calculate the balances held by every address at any given block. We can then look at the distribution of the size of the balances held by individual addresses to gain insights about the supply.
However, supply distribution is not a perfect representation of wealth distribution. People often create multiple addresses, and it is difficult to figure out which addresses belong to a specific individual. Additionally, one address could be owned by many individuals, like an exchange cold wallet. To get an accurate cryptoasset wealth distribution you would need to know who controls each address. But transparent, auditable supply distribution gives a fascinating estimation of wealth distribution, and can also tell a lot about the usage patterns of a cryptoasset.
For example, supply getting consistently more distributed could be a sign that the asset is getting real usage as a medium of exchange. Furthermore, analyzing sudden changes in the amount of supply held by addresses with large balances may lead to insights about selling and trading patterns.
In this piece we explore the supply distributions of eight cryptoassets, and analyze what the changes in distribution tell us about each asset’s usage.
Methodology
The charts throughout this piece show the percentage of supply held by addresses holding certain fractions of the total supply.
We first looked at the balances held by each individual address. We then created groups of addresses holding different sized balances, ranging from relatively small to relatively large. To remain consistent across different cryptoassets, we grouped address balances by fractions of total supply, starting with addresses that hold at least one ten-billionth (1/10B) of total supply (0.0000000001%) and going up to addresses holding at least one one-thousandth (1/1K) of total supply (0.001%). For context, at time of writing, the total Bitcoin (BTC) supply is 18,214,117 so one ten-billionth of total BTC supply is 0.0018214117 BTC, equivalent to about $19.
We then grouped these addresses into different discrete ranges based on balance size. We started with addresses that hold at least 1/10B but not more than 1/1B, then at least 1/1B but not more than 1/100M, etc., going up to addresses that hold 1/1K of total supply or greater (1/1K+).
Finally, we calculated the sum of the supply held by all the addresses in each range, to get a percent of total supply held by each group of addresses. We include the cryptoasset’s price on the second y-axis axis (using log scale) to provide context about price changes during supply distribution movements.
It’s also important to note that there are some meaningful differences between the protocol design of different blockchains. For example, the supply of UTXO-based blockchains like Bitcoin becomes slightly more distributed over time as the UTXO set becomes more dispersed due to natural usage (new addresses are often created for each transaction on Bitcoin). This does not happen, however, in account-based chains like Ethereum where addresses are frequently re-used.
All of the data used in this piece is available as part of our Network Data Pro product. You can find more information about Coin Metrics Network Data Pro here.
Supply Distributions
Bitcoin
BTC supply was initially held by a few individuals, but over time it has gradually been distributed to millions of different addresses.
The percentage of BTC supply held by large addresses (with a balance of at least 1/1K of total supply) peaked at about 33% in February 2011. As of February 2020, those addresses hold about 11% of total supply. Conversely, the percentage of supply held by smaller addresses with balances of 1/10M and lower has been steadily increasing since 2011.
There was a relatively large decrease in percentage of supply held large addresses near the end of 2011 through early 2013, before large price increases. Additionally, there was a decrease in December 2018 that was likely caused by Coinbase redistributing its cold wallets.
Source: Coin Metrics Network Data Pro
Ethereum
Unlike BTC, Ethereum had a crowdsale to initially distribute Ether (ETH). The supply of ETH started off highly concentrated but has gradually become more distributed over time.
The percentage of supply held by addresses with the largest balances (at least 1/1K of total supply) peaked at about 60% in July 2016. The amount held by these large addresses saw a significant decline as the ICO bubble deflated throughout the end of 2017 and into 2018. As of February 2020, these addresses hold about 40% of total ETH supply.
The percentage of supply held by relatively small addresses (with 1/100K of total supply and lower) has been steadily increasing since 2016.
Source: Coin Metrics Network Data Pro
Litecoin
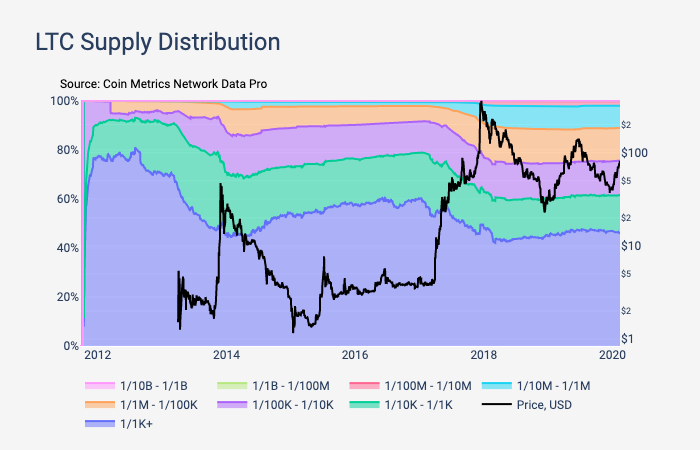
Litecoin (LTC) had several large dips in the amount held by large addresses (at least 1/1K of total supply) throughout 2013 just prior to the December 2013 price spike, and throughout 2017 before the January 2018 price peak. Interestingly, nearly 46% of supply is still held in large LTC account compared to 11% held in large Bitcoin accounts.
Source: Coin Metrics Network Data Pro
Bitcoin Forks
Bitcoin forks inherit BTC’s supply distribution (at the time of forking), so may appear distributed simply because BTC itself is relatively distributed. But unlike BTC, Bitcoin Cash (BCH) supply held by large addresses has gotten more concentrated over time.
In August 2017, when it forked from BTC, about 14% of BCH supply was held by large addresses with balances of at least 1/1K of total supply. As of February 2020, large addresses hold about 29% of BCH, compared to about 11% for BTC.
Source: Coin Metrics Network Data Pro
Bitcoin SV (BSV) percentage of supply held by addresses with balance of at least 1/1K has remained relatively flat, outside of a significant dip in February 2019, and a sudden increase in June 2019. In August 2018, when BSV forked from BTC, these large addresses held about 26% of BSV supply. As of February 2020, they hold about 24%.
Source: Coin Metrics Network Data Pro
Ripple and Stellar
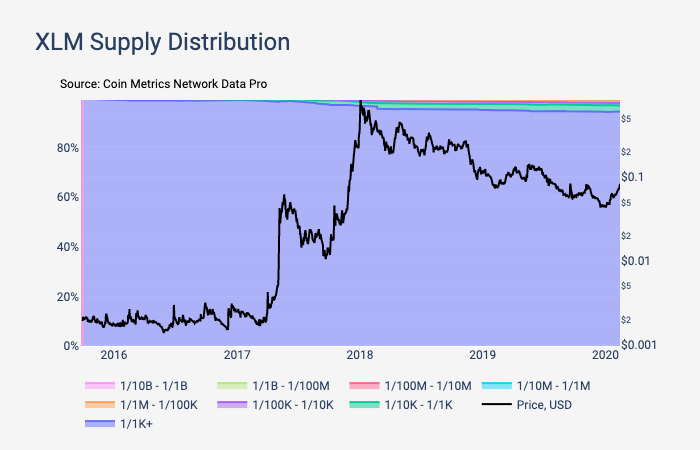
Ripple (XRP) and Stellar (XLM) are both account-based chains, and both have official foundations that hold a large percentage of supply. About 85% of total XRP supply is held by addresses with balance of at least 1/1K.
About 95% of total XLM supply is held by addresses with a balance of at least 1/1K of total supply. This is largely because the Stellar Development Foundation (SDF) holds over half of XLM supply. According to the SDF’s mandate, it currently holds 29.4B XLM. Additionally, the SDF recently burned 50% of total XLM, bringing the supply down to 50B. These burned XLM still appear on-chain since they were sent to a burn address, and therefore get counted as part of the supply distribution.
Source: Coin Metrics Network Data Pro
Tether
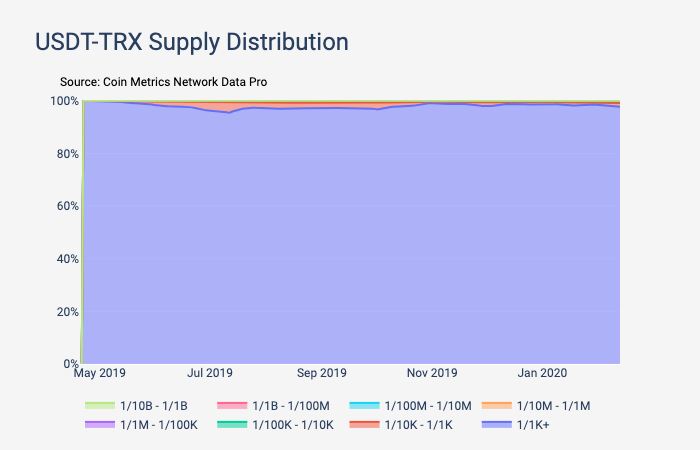
Tether, which is the largest stablecoin by most measures, has released tokens on multiple blockchains. For this analysis, we looked at the Omni (USDT-Omni), Ethereum (USDT-ETH), and Tron (USDT-TRX) versions of Tether separately.
All three versions of Tether started out 100% concentrated. But USDT-Omni and USDT-ETH have gotten increasingly distributed over time. This could be a signal that they are being used as a medium of exchange, which would explain why supply is flowing from addresses holding large balances to addresses holding smaller balances. The Tron version of Tether (USDT-TRX), however, has stayed almost 100% concentrated, which signals that it is likely not getting much usage as a medium of exchange (however, Tether was only introduced on Tron in May of 2019, so is still relatively new).
Also of note, the USDT-Omni distribution trend reversed and started becoming more concentrated in January 2018, near the peak of the market wide price bubble.
Source: Coin Metrics Network Data Pro
Conclusion
Cryptoasset supply distribution gives a clearer window into wealth distribution than any prior asset class, and also provides some interesting insights into trading patterns. The increasing distribution of assets like BTC and Tether is a positive sign that these assets may be getting real usage, and are ending up in the hands of more individual users. We will continue to analyze supply distribution and report on this in the future.
Network Data Insights
Summary Metrics
It was another positive week for the major cryptoassets. ETH continues its strong run, leading the pack in most metrics. Notably, ETH’s realized cap, which can be thought of as the average cost basis of all holders of the asset, increased by 3.6%, while BTC’s increased by 1.3%.
IOTA has been in the news recently after the network was shut down following a hack. We analyze the price implications of this incident in this week’s Market Data Insights section.
Network Highlights
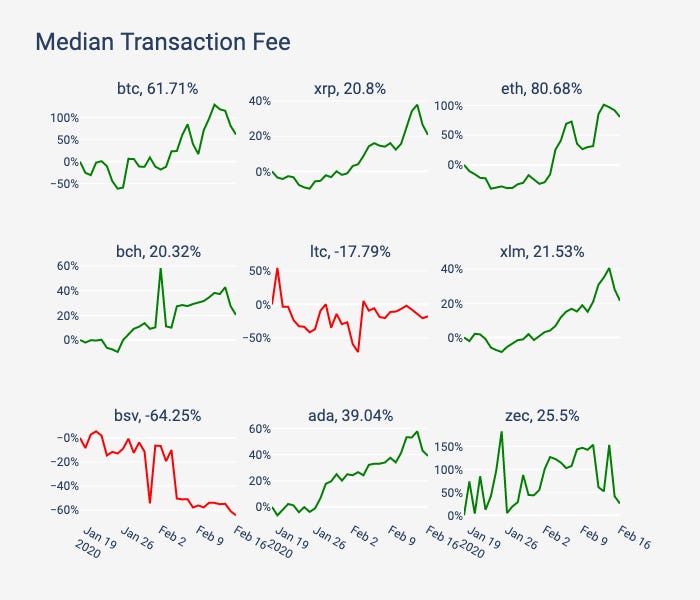
The median transaction fee for both BTC and ETH has increased at least 60% over the last 30 days, outpacing all other major cryptoassets. Median block fees typically rise due to an increased demand for block space, potentially because of increased usage.
Source: Coin Metrics Network Data Pro
Dai (DAI), Paxos (PAX), USD Coin (USDC), and True USD (TUSD) transfer counts have all been growing faster than Omni-based Tether (USDT), Ethereum-based Tether (USDT_ETH), and Tron-based Tether (USDT_TRX) over the last 30 days. Although Tether is still by far the largest stablecoin in terms of market cap, this may be an early sign that other stablecoins could start closing the gap in 2020.

Source: Coin Metrics Network Data Pro
Market Data Insights
Many assets were relatively flat for the week with a few important exceptions: ETH (+14%) and Tezos (XTZ) (+21%).
The BTC options market has been pricing in increased volatility over the next several months as reflected in the spread between realized and implied volatility, in part because of elevated open interest in BTC futures markets. But it has yet to materialize. In fact, BTC has traded in a narrow range over the past week compared to other assets. The spread between BTC’s realized volatility and other assets has widened, most significantly in ETH.

Source: Coin Metrics Reference Rates
Investigating Recent IOTA Price Action
Market efficiency and maturation is a recurring theme for The State of the Network. The recent IOTA incident is another valuable data point to benchmark the industry’s progress.
At 12:00 PM (17:00 UTC) on Tuesday, February 12, 2020, the IOTA Foundation sent a tweet stating that they were investigating suspicious behavior with the Trinity wallet.
Less than 30 minutes later, IOTA announced on their Status Page that they were shutting down the Coordinator, effectively shutting down the network.
However, it was another 24 hours before IOTA sent a second tweet about pausing the Coordinator, saying they were “working with law enforcement and cybersecurity experts to investigate a coordinated attack” and paused the Coordinator in order to protect users.
As the below chart indicates, the price was not particularly responsive to this news. In fact, the price did not even drop to levels seen on February 10th. The only noticeable change in price occurred around 08:00UTC on February 13th, roughly 15 hours after the first tweet and 8 hours before the second tweet.
This lack of substantial price action is somewhat surprising given that the net effect was the shut down of IOTA.

Source: Coin Metrics Reference Rates
To our knowledge, none of the constituent exchanges for the CM Reference Rates halted trading in IOTA. This is notable for two reasons:
There was no way for users to deposit or withdraw IOTA once the Coordinator had been shut down. This means that only IOTA already on exchanges could be traded.
More importantly, IOTA claims that the attacker was using exchanges to liquidate their stolen holdings, after some obfuscation, and that exchanges have flagged the applicable transactions.
One might expect these developments to contribute to reduced trade volume following an initial spike. As can be noted from the charts below, while there does appear to be a spike in trade volume, it primarily occurs only after the second IOTA tweet-- the response to the first tweet was limited. Additionally, rather than dry up completely after the spike, trade volume appears to actually increase in some markets, even hours after the second tweet.
A final interesting note regarding the trading activity: at various intervals, there appears to be large volume spikes across some markets prior to the first tweet from IOTA. The earliest social media activity we could find about the IOTA issue was on the IOTA Discord channel, starting at around 10:35AM EST on Wednesday, February 12th. This roughly co-incidents with the timing of a volume spike in the bitfinex-miota-btc-spot market, as can be seen in the chart below.

Note that Coin Metrics uses the ticker ‘miota’ to refer to IOTA.
CM Bletchley Indexes (CMBI) Insights
After a strong start to the week, most Indexes gave up their returns over the weekend to close the week out relatively flat. The CMBI Ethereum Index was the best performer of the week, reaching returns of 25% intra-week before finishing the week 14% up. The Bletchley 20 (mid-caps) had their first negative week for the year, finishing as this week’s worst performer, down 3%.


Coin Metrics Updates
This week’s updates from the Coin Metrics team:
Coin Metrics is hiring! We recently opened up 5 new roles, including Blockchain Data Engineer and Data Quality and Operations Lead. Please check out our Careers page to view the openings.
As always, if you have any feedback or requests, don’t hesitate to reach out at info@coinmetrics.io.
Subscribe and Past Issues
Coin Metrics’ State of the Network, is an unbiased, weekly view of the crypto market informed by our own network (on-chain) and market data.
If you'd like to get State of the Network in your inbox, please subscribe here. You can see previous issues of State of the Network here.
Check out the Coin Metrics Blog for more in depth research and analysis.


