Coin Metrics' State of the Network: Issue 33
Tuesday, January 14, 2020
Get the best data-driven crypto insights and analysis every week:
Weekly Feature
Is Bitcoin Becoming a Safe Haven Asset?
By Kevin Lu and the Coin Metrics Team
Discussion regarding Bitcoin’s status as a safe haven asset during times of elevated geopolitical risk and macroeconomic uncertainty has existed almost since Bitcoin’s inception. Despite anecdotal evidence that Bitcoin has reacted positively to certain historical events and a compelling narrative that Bitcoin has the fundamental properties to serve as a safe haven asset, the actual body of empirical evidence (prior to recent events) is inconclusive.
Recent events have transpired that significantly expand the body of empirical evidence -- the intensification of military tensions between the United States and Iran. In this issue of State of the Network, we examine events related to the conflict to further our understanding of Bitcoin’s reaction function to geopolitical events. Additionally, we use high time-resolution price data to study the degree of market efficiency and speed of information diffusion.
Major Events in the United States-Iran Conflict
We conduct event studies on three major events related to the intensification and subsequent de-escalation of military tensions between the United States and Iran in January 2020. A description of the three major events is found below:
On January 3, 2020 at 01:00 UTC, major news sources began to report on a drone strike executed by the United States which killed Iranian Major General Qasem Soleimani. The actual drone strike occurred roughly three hours earlier to first publication and initial reports in the immediate aftermath were short on details.
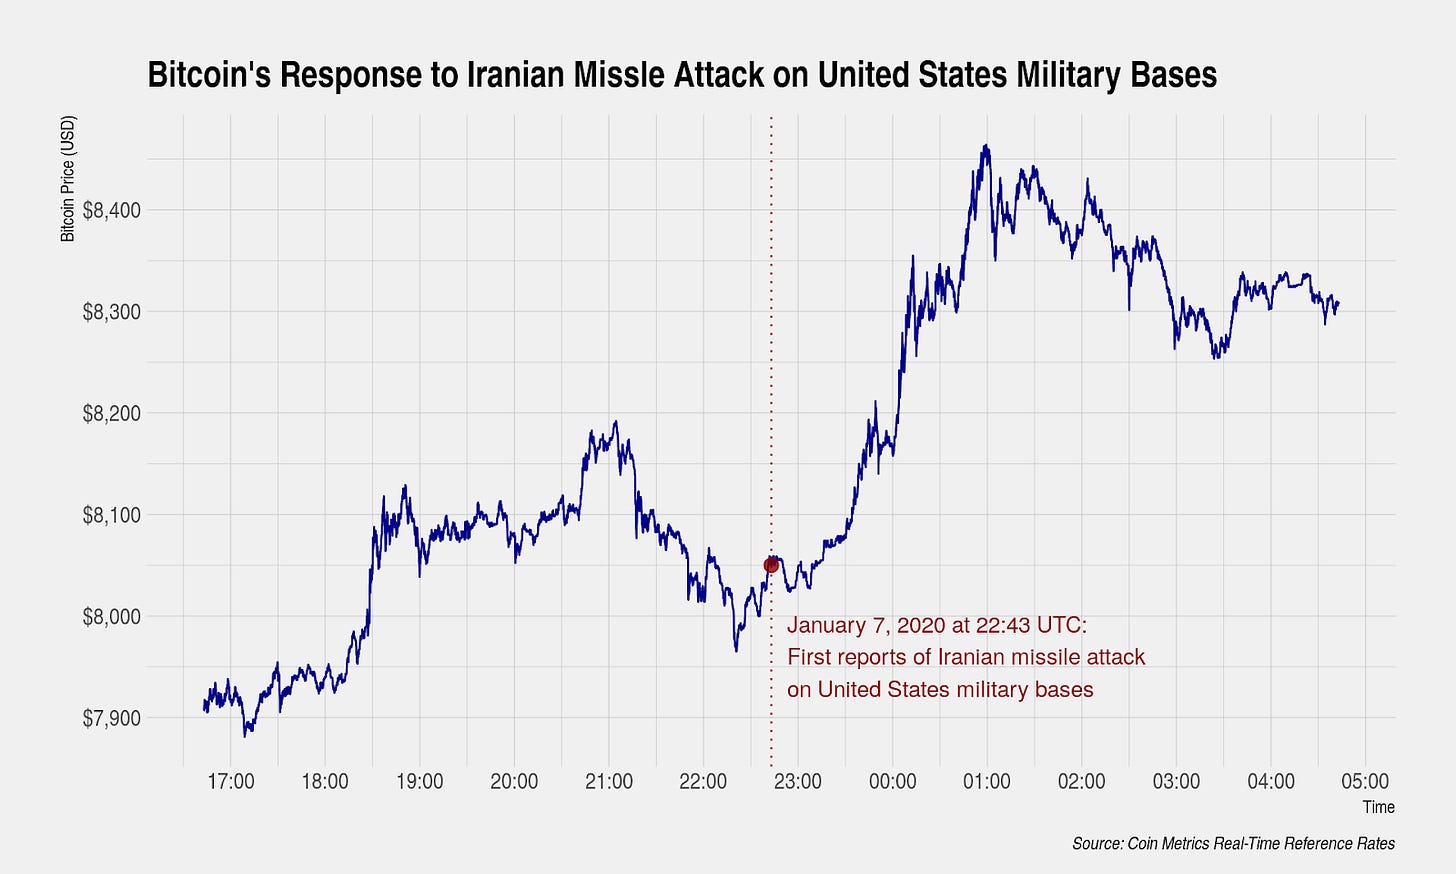
On January 7, 2020 at 22:43 UTC, Iran launched a missile attack against United States military bases located in Iraq as retaliation to the assassination of Major General Qsem Soleimani. This event marked a dramatic escalation in the military tensions between the United States and Iran.
On January 8, 2020 at 16:27 UTC, President Trump addressed the nation regarding the Iranian missile attack, stating that “no Americans were harmed” and that “Iran appears to be standing down”. President Trump concluded his ten-minute speech by stating, “the United States is ready to embrace peace with all who seek it”. These comments were interpreted as a cessation of hostilities and a deescalation of tensions.
During this time period, oil futures and gold futures both experienced immediate positive reactions to events that marked an escalation of tensions and negative reactions to the de-escalation. This shows their high degree of market efficiency and the speed and effectiveness of information diffusion during a volatile situation. Market participants were able to quickly and accurately adjust prices due to changes in the probability of disruption of oil supplies in the Middle East.
We examine Bitcoin’s response to these events using Coin Metrics’ Real-Time Reference Rates, which represent a global price quoted in U.S. dollars for a set of cryptocurrencies, updated once per second. Real-Time Reference Rates are calculated using a robust and resilient methodology that adheres to international best practices for financial benchmarks, including the International Organization of Securities Commissions’ (IOSCO) Principles for Financial Benchmarks. Constituent markets used in the calculation of the Real-Time Reference Rates are carefully selected using a framework which evaluates markets and exchanges along numerous dimensions.
United States Drone Strike
Major news sources began reporting on the U.S.-led drone strike which killed Iranian Major General Qasem Soleimani on January 3, 2020 at 01:00 UTC. Reports were first circulated on Twitter and examination of timestamps from major publications indicates that the information was widely disseminated by 02:00 UTC. By this time, both oil and gold futures had already made significant moves in response to the attack.
Although many observers point to Bitcoin’s response as evidence of its safe haven properties, a close examination of the timing suggests that multiple explanations are possible. While Bitcoin did subsequently move upward mirroring the response seen in oil and gold, it did so with roughly a three hour delay. Significant movement in Bitcoin’s price was not observed until 04:00 UTC.
One possible explanation is that market participants bid up the price of Bitcoin in the face of greater geopolitical uncertainty (a validation of the safe haven theory) but did so with a delay because the market is inefficient. Under this explanation, market participants are slow to learn about or act upon information.
An alternative explanation points to the timing of Bitcoin’s response and concludes that this event indicates no strong relationship between Bitcoin and geopolitical events. Bitcoin’s price movement did not occur at the same time as other financial markets such as oil and gold futures despite Bitcoin’s market being open 24/7. And for several hours after the event, Bitcoin prices declined or remained stable which is incompatible with an explanation that Bitcoin markets are inefficient due to slow information diffusion. If the slow information diffusion explanation were true, we would expect prices to gradually reflect available information, and not react suddenly and sharply as it eventually did.
Finally, Bitcoin has historically seen sharp intraday price changes without any apparent news catalyst. Instead, these price changes are driven by forced liquidations on futures products which can have a disproportionate impact on short-term prices and are often the cause of bouts of short-lived volatility.
When examining this one event in isolation, multiple explanations are possible. Despite loud claims that Bitcoin’s price movement was driven by the U.S.-led drone strike, a spurious relationship cannot be ruled out.
Iranian Missile Attack
While the previous event illustrates the potential limitations in market efficiency for Bitcoin and the slow speed of information diffusion during normal conditions, an examination of the Iranian response illustrates how rapidly market efficiency can improve.
In response to the United States-led drone strike, Iran retaliated by launching several missiles to United States military bases located in Iraq. Initial reports were again short on details, and information first circulated through journalist Twitter accounts before being picked up by mainstream news publications. The earliest known mention of the Iranian missile attack was on January 7, 2020 at 22:43 UTC.
In contrast to the multiple explanations in the previous event, Bitcoin’s response to the Iranian missile attack suggests a much narrower set of possible explanations. First, Bitcoin moved in concert with oil and gold futures with no noticeable delay. Second, prices moved upward over the subsequent hours with a steep but gradual slope -- not the sharp price movements that are commonly observed during forced liquidations on futures positions. In fact, few forced liquidations on futures positions were observed on BitMEX despite the large change in prices.
The body of evidence strongly suggests a connection between Bitcoin and the escalation of military tensions between the United States and Iran and serves as a validation of the safe haven theory.
Deescalation of Military Tensions
President Trump’s remarks indicating a de-escalation of military tensions is perhaps the strongest evidence in the history of Bitcoin that there is a direct connection between Bitcoin and geopolitical events. While the previous two events in our study measured Bitcoin’s response on the order of hours, its response to this event can be measured on the order of minutes.
President Trump started his address to the nation on January 8, 2020 at 16:27 UTC. Bitcoin, in concert with traditional financial markets, responded immediately to the news that both the United States and Iran would not seek further military action. This event and the other two events in our study show that under the proper circumstances, Bitcoin’s market efficiency can increase and has the potential to be as efficient as the largest financial markets in the world. Circumstances were ideal for optimal market efficiency because market participants were already attuned to the significance of the unfolding situation and the time of President Trump’s remarks was widely known in advance. This conclusion is consistent with a similar study we performed for TRON in State of the Network Issue 10, where we found that under optimal conditions, even markets for a mid-capitalization asset can become very efficient.
While many observers have pointed out this connection, we feel the implications of this event are still not widely appreciated. We have witnessed perhaps the strongest validation of the Bitcoin safe haven theory in its 11 year history, and this watershed moment marks an important milestone in Bitcoin’s maturation as a legitimate asset class.
Why has this event in particular invoked such a strong reaction from Bitcoin? We feel that there are both first order and second order effects at play.
First, the escalation in military tensions increased policy uncertainty. This heightened uncertainty increases the attractiveness of safe haven assets such as gold.
Second, these events caused a short-lived but significant decline in real yields (nominal interest rates adjusted for inflation) which increases the attractiveness of holding Bitcoin. Nominal interest rates declined slightly in part because U.S. sovereign bonds were bid due to safe haven capital flows. But inflation expectations also rose because market participants were pricing in the possibility of a disruption in oil supplies -- products derived from crude oil (most notably gasoline but also many consumer products) are a key determinant in headline inflation rates. Declines in real yields can be driven by declines in nominal interest rates which reduce the opportunity cost of holding a non-yield producing asset like Bitcoin. Declines in real yields can also be driven by increases in inflation expectations which drive an increased need for store-of-value assets like Bitcoin.
It is worth noting, however, that releases of pure macroeconomic data (without an increase in geopolitical risk) which have resulted in large changes in real yields have failed to spark a reaction in Bitcoin’s price thus far. Such events include important meetings of the Federal Open Market Committee and releases of key macroeconomic indicators like the U.S.’s employment report and important survey-based indicators like manufacturing PMI.
Taken together, this confluence of events caused a perfect storm that led to Bitcoin having an extremely strong reaction. On the first order, it appears that Bitcoin is a source of safe haven capital flows during times of uncertainty, at least for now. On the second order, Bitcoin may begin to exhibit some sensitivity to changes in real yields and the macroeconomic events that lead to changes in real yields. In addition, while the initial reaction in Bitcoin to the United States-led drone strike may have been spurious, it renewed discussion about Bitcoin as a safe haven asset and introduced the idea that other traders are considering it for safe haven capital flows. Ultimately, assets attain a safe haven status by a combination of their fundamental properties and due to game theory-driven consensus among investors.
Finally, these events serve as a contemporary study of market efficiency with serious implications surrounding the debate on whether the upcoming block reward halving is priced in. The speed of response indicates that under normal circumstances, there are still limitations to Bitcoin’s market efficiency, but under special circumstances in which market participants become attuned to the significance of upcoming events, market efficiency can increase to levels comparable to the largest financial markets.
Network Data Insights
Summary Metrics
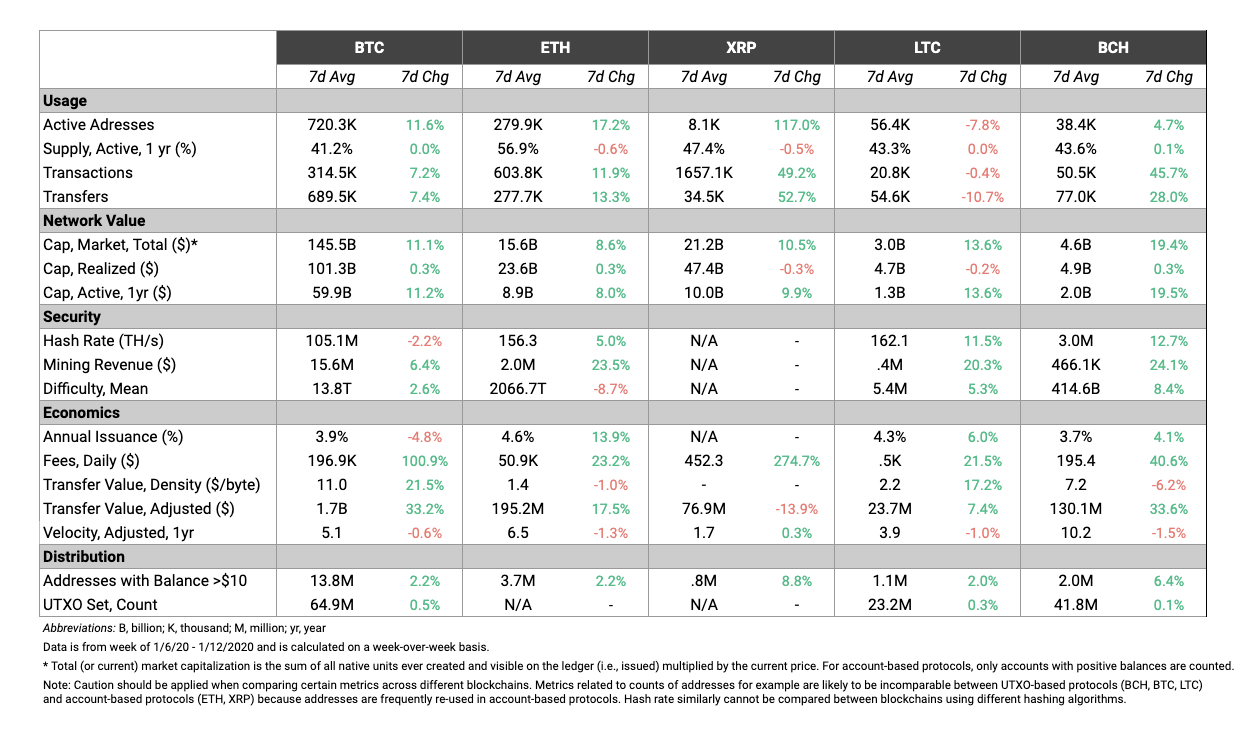
The major cryptoassets rallied over the past week after a rocky start to 2020. Usage was up for BTC, ETH, XRP, and BCH, while LTC saw a slight decrease. XRP, notably, had a 117% increase in active addresses and close to a 50% increase in transaction count.
Both BTC and BCH adjusted transfer value grew by over 33% week-over-week with ETH not too far behind at nearly 18%. But BTC still has a huge lead in terms of average daily transfer value. BTC had a daily average of $1.7B adjusted transfer value over the last week, while ETH and BCH had $195M and $130M, respectively.
Network Highlights
ETH annual issuance percentage (i.e. the monetary inflation) fell to an all-time low of 3.45% at the end of December, 2019 as the Ethereum ice age approached. The Ethereum ice age was a planned difficulty increase which made it more difficult to mine blocks, and therefore increased the time between new blocks. Lower block count led to lower total daily block rewards, and therefore led to decreased issuance.
The ice age was originally designed to grind the Ethereum network to a halt in order to encourage users to shift over from Ethereum 1.0 to Ethereum 2.0. However, Ethereum 2.0 did not launch by the end of 2019 as once expected. Ethereum therefore hard forked on January 2nd, 2020 in order to increase difficulty and delay the ice age. After the fork, ETH annual issuance is now back up to 4.56% as of January 12th.
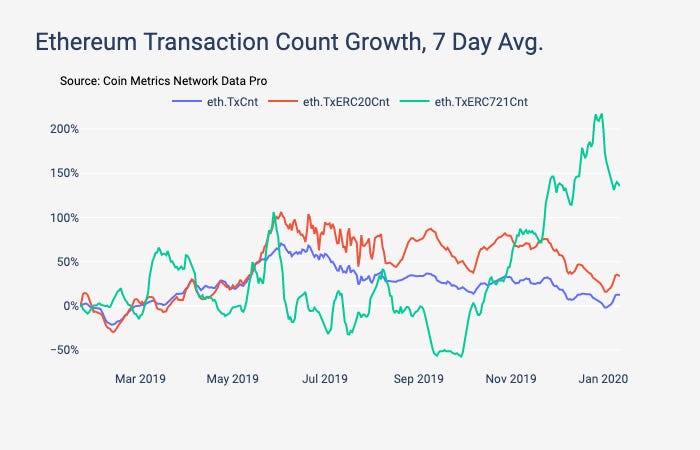
Ethereum ERC-721 transactions have cooled off at the beginning of 2020 after a strong close to 2019. The following chart shows transaction count growth over the past year (1/13/2019 - 1/13/2020) for ETH, ERC-20’s, and ERC-721’s, smoothed using a seven day rolling average.
Market Data Insights
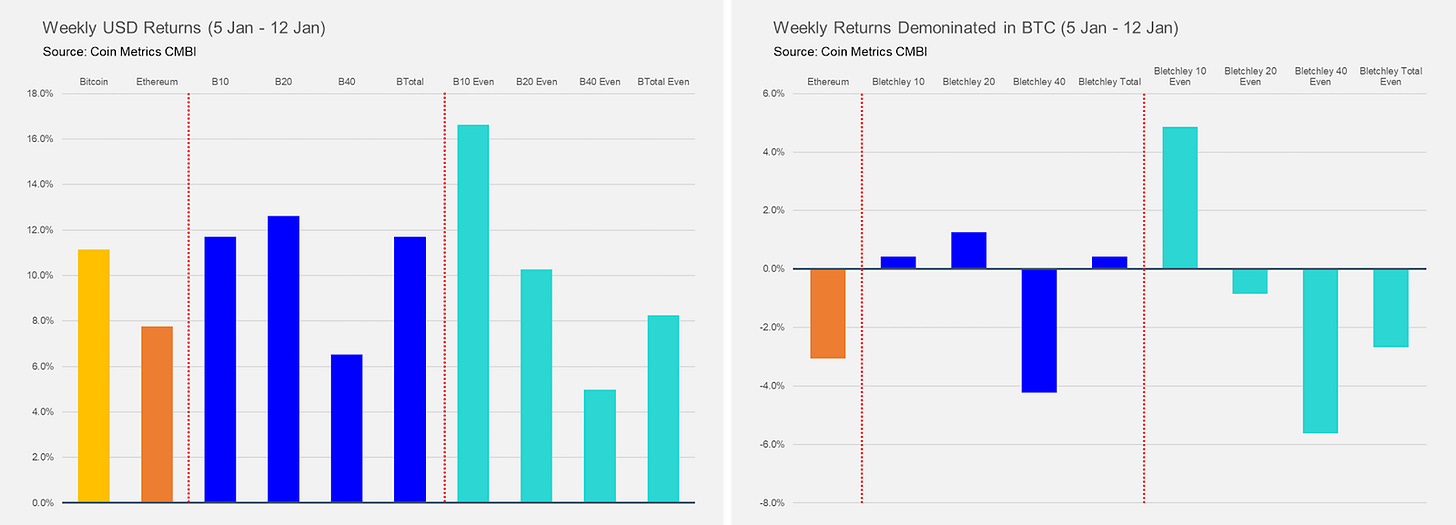
Tensions between the United States and Iran this past week are largely responsible for a widespread rally in cryptoassets. Bitcoin is up 11%, outpacing gains seen in some smaller cryptoassets. Historically, altcoins have had a high beta to Bitcoin returns and having exposure to altcoins during upswings has been used as a method to increase overall portfolio return..
Still, we do see some isolated examples of extreme price movements that cannot be easily explained. Bitcoin Cash SV (+49%) is the strongest performer among major cryptoassets perhaps due to speculation about positive developments surrounding the legal developments of Craig Wright, a vocal proponent of Bitcoin Cash SV. Bitcoin Cash (+20%), EOS (+19%), and Litecoin (+18%) are all strong performers this week on no clear news catalysts.
Mid-cap cryptoassets are also mixed with some assets outperforming Bitcoin and others underperforming. Dash (+30%) and ChainLink (+25%) are notable movers. Ethereum Classic (+14%) and ZCash (+16%) continue with a strong performance over the past several weeks. Cosmos, one of the strongest performers over the past three months, is only up 1% this week.
Volatility for most cryptoassets continues to steadily decline. Many cryptoassets are at or approaching all-time lows when measured on a three month rolling basis -- only Bitcoin’s volatility appears to be stable or trending upwards. This reflects the proliferation of leveraged products and how investor interest has become increasingly concentrated in Bitcoin. Volatility for nearly all cryptoassets are now inline with Bitcoin’s.

The relationship between Bitcoin and gold deserves continued observation. Observers have pointed to Bitcoin’s performance during the summer of 2019 in which both Bitcoin and gold saw large gains in response to a sudden shift in monetary policy from the world’s major central banks. This shift involved unexpected interest rate cuts, causing many developed world countries’ sovereign bonds to trade with negative yields, and renewing concerns about the sustainability of the current path of monetary policy and the long-term consequences of such actions. More recently, both Bitcoin and gold jumped simultaneously in response to military tensions between the United States and Iran.

While the recent conflict presents quite convincing evidence in support for theory that Bitcoin has benefited from safe haven capital flows, the correlation between Bitcoin and gold has always been low and inconsistent when measured over longer time frames.
Here we show the correlation of Bitcoin daily returns and gold daily returns over a 90 day rolling window. While correlation was weakly positive for the majority of 2019, it has since recently flipped to be negative, although the sharp decline has reversed over the past several days due to the situation between the United States States and Iran.

In order to see higher correlations between Bitcoin and Gold, Bitcoin would need to begin to react instantaneously to releases of surprising macroeconomic information that reflect changes to growth, inflation, and real yields. Thus far, there has been no evidence that Bitcoin consistently exhibits such behavior.
CM Bletchley Indexes (CMBI) Insights
All indexes started the year in a stellar fashion off the back of very strong market performance across most cryptoassets this week. The Bletchley 10 (large cap) and Bletchley 20 (mid cap) performed best, each returning ~12% for the week with the Bletchley 40 (small cap) lagging the higher cap indexes, returning only 6%.The relative uniformity of the market movement this week can be seen through the low return profile of indexes when denominated in Bitcoin terms.
The Bletchley 10 Even was the strongest performer of the week, outperforming all indexes, demonstrating for the second week running that there is merit in considering index calculation designs other than market cap weighting for cryptoasset managers.

Coin Metrics Updates
This week’s updates from the Coin Metrics team:
Coin Metrics is hiring! We recently opened up 6 new roles, including Blockchain Data Engineer and Data Quality and Operations Lead. Please check out our Careers page to view the openings.
As always, if you have any feedback or requests, don’t hesitate to reach out at info@coinmetrics.io.
Subscribe and Past Issues
Coin Metrics’ State of the Network, is an unbiased, weekly view of the crypto market informed by our own network (on-chain) and market data.
If you'd like to get State of the Network in your inbox, please subscribe here. You can see previous issues of State of the Network here.
Check out the Coin Metrics Blog for more in depth research and analysis.


