Coin Metrics’ State of the Network: Issue 186
Tuesday, December 20th, 2022
Get the best data-drive crypto insights and analysis every week:
The State Of The Network 2022 Year In Review
By Matías Andrade and Kyle Waters
As the year draws to a close, we find ourselves in the unique position to reflect on an eclectic collection of events in the crypto ecosystem. In this edition of State of the Network, we relive the defining moments of the year and trace a path forward.
Source: Coin Metrics Reference Rates. Data as of December 19, 2022.
Q1: Macro Headwinds
One of the standout narratives during the most recent bullish investment cycle was the rising integration and participation of traditional financial institutions in the crypto ecosystem. Bitcoin had long maintained a relative immunity to broader macro conditions, but in 2022 the correlation between BTC and the S&P 500 increased to its highest level all-time, with BTC moving tightly in sync with stocks and moving against volatility (as measured by the VIX).
Source: Coin Metrics Formula Builder
To summarize some of the macro conditions that drove most markets this past year, the S&P 500 is trading 19% below the year open, and ten-year U.S. Treasury Note yields have increased by 2%. The Bloomberg U.S. Aggregate Index, a corporate bond index that captures a broad swathe of American, investment-grade corporate bonds, has experienced one of the deepest drawdowns since its inception in 1976. MSCI World Index, a market-cap weighted index of over 1,500 of the largest companies around the globe, is trading –16% from year open. Further complicating the economic outlook, inflation rates have been persistently elevated relative to previous years, with a current U.S. YoY inflation rate of 7.1%, Eurozone HICP inflation rate of 10.0%, and even higher inflation rates around the developing world and other emerging markets. Moreover, world supply chain shocks on an ongoing basis are disrupting production costs, as a result of both the COVID-19 pandemic and the Russo-Ukrainian conflict.
In an increasingly fractured global stage, cryptocurrency valuations have decreased even as their use for cross-border payment rails is demonstrated, with over $100M in cryptoasset transfers to Ukraine. The donations have continued throughout the year, most recently with the United Nations’ plan to send USDC to Ukrainians displaced from their homes. Indeed, stablecoins have settled more than $7 trillion in value, a record-breaking value compared to previous years.
Source: Coin Metrics Formula Builder
Q2: Three Broken Arrows
In the wake of a global economic slowdown, a credit crunch started affecting crypto companies as lenders sought to reduce their leverage and began calling back loans offered to companies in the digital asset sector. As impoverished liquidity conditions stressed these companies, many were brought to bear the consequences of overleveraging, sowing systemic risk across the industry. One of the first dominos to fall was the Luna–Terra ecosystem, an algorithmic stablecoin whose design was unable to curtail a death-spiral in Luna, which supported the value of the stablecoin UST. While many experts have widely asserted that an algorithmic stablecoin is a sort of financial philosopher’s stone—more mythical than practical—the ensuing credit crisis was very real indeed, wrecking retail and (formerly) sophisticated investors alike.
One of the most noteworthy victims of the UST trade was Three Arrows Capital (3AC), a key borrower in the crypto lending ecosystem that enabled other companies to offer yield on cryptocurrency deposits. As a result of this bankruptcy, financial contagion began to spread throughout the ecosystem, seriously wounding Celsius, Genesis, and other lenders. Furthermore, 3AC had concentrated holdings of Grayscale’s BTC Fund, with around $2B in GBTC. This likely contributed to their downfall, as they were left holding illiquid GBTC shares. Together with diminishing investment flows, this has brought the GBTC discount to almost 48% under par. Even though the fund is fully backed by Bitcoin, redemptions aren’t allowed under the current fund rules.
As lenders suffered, the broader contagion infected most sectors of the crypto markets. Coin Metrics’ Total Market Series Even-Weighted Sector Indexes show the relative performance of each slice of the market throughout 2022, with the most pronounced downward movements in spring.
Source: CMBI Total Market Series, data as of December 19th; June 2019 = 100.
Q3: The Merge
Amidst the market turmoil, September brought a needed bright spot. After years of research, development, and testing, Ethereum’s major Q3 network upgrade—dubbed The Merge—proved to be one of the most successful events in the crypto ecosystem in 2022. Often described as “changing the engine mid-flight,” Ethereum developers coordinated an overhaul to the second-most valuable network’s underlying consensus mechanism, replacing miners in Proof-of-Work with a system of global validators staking ETH under Proof-of-Stake.
The end to Ethereum mining marked the beginning of a new economic paradigm for the network: yearly ETH issuance dropped close to 90% from the 5M ETH per year paid out to miners to the ~600K ETH expected to be issued per year to validators at today’s rate of staking. Taking into account the burning of ETH from fees (EIP-1559), ETH supply has flatlined around 120.5M since The Merge.
Source: Coin Metrics Network Data Pro
Staking rewards give ETH holders a direct way to generate yield on their assets. The emergence of a robust staking economy on Ethereum has attracted a new group of participants, services, and key metrics for analysis.
But the events of Q3 also sparked intense conversation around Ethereum’s censorship resistance and neutrality. In August, the Office of Foreign Assets Control (OFAC)—an intelligence and enforcement agency under the U.S. Treasury Department—took an unprecedented step in sanctioning the open source smart contracts behind Tornado Cash, a privacy-enabling decentralized application running on Ethereum.
Since the actions, block producers (miners in PoW pre-Merge, validators in PoS post-Merge) have been excluding Tornado Cash transactions as a result of the sanctions. However, there is an ongoing debate around open source software and the limits to sanctioning smart contracts, which in the absence of “backdoor” admin keys, are not directly controllable by centralized parties.
In the background of an eventful quarter, digital asset markets continued to mature. While some of these developments might seem slower moving as they rise to institutional standards, they should not be overlooked. In August, US crypto giant Coinbase announced that it was teaming up with BlackRock—the world’s largest asset manager by AUM—to offer crypto trading and custody to clients of BlackRock’s institutional management platform, Aladdin. Meanwhile in the European Union, regulators debated and moved ahead with a framework to regulate digital assets with the Markets in Crypto Assets (MiCA) legislation. Although the rules are not planned to come into effect until 2024 at the earliest, they set out to provide greater transparency and accountability to individuals and businesses operating in the crypto industry.
Q4: FTX Fizzling Out
Until the extraordinary revelations and developments in November, market data showed FTX to be a rising force in the crypto industry. Indeed, over the course of the year it seemed like FTX was poised to come out stronger from the chaotic events of the spring, swooping in to buy up distressed assets with gusto. FTX’s CEO and founder, Sam Bankman-Fried (SBF), had seized the spotlight and attention of US regulators on Capitol Hill. But that all changed dramatically in November, starting with Coindesk’s eyebrow-raising article on November 2nd which showed that Alameda Research’s balance sheet was holding billions of dollars worth of FTX’s FTT token.
The murky relationship between Alameda Research — a proprietary trading firm also founded by SBF — and FTX had long been a mystery. However, Alameda’s outsized position in FTT — issued and controlled by FTX — prompted deeper scrutiny into the degree of the independence between the two entities. Despite SBF’s assurances and a failed buyout from Binance, FTX paused withdrawals on November 8th and by the end of the week FTX, FTX US, and Alameda had all filed for Chapter 11 bankruptcy.
At first, FTX’s failure appeared to come out of nowhere. But with more details and context, it became evident that FTX and Alameda were in trouble long before the collapse. It will likely take months if not longer to parse through all relevant evidence but by using on-chain data, we started to put together some pieces of the puzzle by tracing Alameda’s public transactions on the blockchain. We identified suspicious transfers of the FTT token earlier this year that may have indicated that Alameda was in fact a casualty of May or June after all, but received a loan from FTX to cover the losses.
One month after the collapse, US officials released a wave of charges against SBF. He was arrested on December 13th by the Royal Bahamas Police Force, pending extradition to the U.S. for allegations of defrauding clients, campaign financing fraud, wire fraud, securities fraud, and money laundering. He was arrested just the day before he was scheduled to testify in front of congress, after John Ray III—in charge of the FTX–Alameda estate after filing for bankruptcy—provided his testimony. The US Department of Justice unveiled an eight-count indictment, while the SEC and CFTC also released charges against SBF. While undoubtedly a tragic outcome for FTX users and the broader ecosystem, the event optimistically has sparked renewed interest in Proof-of-Reserves schemes and tighter scrutiny of crypto custodians to ensure the safety and integrity of funds.
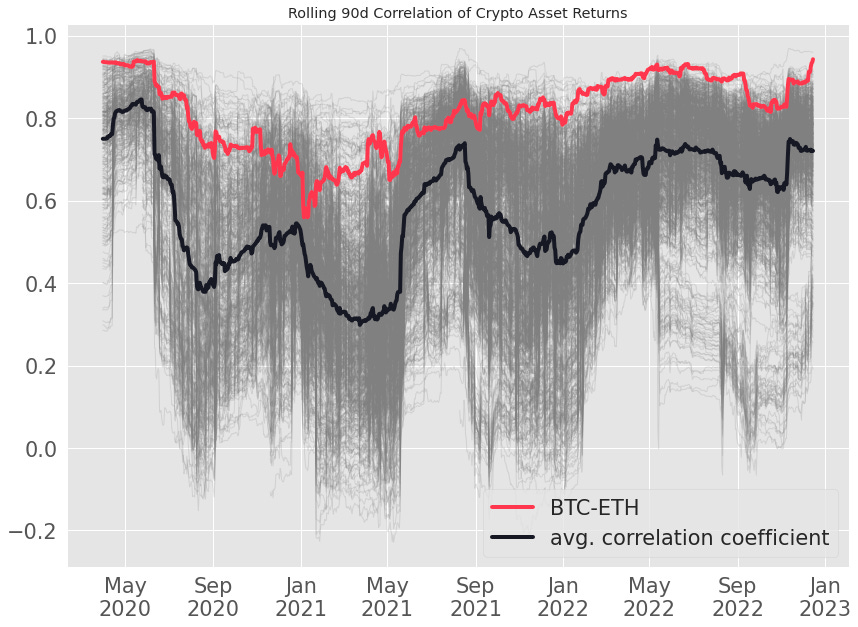
From a markets standpoint, the large shock to the industry pushed crypto asset correlations higher as assets sold off in tandem. The chart below shows the rolling 90-day correlation of daily returns for a collection of major crypto assets. However, for savvy investors, seeing quality assets move in sync with the rest of the market can present new opportunities and attractive entry points.
Source: Coin Metrics Reference Rates
Although these events have strained institutional perceptions of crypto, there are plenty of silver linings to lift our spirits. One of Coin Metrics’ latest additions to our product roster was datonomy, a digital asset taxonomy, product of collaboration with MSCI and Goldman Sachs. On a separate note, BNY Mellon, the world’s largest custodian and, by many accounts, the world’s most important bank, added a crypto custody service to their product repertoire. Furthermore, the DTCC brought together leading banks, including Bank of America, Citi, and Northern Trust to explore possible CBDC and tokenized security integration onto U.S. settlement infrastructure, reducing time to settle trades to a single day. It would appear that institutions have warmed-up to digital asset technology and continue to invest and build solutions for future applications.
Turning to 2023, we will seek to continue bringing data insights into the fold as the industry builds on.
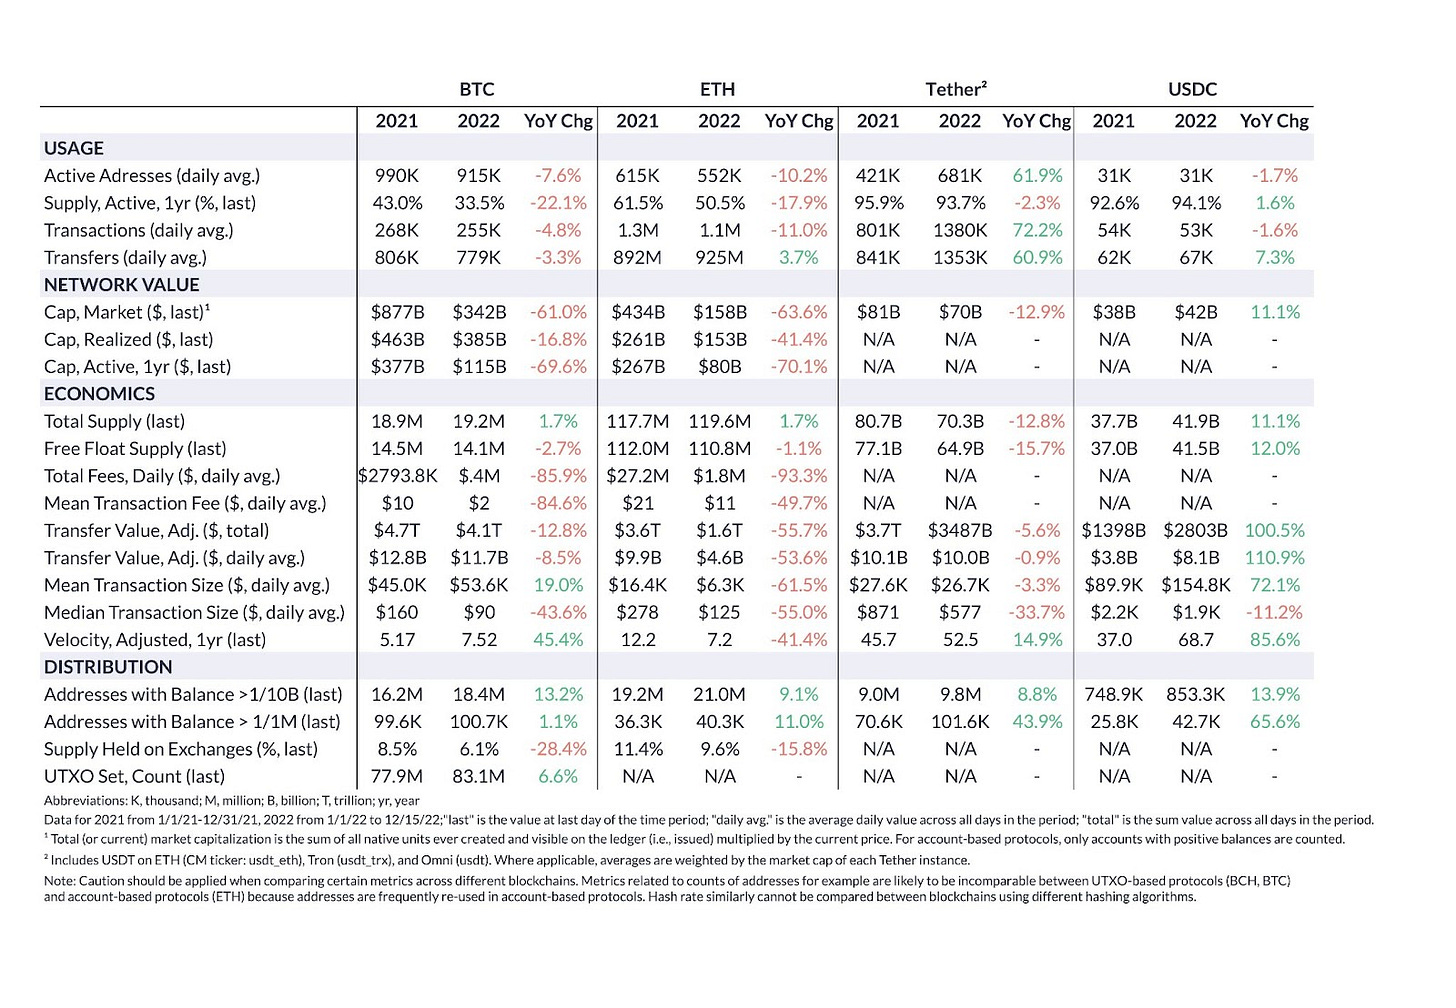
2022 Summary Metrics
Note: ETH supply metrics only include supply on the execution layer (i.e. excludes PoS Issuance on the Beacon Chain)
Coin Metrics’ State of the Network, is an unbiased, weekly view of the crypto market informed by our own network (on-chain) and market data.


