Coin Metrics' State of the Network: Issue 87
Tuesday, January 26th, 2021
Get the best data-driven crypto insights and analysis every week:
Weekly Research Focus
Fear, Uncertainty, and Double-Spends
By Nate Maddrey and the Coin Metrics Team
As bitcoin (BTC) price reaches new all-time highs, renewed rounds of fear, uncertainty, and doubt (aka FUD) have come with it.
On January 20th articles began to circulate claiming there had been a Bitcoin double-spend. A double-spend is a type of malicious attack in which a user spends the same BTC twice, defrauding the recipients. The Bitcoin blockchain is designed to prevent double-spends from happening and they’re effectively only really possible under extreme circumstances like a 51% attack. A successful double-spend would be a cause for concern.
However, what happened on January 20th was not a double-spend. The hysteria was prompted when a user re-sent a transaction with a higher transaction fee, which is a relatively normal occurrence. Adding further confusion, two different versions of the transaction were temporarily included in two different blocks due to a blockchain split. This is also a completely normal occurrence that happens when two separate miners mine a block at roughly the same time and is usually remedied after the next block is found. This is part of why it’s usually recommended to wait six blocks before considering a transaction fully settled and why confirmation time is an important consideration. It’s crucial to note that only one of the transactions was ultimately accepted into the blockchain, meaning that a double-spend did not occur.
But this did not prevent several crypto news outlets from reporting it as a double-spend, causing confusion and some panic. Luckily Lucas Nuzzi and others sprang into action to clear up the issue and set the record straight. Hasu also released an excellent post on the Deribit Insights blog with a more technical explanation of what happened. Unfortunately, some holders got spooked in the process and sold their holdings as prices plummeted.

In a separate incident, stories began circulating on January 21st that incoming treasury secretary Janet Yellen stated that cryptocurrencies were mainly used for illicit financing and that it would be important to crack down on illegal use cases. Not only is the claim untrue, but it was also taken out of context.
Coincidentally, on the same day, a Chainalysis research report was released that revealed that BTC used for illicit activity had significantly dropped in 2020, and represented less than 1% of all transactions. Furthermore, Yellen’s full written remarks were more nuanced. In the full quote Yellen states that she thinks “we need to look closely at how to encourage [crypto's] use for legitimate activities while curtailing their use for malign and illegal activities,” but does not claim that a majority of use cases are illegal.
There have also been renewed concerns circulating about Tether. Tether (USDT) has come under fire in the past and is still in the crosshairs of the NY Attorney General and other regulators. But the new round of fear around Tether misrepresents how it is being used and misinterprets much of the data.
The most widely circulated article alleges that unbacked Tether is being used to pump up the BTC markets citing the large flow of USDT to BTC compared to USDT to BTC as evidence. But the article’s author doesn’t mention that USDT is used extensively in China. Given China’s relatively strict regulations against trading fiat for crypto USDT is used to trade against BTC and other cryptos. It is also reportedly used for capital flight and to move money across borders. These are huge sources of USDT activity, but China is not mentioned at all in the article.
Additionally, the current rally is being driven by institutions, so just looking at USD trading volume on retail focused exchanges drastically underrepresents the amount of USD flowing into BTC. Lastly, stablecoin supply in general has exploded since March, 2020. Supply of the second largest stablecoin, USDC, has increased by over 10x over the same period. But that of course does not mean that it is directly responsible for BTC’s price rise. Correlation does not imply causation - there are many reasons for the rise of stablecoins over the past year.
Source: Coin Metrics Network Data Charts
While the FUD caused some investors to panic-sell there are likely also other factors at play in the recent BTC price drop. Sophisticated investors may be taking advantage of the temporary fear to accumulate more BTC.
Institutional investors have continued to buy BTC over the last week. The number of addresses holding at least 1K BTC (over $30M) increased by about 25 over the past week to a total of 2,443, signaling that the number of large holders is increasing.
Source: Coin Metrics Network Data Charts
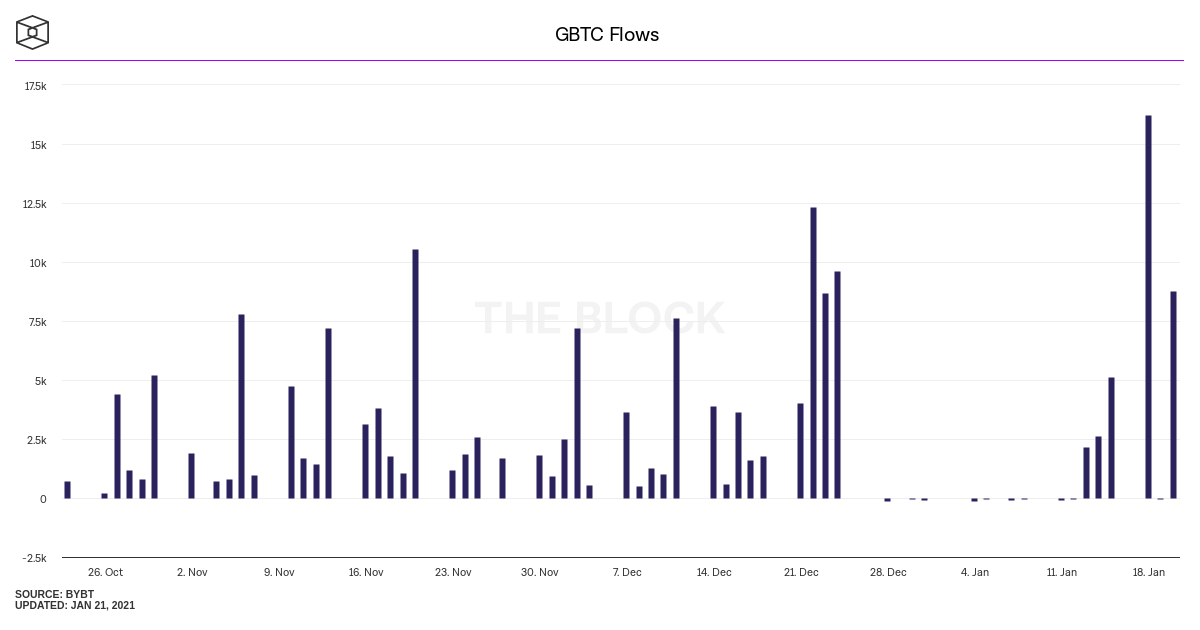
Money also kept on flowing in the Grayscale Bitcoin Trust (GBTC) over the last week. GBTC is one of the main ways that institutions get exposure to BTC.
Additionally, asset management giant BlackRock, which has over a trillion dollars under management, filed with the SEC to potentially engage in BTC futures. Although still preliminary, this is yet another signal that the biggest financial institutions in the world are moving into crypto.
Fear, uncertainty, and doubt are sure to pick up as the attention around BTC grows. But the largest holders appear undeterred, and ready to keep on accumulating.
Network Data Insights
Summary Metrics
Source: Coin Metrics Network Data Pro
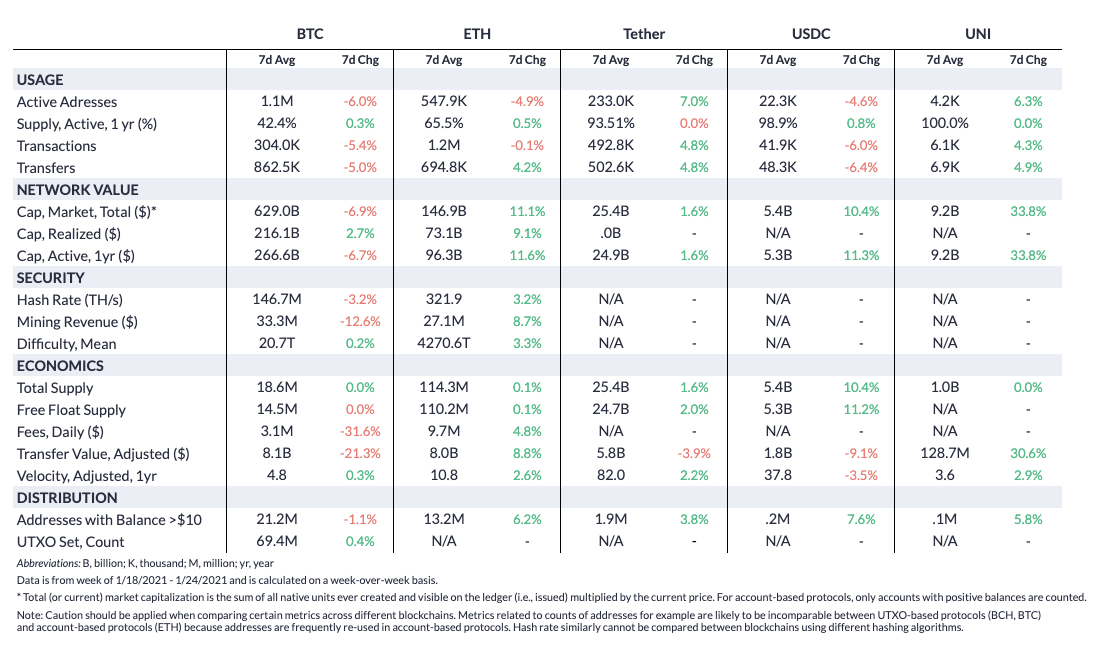
ETH regained ground on BTC this past week after a surge over the weekend. ETH market cap grew by 11.1% week-over-week compared to a 6.9% drop for BTC.
ETH active addresses dropped on the week despite the growth in market cap. But most other ETH on-chain metrics were in the green. Ethereum hash rate continues to climb to new all-time highs, with a 3.2% increase on the week.
USDC and UNI both also had big weeks as decentralized finance (DeFi) continues to grow. UNI market cap increased 33.8% as price crossed $10 for the first time. USDC market cap grew by 10.4%, over 6x as much as Tether’s weekly growth.
Network Highlights
ETH realized cap has grown by over $25B since the start of the year and has soared to new all-time highs. Realized capitalization was introduced in 2018 and is calculated by valuing each unit of supply individually at the price that it was last transacted on-chain. Therefore it discounts the price of coins that were last moved during periods where price was relatively low. ETH’s large increase in realized cap potentially signifies that new capital is flowing in, as old coins are increasingly being moved as price climbs.
Source: Coin Metrics Network Data Charts
The number of addresses holding at least 10K ETH has also increased significantly since the beginning of the year. There are now 1,241 addresses that hold at least 10K ETH, up from 1,178 on January 1st. These large addresses, each holding roughly at least $14M, potentially signal that institutional investors are starting to buy ETH.
Source: Coin Metrics Network Data Charts
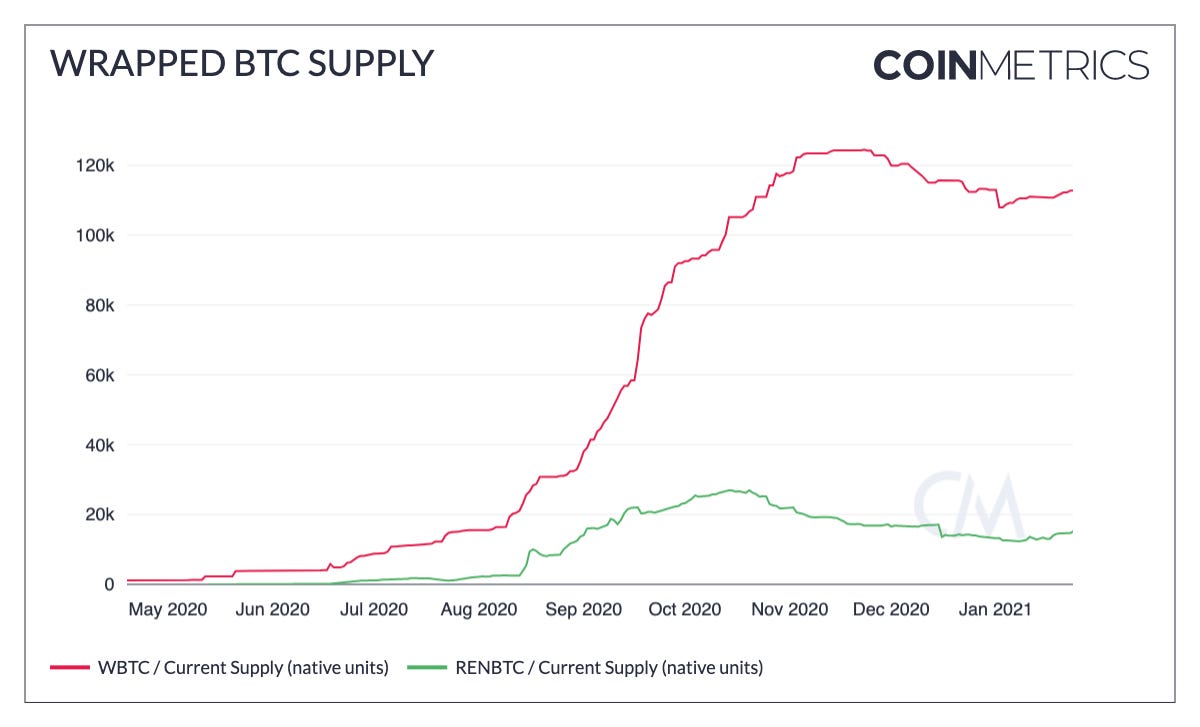
The amount of wrapped BTC on Ethereum has started to tick back up after declining to end 2020. WBTC supply has increased by about 5K since January 2nd. RenBTC supply, another variant of wrapped BTC, has increased by about 2K over the same period. Wrapped BTC is used heavily in DeFi so the increase in supply could mean capital from BTC is flowing back into the DeFi ecosystem.
Source: Coin Metrics Network Data Charts
Coin Metrics Updates
This week’s updates from the Coin Metrics team:
We’re excited to announce the new Coin Metrics mobile app. View real-time cryptoasset pricing and relevant on-chain data in a single app! Download for free here: https://coinmetrics.io/mobile-app/
As always, if you have any feedback or requests please let us know here.
Subscribe and Past Issues
Coin Metrics’ State of the Network, is an unbiased, weekly view of the crypto market informed by our own network (on-chain) and market data.
If you'd like to get State of the Network in your inbox, please subscribe here. You can see previous issues of State of the Network here.
Check out the Coin Metrics Blog for more in depth research and analysis.


