Coin Metrics' State of the Network: Issue 75
Tuesday, November 3rd, 2020
Get the best data-driven crypto insights and analysis every week:
Weekly Feature
Following Flows: A Look at Miners’ On-Chain Payments
By Karim Helmy and the Coin Metrics Team
The following is an excerpt from a full-length report which has been truncated due to space limitations. Read the full report here.
Key Takeaways
Using a new methodology that looks at addresses one hop out from the coinbase transaction, this report quantifies miner holdings and activity. This approach improves on previous attempts at tracking miner spending, which inadvertently measured pool operator activity rather than miner behavior.
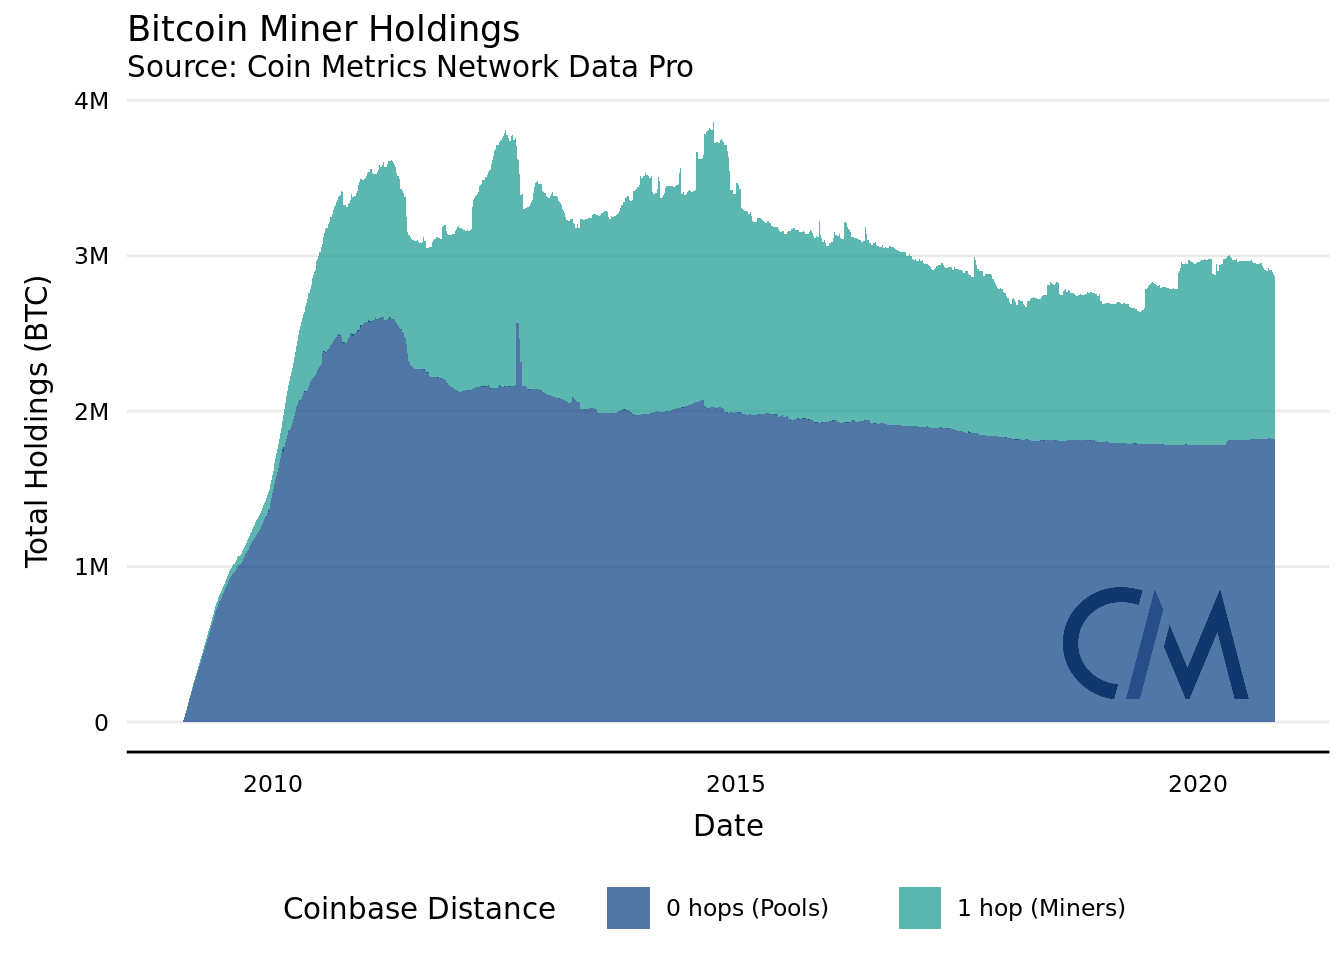
Miners accumulated an additional 318,000 BTC in the year leading up to the halving, from trough to peak.
With supply held by miners gradually decreasing and net flows from their addresses stabilizing, miners appear to be exerting less influence on the network.
Miner flow and supply metrics will be made available in the upcoming version 4.8 release of Network Data Pro.
Miners and Markets
In addition to their role in securing the network, miners have a profound effect on Bitcoin’s market dynamics. Because they can receive newly issued bitcoin rather than buying it, miners are natural net sellers of the asset. This effect is further compounded by the fact that miners’ operating expenses, chiefly electricity and rent, are primarily fiat-denominated, while their revenue is earned in bitcoin.
Using previously-unavailable data on accounts that have interacted with these addresses, this feature examines miners’ activity, assessing the drivers and impacts of their spending.
While on-chain data indicates miners’ influence on the network is gradually decreasing, they remain key players in the ecosystem with access to large amounts of capital. To help our users understand these actors, Coin Metrics is making a broad slice of miner-related data available in the upcoming version 4.8 release of Network Data Pro. Using this data, this feature finds that the supply held by miners has generally decreased over time and that the flows of funds to and from miners and pools have been dampened by the network’s successive halvings.
Summarizing Supply
To calculate miner flows, we begin by aggregating all addresses that have received payment from a coinbase transaction and labeling those as 0-hop addresses. All the addresses in this set, along with those that have received payment from an address in this set, are then tagged as 1-hop addresses.
Because of how mining pool wallets are typically structured, with pools initially receiving the block reward and only later distributing it to miners, 0-hop addresses generally represent mining pools and 1-hop addresses generally represent miners. For this reason, existing systems that attempt to extrapolate miner behavior from the spending habits of 0-hop addresses are theoretically unsound and do not measure what they purport to. Instead, they measure pool operators’ activity.
Admittedly, tagging miners and pools based on distance from a coinbase transaction is an imperfect technique. This is especially true when the methodology is applied to the early network, in which solo mining and alternative pool models were more popular. Because the first mining pool, Slush Pool, mined its first block in December of 2010, measurements from before this date in particular should only be used for reference. Furthermore, miner addresses that have not received funds from a 0-hop address will not be tagged. All told, though, this heuristic represents a significant improvement over the current state of the art and should accurately capture broad trends.
Miners, especially those active in the network’s early days, control a significant amount of bitcoin. The number of coins held by both 0-hop and 1-hop addresses has generally declined throughout the network’s history. H2 2019 and H1 2020 saw a significant reversal in this trend in the run up to the halving, however, with miners accumulating an additional 383,000 BTC from trough to peak. This effect was primarily confined to 1-hop addresses, with 0-hop supply remaining roughly flat—the bulk of this accumulation would therefore have remained undetected by previous estimation techniques.
Several jumps in the supply held by miners are visible. These spikes are typically caused by addresses with significant balances mining their first block or making their first interaction with a previously-tagged 0-hop address. The most prominent of these jumps occurred on August 16, 2012, when a whale holding over half a million BTC received part of the coinbase reward for block 194,256. New entrants were also responsible for the increase in miner-controlled supply before this year’s halving.
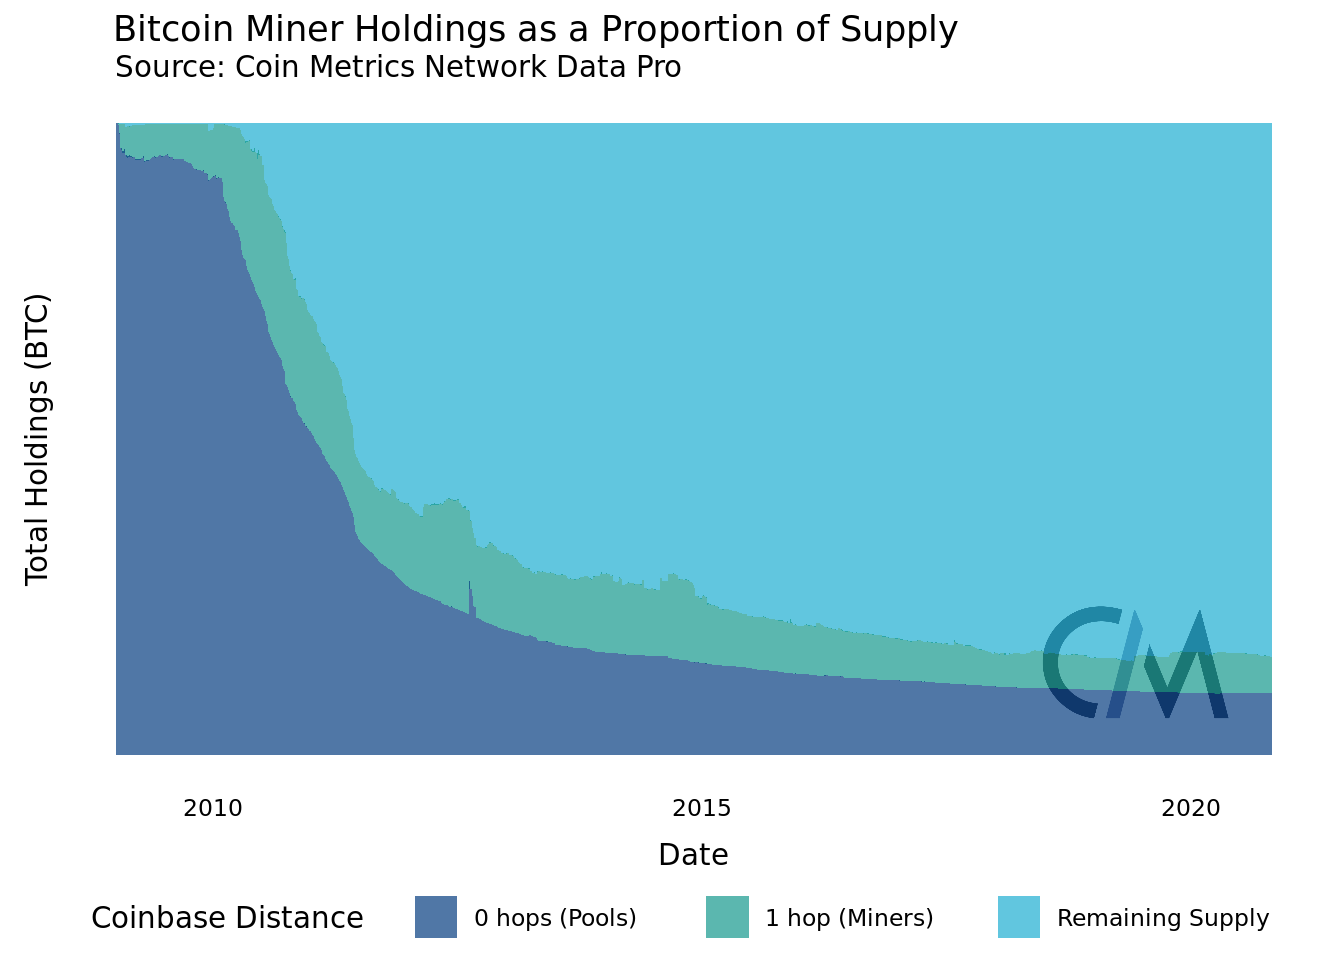
Due to inflation, the gradual reduction in supply held by miners and pools is even more significant when viewed in the context of total supply. This decrease is in line with a general increase in bitcoin’s supply dispersion. It's also consistent with more widespread adoption of the pool model, which implies that non-mining addresses are becoming less likely to be superfluously tagged as 1-hop addresses.
Even today, though, miners and pools control a substantial chunk of the total bitcoin supply.
Pools and Payments
The flow of funds to and from these groups is another potent on-chain signal. Because pools are typically the immediate recipients of coinbase rewards, 0-hop flows are a useful indicator of mining pool activity. With the exception of several spikes, the most notable of which is attributable to the aforementioned whale, 0-hop inflows and outflows have both trended downward in BTC terms since the early days of the network.
Continue reading “Following Flows: A Look at Miners’ On-Chain Payments” here…
Network Data Insights
Summary Metrics
Source: Coin Metrics Network Data Pro
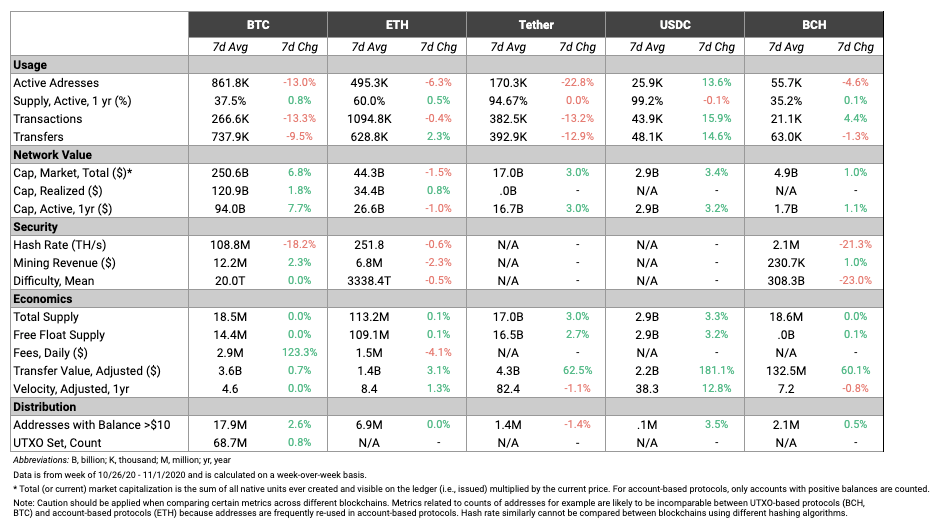
Bitcoin (BTC) network metrics had a mixed week. BTC transaction fees broke out this past week, growing 123.3% week-over-week and averaging close to $3M per day. BTC had almost twice the amount of total fees as Ethereum (ETH) this past week, reversing the trend of the last four months.
But other BTC metrics dropped. Most notably, hash rate dropped by 18.2% week-over-week after it almost reached new all-time highs just a few weeks earlier. Block production slowed as a result of the hash rate drop, which led to a drop in the overall amount of transactions and transfers. For more about this and the reasons behind the sudden drop see today’s Network Highlights section.
One other thing to note: USDC had over $11B of transfer value (adjusted) on October 26th, smashing its previous all-time high of $2.11B. However the huge spike was likely due to the recent Harvest Finance exploit, which involved a series of USDC flash loans.
Network Highlights
On October 29th and 30th BTC median transaction fee reached over $7, its highest level since January 2018. While there are many factors at play, the median fee spike is an interesting example of how weather conditions in a specific region of the world can have a ripple effect across the entire Bitcoin network.
Source: Coin Metrics Network Data Charts
From October 24th to 28th Bitcoin’s hash rate suddenly began to fall, dropping by about 35% in total. Hash rate often fluctuates but this was a particularly large drop, especially considering that price was simultaneously rising which typically attracts more miners to the network.
Although it’s difficult to pin down the exact cause of the drop, the leading theory is that it was related to the end of the rainy season in southwestern China. During the wet season there’s excess water which is used for hydro energy, resulting in relatively cheap electricity. But when the weather dries up many miners are forced to move their operations to different locations in search of cheaper electricity.
The sudden drop in hash rate caused the average time between new Bitcoin blocks to shoot up its highest levels in years. Less hash rate devoted to finding new blocks means that less blocks are produced. The following chart shows hash rate (left hand axis) vs mean interval between blocks in seconds (right hand axis) smoothed using a 7-day rolling average.
Source: Coin Metrics Network Data Charts
While block production slowed, incoming transactions did not. However, there was suddenly less block space to process the incoming transactions, due to the decrease in hash rate. This led to a large surge in the amount of unconfirmed transactions in the Bitcoin mempool. Despite the mempool surge, the on-chain transaction count dropped, as a much larger proportion of those transactions were stuck pending in the mempool waiting for some open block space.
Source: Coin Metrics Network Data Charts
All together, this led to the surge in BTC transaction fees. Paying a higher fee leads to a higher chance that miners will prioritize the transaction and include it in a block. With block space at a premium, users were willing to pay higher and higher fees to try to get their transactions confirmed in a timely manner.
If the hash rate drop was truly caused by migrating Chinese miners we should see hash rate bounce back up in the upcoming weeks as operations get back up and running. It will be interesting to monitor moving forward, especially as more and more miners move to frontier markets like Iran, which are less weather-dependent.
Market Data Insights
Bitcoin (BTC) was clearly the main narrative when we look back on the month of October. BTC boomed following the narratives of inflation fears, election hedges, and the parade of companies moving some portion of their balance sheet into the asset class. BTC ended the month up ~30%, which puts it just under one standard deviation of monthly returns from the mean of 31% over the past 5 years.
Source: Coin Metrics Market Data Feed
In terms of absolute U.S. dollar moves, October was a notable close. With a gain of $3,194 from Oct. 1 to 31, there has only been 1 month in the last 5 years with a larger move. That month was December 2017, where Bitcoin moved $3,432 from $10,711 to $14,149. This gives the recent move some valuable context.
One of the reasons that this recent move feels ‘healthier’ is the relatively low levels of realized volatility. Even though the 30 day moving average recently moved back up following last week’s price action, it still remains below the 50 mark and continues to trade in a historically low range.
CM Bletchley Indexes (CMBI) Insights
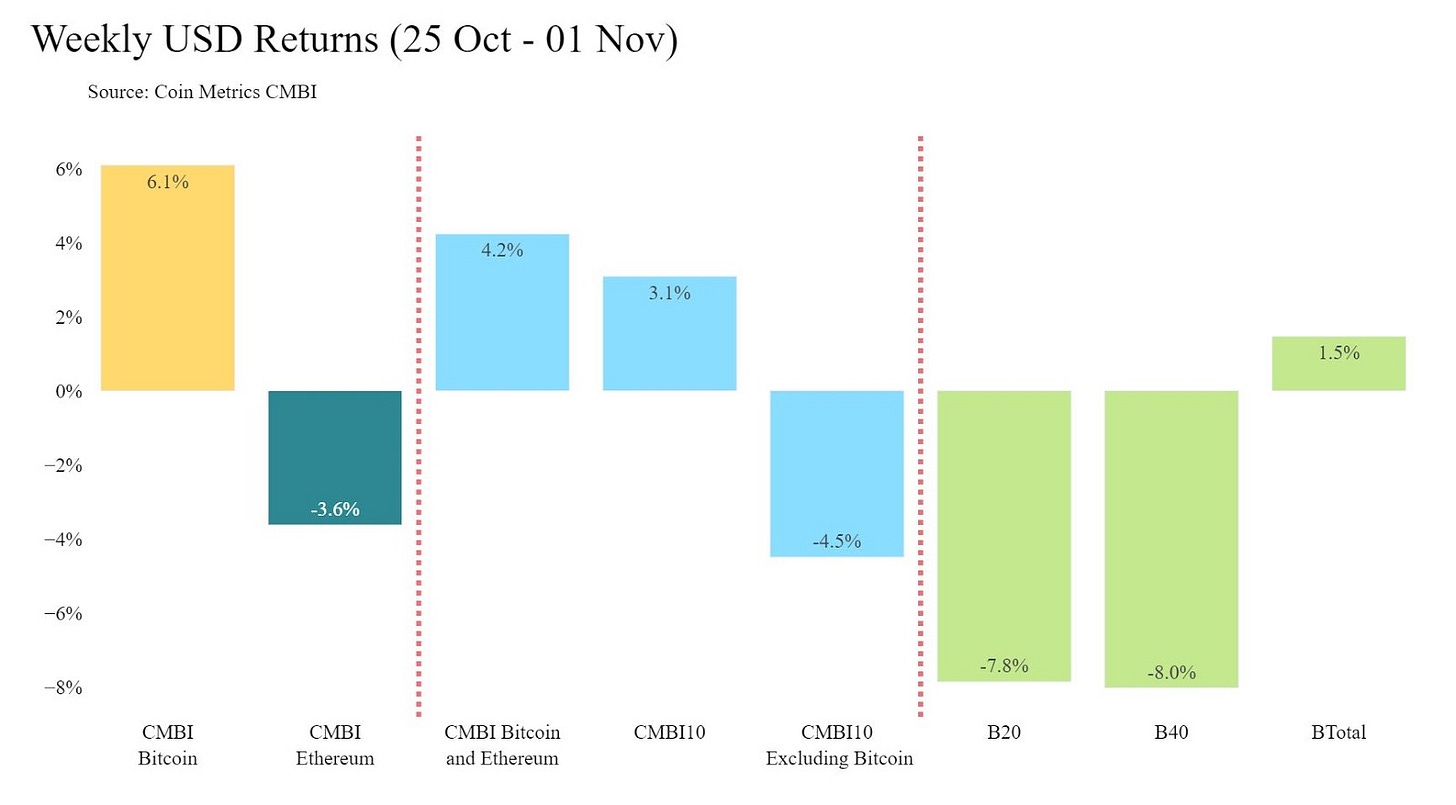
Again this week was characterized by the strength in large cap assets, in particular Bitcoin. The CMBI Bitcoin was the strongest performer of the CMBI and Bletchley Indexes, closing the week at $13,832.05, up 6.1%. The CMBI Ethereum did not fare as well this week, closing down 3.6% at $393.23.
Bitcoin’s strong performance resulted in losses across the rest of the asset class, evidenced by the negative performance of all of the multi-asset indexes that do not have Bitcoin as a constituent.
Coin Metrics Updates
This week’s updates from the Coin Metrics team:
We’re excited to announce the new Coin Metrics mobile app. View real-time cryptoasset pricing and relevant on-chain data in a single app! Download for free here: https://coinmetrics.io/mobile-app/
As always, if you have any feedback or requests, don’t hesitate to reach out at info@coinmetrics.io.
Subscribe and Past Issues
Coin Metrics’ State of the Network, is an unbiased, weekly view of the crypto market informed by our own network (on-chain) and market data.
If you'd like to get State of the Network in your inbox, please subscribe here. You can see previous issues of State of the Network here.
Check out the Coin Metrics Blog for more in depth research and analysis.


