Weekly Feature
Stablecoin Summer Review
The stablecoin wars heated up this summer. Now that summer is nearing an end, we took a look back at how the major stablecoins fared over the last three months.
Paxos (PAX), USD Coin (USDC), and Dai (DAI), all exhibited strong growth over the last three months, measured by the total number of addresses holding at least $10. TrueUSD (TUSD) and Tether (”Tether” includes both USDT, which is the Omni version of the Tether protocol, and USDT-ETH, which is the Ethereum version) both had moderate growth, while Gemini Dollar (GUSD) declined. The below chart shows the growth of stablecoin addresses with at least $10 from June 1st to September 1st.
Total number of addresses that hold at least $10 worth of an asset can be used to get an approximate measure of total users. The $10 cutoff is somewhat arbitrary; alternatively, we could look at addresses with at least $1, or $100. But we typically use $10 to approximate users since it is small enough to potentially represent a retail investor (as opposed to an institution) but large enough to be a non-dust account.

Although Tether (both USDT and USDT-ETH) did not grow as much as some of the other stablecoins over the last three months, USDT-ETH (i.e. the Ethereum version of the protocol) experienced rapid growth. However it came at the expense of the Omni version of the protocol. The transition from USDT to USDT-ETH is happening relatively quickly, with USDT-ETH poised to surpass USDT in most major metrics over the coming months. The following chart shows the total amount of addresses with greater than $10 worth of USDT and USDT-ETH, respectively.

Additionally, Tether remains the dominant stablecoin in terms of overall users. Although PAX, DAI, and USDC are growing faster than Tether, they are still orders of magnitude behind both USDT and USDT-ETH in terms of the total number of addresses holding at least $10. The following chart shows the number of addresses with greater than $10 as of September 1st:

Total supply is another important metric to track for stablecoins. Total supply represents a stablecoin’s approximate market cap, assuming that each stablecoin is worth $1.00 USD. PAX, USDC, and Tether supply all grew over the summer (June 1st to September 1st), while DAI, TUSD, and GUSD all declined.

However, similar to addresses with at least $10, Tether still dominates all other stablecoins in terms of total supply. The below chart shows stablecoin total supply as of September 1st.

Lastly, looking at a stablecoin’s price growth percentage over the last three months (i.e. daily growth compared to June 1st) shows an approximation of price stability. This is an important consideration for stablecoins, since the price should ideally stay stabilized (hence the name). As shown in the below chart, DAI, GUSD, and Tether all experienced relatively volatile periods over the last three months, while PAX and USDC were more stable.

Network Data Insights
Summary Metrics

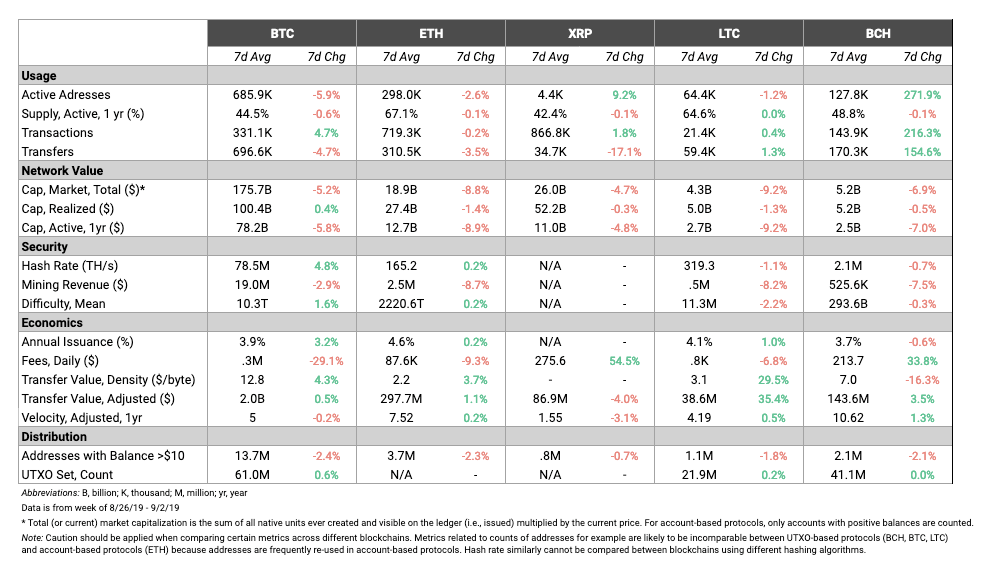
Last week was relatively volatile for most of the major crypto networks. Market cap decreased for BTC, ETH, XRP, LTC, and BCH. However, transaction count increased for all of those assets, except for ETH, which fell by only 0.2%.
BCH had a huge spike in active addresses and transactions, both increasing over 200% over the past week. However, BCH’s adjusted transfer value only grew by 3.5%. Although BCH had a large increase in both transactions and transfers, those transactions likely included relatively small amounts of BCH.
Network Highlights
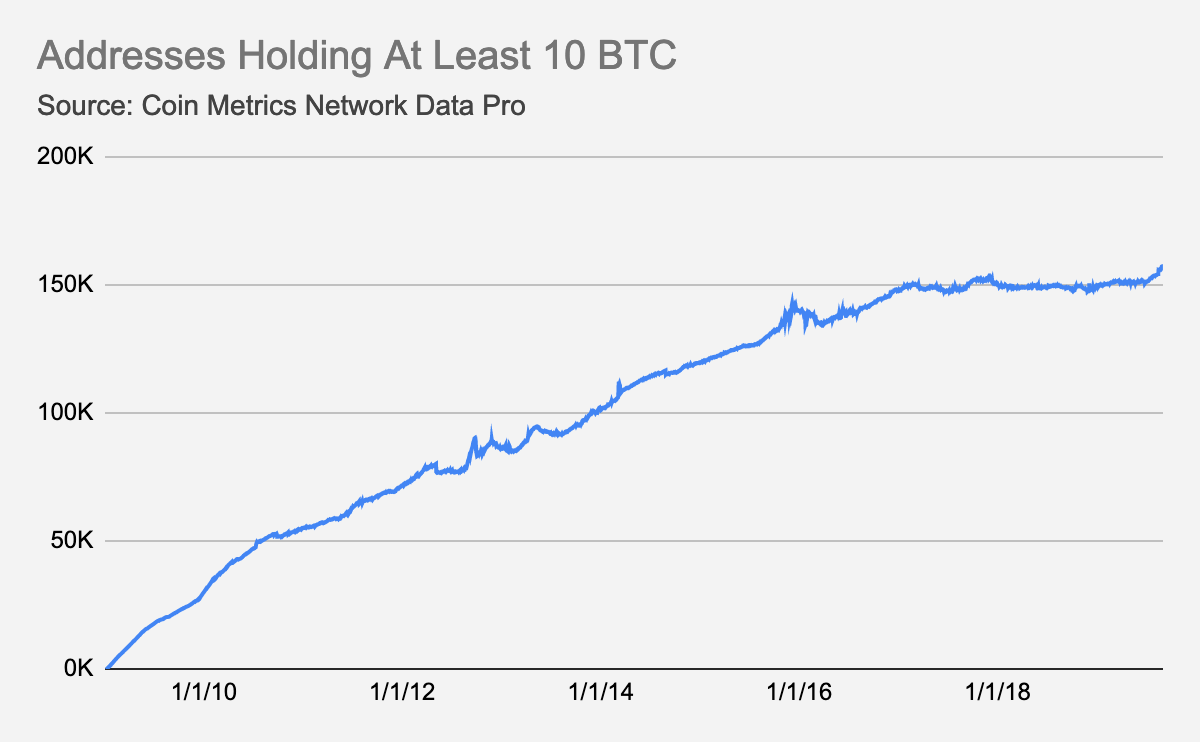
The number of addresses holding at least 10 Bitcoins recently hit an all-time high. As of September 1st, there are 157,216 addresses holding at least 10 BTC.

The number of Ethereum addresses holding at least one ten-billionth of current supply also recently hit an all-time high. As of September 1st, 5,923,953 ETH addresses hold at least one ten-billionth of ETH supply. Currently, this is the equivalent of holding at least 0.0108 ETH (worth $1.86 USD at current prices), given ETH’s supply of 107,568,118 as of September 1st.

Market Data Insights
Bitcoin Outperformance Continues
Major assets declined this week with the exception of Bitcoin (+4%) and Bitcoin Cash SV (+0.4%). Bitcoin outperformance continued over this time period. Despite a market-wide sell-off earlier in the week, Bitcoin has since rallied and recovered all its losses while other assets are still significantly down.

Market action over the past week confirms the longer-term trend of Bitcoin outperformance. Over the past three months, Bitcoin has experienced strong returns (+37%) while other assets are struggling and have lost as much as half of their value, including EOS (-47%), Stellar (-48%), and TRON (-53%).

No Signs of Market Manipulation on August 28 Sell-Off
The pattern of sharp market-wide movements in price continues. Coin Metrics has written extensively about this in past State of the Network issues. Futures exchanges (most notably BitMEX and CME) are important venues where significant trading activity and price discovery take place and allow traders to use leverage for either long or short positions. Due to these factors, certain market participants are incentivized to trade in a manner to maximize price impact on more illiquid spot markets to engineer price movements that can trigger forced liquidations, short squeezes, and margin calls.
Despite previous examples of this type of activity, the sell-off that occurred on August 28 did not leave any of the standard signs of market manipulation.

The earliest indication of increased trading activity occurred on Coinbase’s BTC-USD market during a 20-second window around 17:54 UTC. Three large sells were executed at $10,240 in which a total 72 Bitcoin were sold, equivalent to roughly $740,000. Such concentrated activity was unusual as there was no news-related catalyst immediately prior to this, prices were fairly stable immediately prior, the size of the three trades were extremely large, and no similar increase in trading activity was observed on other exchanges.
While this aggressive selling may have triggered the sell-off, no indication of sustained selling or large spreads between major markets were observed, so market manipulation is likely not present in this case. One possible explanation is that the large sells on Coinbase’s market may have triggered a response from several trading algorithms employed by market-makers and quantitative traders. Under a period of relative calm in the markets, algorithms may interpret the presence of sudden, concentrated selling as an informed trader (that knows potentially market-moving information) and adjust their bids and offers accordingly. The initial response can then snowball as small abrupt changes in price can trigger liquidations of leveraged futures positions which in turn trigger further declines in price. Importantly, Coinbase is a constituent exchange in both BitMEX’s Bitcoin price index and CME CF’s Reference Rate, so trading activity on this exchange is closely monitored.
Smaller Assets Led the Sell-Off But Were Not the Initial Catalyst
Smaller assets declined first during the sell-off on August 28 but likely were not the catalyst. Coin Metrics investigated trading activity in key assets during this time period and did not detect the presence of any suspicious trading activity.
Here we show Coin Metrics’ Real-Time Reference Rates, which generate prices once a second and are generated using a robust market whitelisting framework and a calculation methodology that is resistant to manipulation and data errors. Notably, price movement in the smaller assets occurred starting at 17:55, one minute after the concentrated selling was observed in Coinbase’s BTC-USD market.

CM Bletchley Indexes (CMBI) Insights
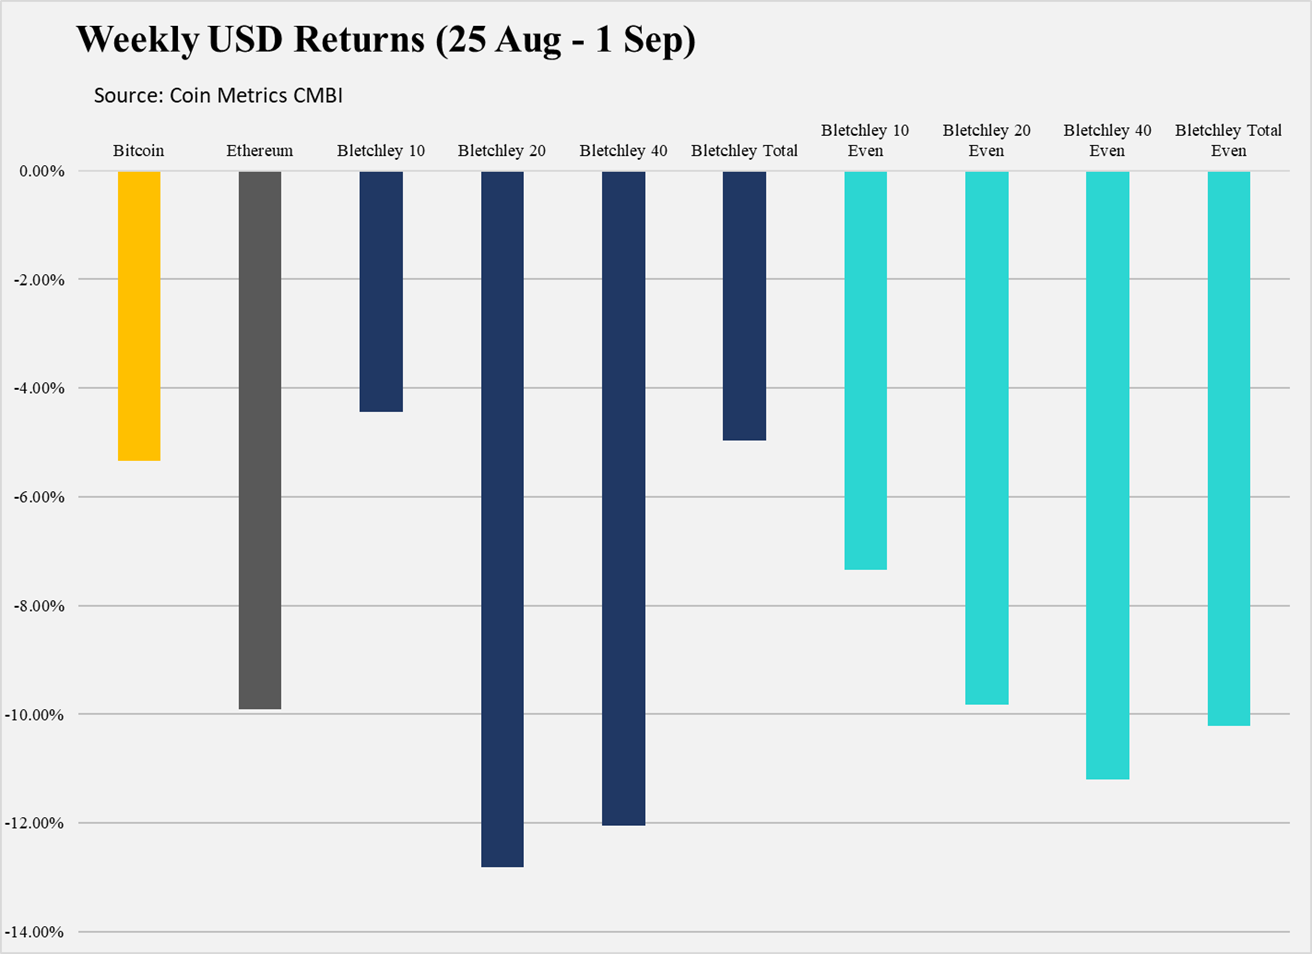
There was a market wide sell-off of crypto assets this week off the back of Bitcoin falling below the psychological $10,000 barrier. This led to a greater sell-off in the less liquid medium cap and small cap assets as demonstrated in the returns of the Bletchley 20 and Bletchley 40 below.

Further, for the second consecutive month all Bletchley Indexes experienced drawdowns with low market cap assets performing the worst. Despite reporting the increased strength of the mid cap and small cap indexes in the last two SOTNs, after the dramatic price falls this week, both continue to reach new lows in relation to Bitcoin’s price.

Coin Metrics Updates
This week’s updates from the Coin Metrics team:
We’re excited to announce the release of our Real-Time Reference Rates Beta! Read more about the details of the release here.
In conjunction with the release of the beta version of CM Real-Time Reference Rates, we have provided a summary of Coin Metrics’ substantial research and backtesting. You can read the summary here.
Additionally, we added support for two new assets: LEO and LINK. Read more details here.
Coin Metrics is hiring! We recently opened up 7 new roles, including Blockchain Data Engineer and Data Quality and Operations Lead. Please check out our Careers page to view the openings.
State of the Network (SOTN) was published on Wednesday this week due to the Labor Day holiday. SOTN will move back to its normal publication time (Tuesday, 8:00 AM EST) next week.
As always, if you have any feedback or requests, don’t hesitate to reach out at info@coinmetrics.io.
Subscribe and Past Issues
Coin Metrics’ State of the Network, is an unbiased, weekly view of the crypto market informed by our own network (on-chain) and market data.
If you'd like to get State of the Network in your inbox, please subscribe here. You can see previous issues of State of the Network here.
Check out the Coin Metrics Blog for more in depth research and analysis.
