Get the best data-driven crypto insights and analysis every week:
And check out our new market-data focused weekly newsletter State of the Market.
Weekly Research Focus
Measuring Ethereum Miner Activity
By Nate Maddrey, Karim Helmy, and the Coin Metrics Team
The Ethereum community has always had a somewhat strained relationship with miners. The network’s proof of work algorithm, Ethash, was explicitly designed to be resistant to ASIC mining and hence miner professionalization.
With new technological developments in the works Ethereum’s relationship with miners is coming under fire once again. Ethereum Improvement Proposal (EIP) 1559 is now officially on track to be included in Ethereum’s upcoming London hardfork in July. Once EIP-1559 is implemented a portion of every transaction fee will be burned, permanently removing it from circulation. As over 40% of Ethereum miner’s revenue is now being earned from transaction fees, EIP-1559 stands to potentially decrease total miner revenue, at least in the short-term.
Additionally, Ethereum developers are working towards building out Ethereum 2.0, the next phase of the protocol. Ethereum 2.0 will usher in a transition from Proof of Work to Proof of Stake, a completely new consensus algorithm. Although completion of Ethereum 2.0 is still years away, it will eventually phase out miners and replace them with stakers.
At this critical point in the network’s development it’s more important than ever to understand the role miners play in the Ethereum ecosystem. In his latest research piece, Following Flows III: Measuring Ethereum Miner Activity, Karim Helmy explores the data behind Ethereum miner activity.
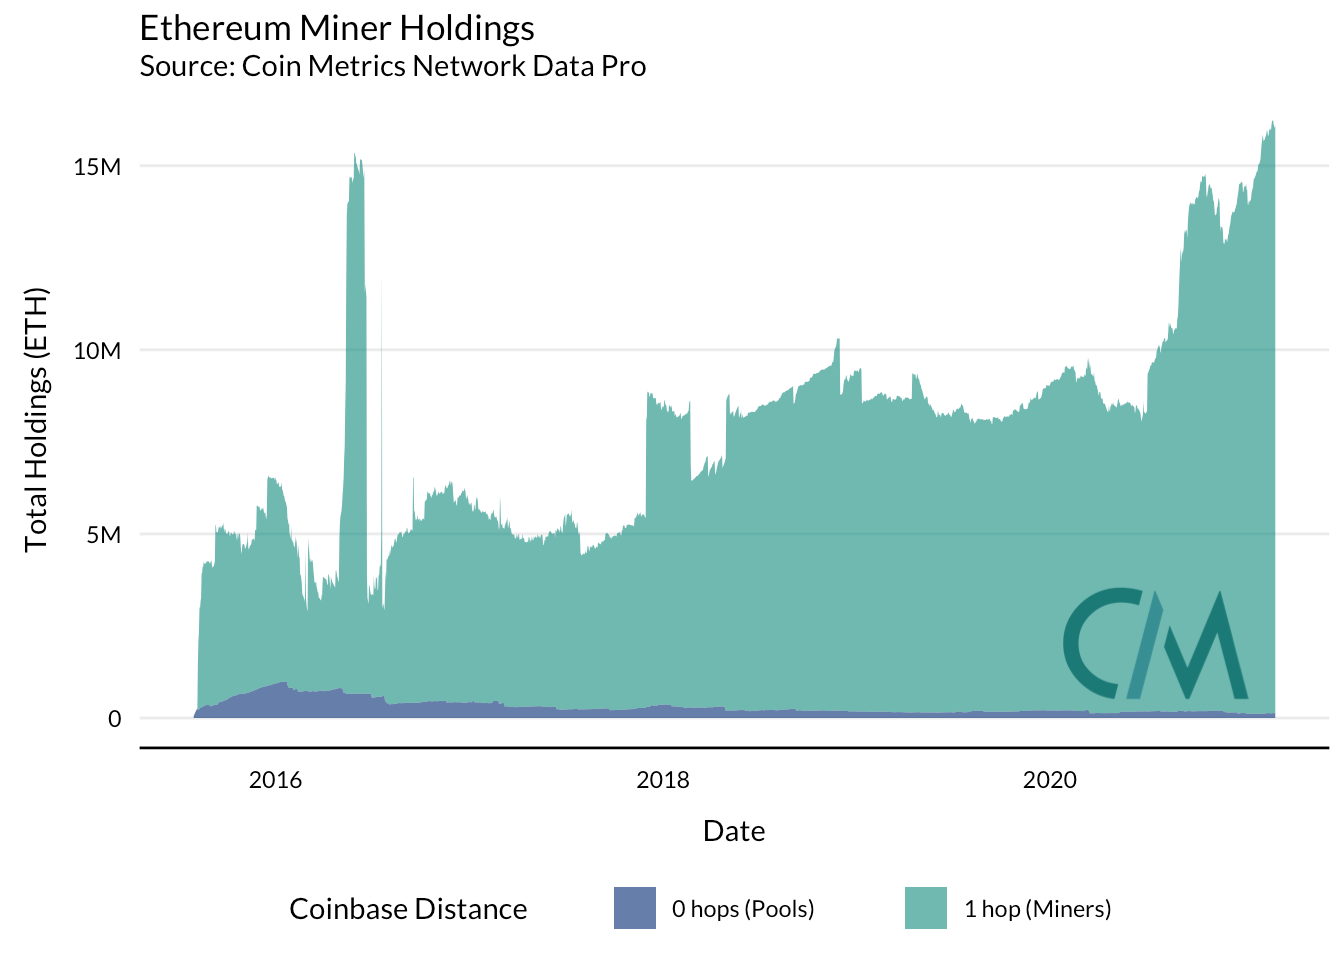
One key consideration is the amount of supply held by miners. Miners control an increasing amount of ETH, and the supply held by mining pools is comparatively small. In particular, the amount of ETH held by miners increased substantially in 2020.
But Ethereum miners’ holdings as a percentage of total supply have never been very high. Because of Ethereum’s premine, a majority of the native token supply was not generated by miners.
Like the gross values, net flows to miners has grown substantially over the past year. There are several reasons why the broader increase may be occurring, including simply maturation of the network. The most recent run-up, though, could be related to MEV: entities with relationships to mining pools may be performing on-chain arbitrages and liquidations to earn money outside the protocol-specified block reward.
Because they’re natural sellers of the asset they’re securing miners are frequently blamed for market volatility. In Ethereum, as in Bitcoin, these accusations are baseless, since miners typically account for a small single-digit percentage of exchange inflows. While a significant amount of miner selling occurs over-the-counter (OTC) and therefore does not immediately reach exchanges, changes in miner activity are not nearly large enough to warrant concern.
In the full piece, Karim conducts an in-depth analysis of Ethereum miner data including looking at flows between pools and individual miners, and flows from miners to exchanges. By providing insights on the role miners play in the network at this crucial time and making this data available in our new 4.9 release of Network Data Pro, we hope to provide some transparency in the activities of the miners securing the second-largest cryptoasset network.
Read the full piece on miner-exchange flows here:Following Flows III: Measuring Ethereum Miner Activity.
And to explore our miner flow data and other on-chain metrics check out our charting tool, formula builder, correlation tool, and mobile apps.
Network Data Insights
Summary Metrics
Source: Coin Metrics Network Data Pro
On-chain usage slowed down this past week as price was relatively flat. BTC daily active addresses declined by 2.3% week-over-week while ETH had a bigger drop of 8.2%. Transaction fees for both networks also dropped significantly, at least temporarily, with Bitcoin averaging $5.4M worth of fees per day compared to $15.3M for Ethereum.
Uniswap (UNI) had a big week with market cap surging to a new all-time high on Sunday. UNI active addresses increased 4.3% week-over-week and transfers increased by 10%. UNI also had a massive 470.3% increase in adjusted transfer value after it spiked to over $4.9B (from a daily average of less than $1B) on March 5th.
Network Highlights
Our latest Network Data release included new metrics on supply dispersion and equality in addition to our updated miner flows. One of the newly released metrics is the Supply Equality Ratio (SER), which can be used to quantify supply distribution.
The Supply Equality Ratio is inspired by the 20:20 Ratio - a traditional wealth inequality metric that compares the average income of the richest 20% of a society to the poorest 20%. Instead of income, the SER looks at supply held by different accounts within a network. It’s calculated by dividing the supply held by the smallest accounts (the sum held by all accounts with a balance less than 0.00001% of the supply) against the largest accounts (the sum held by all the top 1% addresses). A high SER therefore indicates a relatively distributed supply.
Out of the largest cryptoassets by market cap, BTC by far has the highest SER of 0.082. ETH is the second most distributed with an SER of 0.041. ADA, LINK, UNI, and DOT Supply Equality Ratio have also increased since the beginning of 2021.
Source: Coin Metrics Network Data Charts
Among the major DeFi assets UNI has a relatively high SER, likely due to its initial airdrop which distributed UNI to past users of the platform. AAVE and COMP also have relatively high SER’s. AAVE’s SER has increased significantly since the start of the year.
Source: Coin Metrics Network Data Charts
Tether SER has also shot up over the last few months as new supply has been issued. The Ethereum-version of Tether (USDT-ETH) has the highest SER out of the three variations that we track. But the Tron-version (USDT-TRX) is a close second, and closing ground. The Omni-version of Tether (USDT) has flatlined likely due to low usage.
Source: Coin Metrics Network Data Charts
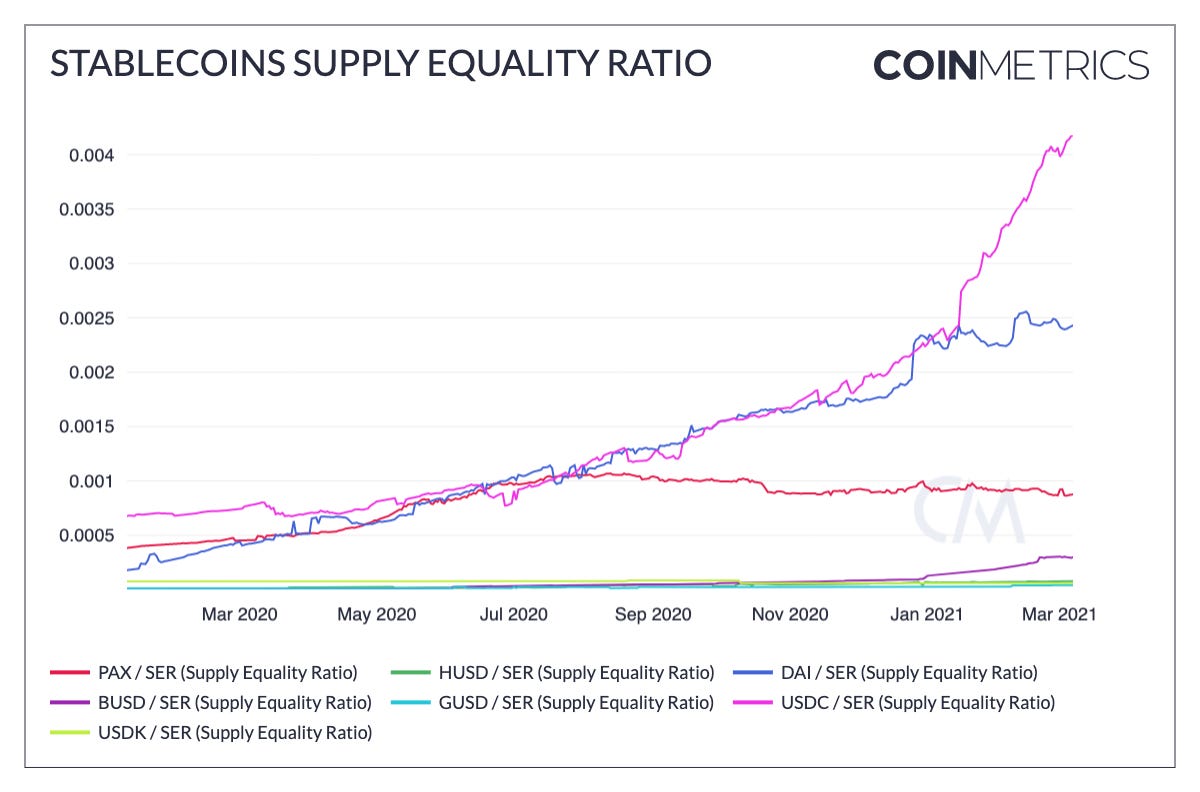
Among the other major stablecoins, USDC Supply Equality Ratio has grown along with its supply, which passed 9 billion last week. DAI’s SER has grown as well, although not as much as USDC’s.
Source: Coin Metrics Network Data Charts
Our new Network Data update also added coverage for new assets, including Polkadot (DOT), 1inch (1INCH), The Graph (GRT), Alpha Finance (ALPHA), and HuobiBTC (HBTC).
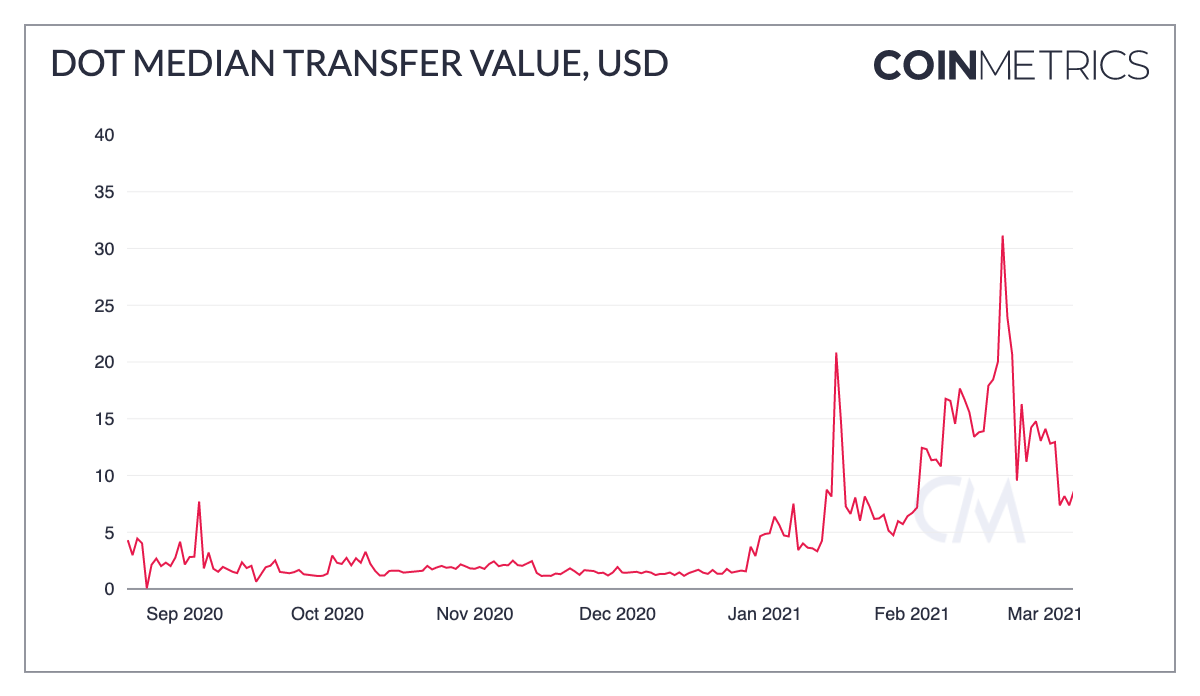
Polkadot (DOT) daily active addresses have been trending upwards after DOT market cap started to take off in January. DOT currently has about 15K unique active addresses per day.
Source: Coin Metrics Network Data Charts
So far, DOT transfers have been relatively small. DOT’s median transfer value has peaked at $30, compared to a current daily average of over $200 for ETH.
Source: Coin Metrics Network Data Charts
Coin Metrics Updates
This week’s updates from the Coin Metrics team:
Check out our new market-data focused newsletter State of the Market, featuring weekly updates on market conditions.
We’re excited to announce the new Coin Metrics mobile app. View real-time cryptoasset pricing and relevant on-chain data in a single app! Download for free here: https://coinmetrics.io/mobile-app/
As always, if you have any feedback or requests please let us know here.
Subscribe and Past Issues
Coin Metrics’ State of the Network, is an unbiased, weekly view of the crypto market informed by our own network (on-chain) and market data.
If you'd like to get State of the Network in your inbox, please subscribe here. You can see previous issues of State of the Network here.
Check out the Coin Metrics Blog for more in depth research and analysis.


