Coin Metrics' State of the Network: Issue 114
Tuesday, August 3, 2021
Get the best data-driven crypto insights and analysis every week:
Analyzing Tether and USDC Usage Patterns
By Nate Maddrey and Kyle Waters
The total supply of stablecoins is near 110B today, almost a 4x increase over the supply at the beginning of 2021. But this growth has not been distributed equally across stablecoins. Amidst an uncertain crypto market, the stablecoin market is also shifting.
The supply of USD Coin (USDC) has grown remarkably in 2021 from ~4B at the beginning of the year to over 26B today. USDC’s growth accelerated following the May crypto crash - USDC’s total supply has increased by about 75% since May 11th. Tether (USDT) still remains the dominant player in the stablecoin market with a total supply of over 64B, but USDT growth has flatlined since May. USDC is the second largest stablecoin behind Tether, and its share of total stablecoin supply is growing.
Source: Coin Metrics Network Data Charts
While Tether’s total supply growth has stalled, its free float supply has decreased over the last month. “Free float” supply is a metric developed by Coin Metrics that excludes supply that is considered illiquid. Tether’s decrease in free float supply represents supply that has been redeemed and sent back to Tether’s reserves. This free float decrease has been especially noticeable on Ethereum - the free float supply of Tether issued on Ethereum (USDT_ETH) has decreased by about 1B over the last 30 days, while the total supply has remained flat.
Source: Coin Metrics Network Data Charts
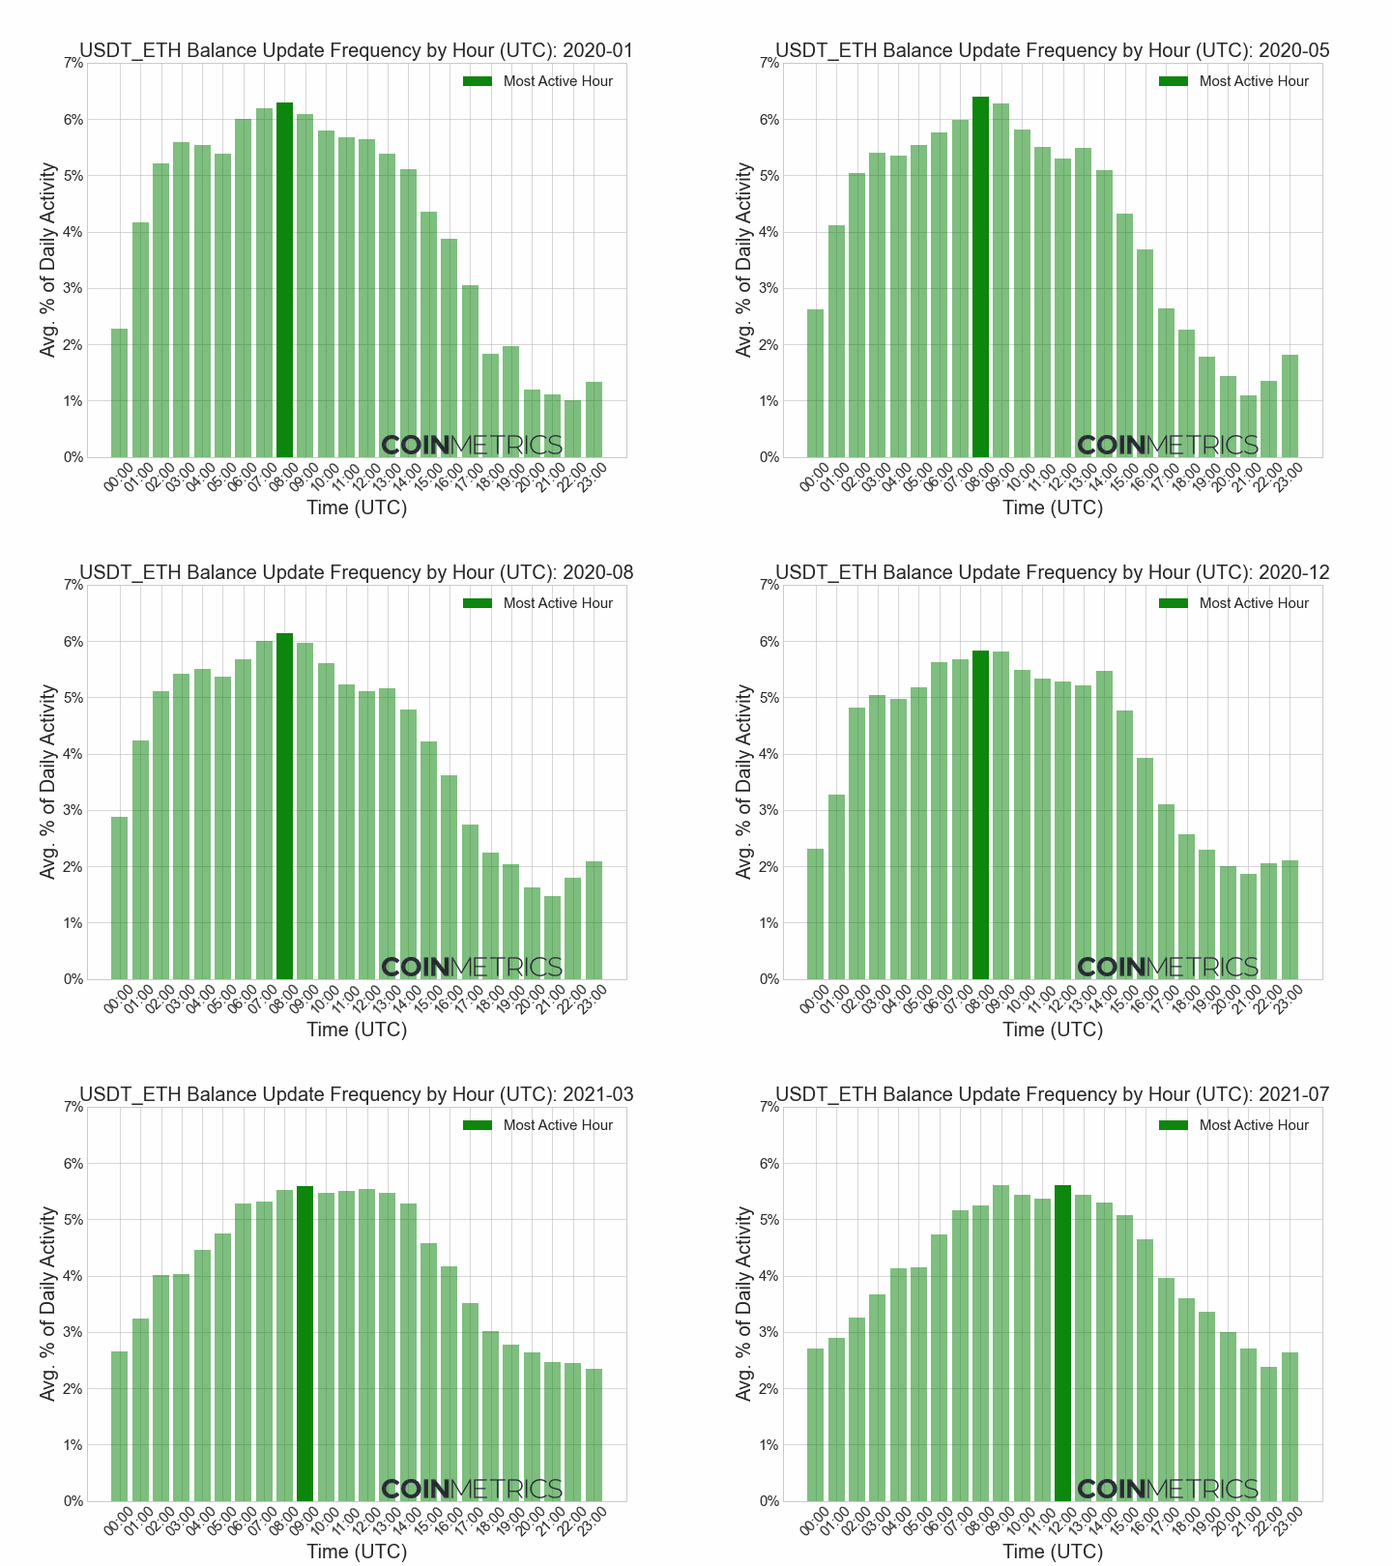
USDT_ETH’s daily usage patterns have also shifted recently. Historically, the bulk of Tether activity has mostly occurred during Asian business hours. The heatmap below shows the hours when Tether issued on Ethereum (USDT_ETH) is most frequently used. Darker reds correspond to the hours (in UTC) with a higher percentage of daily activity.
Throughout 2020 most activity was concentrated between 2:00 and 14:00 UTC, matching Asian / European business hours. The period from 6:00-8:00 UTC was especially busy, as indicated by the darkest red regions. For context, continuous trading at the Hong Kong Stock Exchange occurs from 1:30 UTC to 8:00 UTC, and the London Stock Exchange is open from 8:00 to 16:30 UTC. But over the course of 2021 this distribution has shifted slightly later in the day towards European/US market hours.
There are several potential contributing factors. While there’s over $30B worth of Tether issued on Ethereum, Tether is also issued on many other blockchains including Tron and Solana. Tether is typically used extensively for trading and some of that trading activity may be shifting to other blockchains that can offer lower fees than Ethereum. Additionally, the miner and investor migration out of China due to new government regulations may be causing a drop in Asia-based Tether activity. However, this would only explain changes since May and not earlier. USDT_ETH is also increasingly being used as collateral in DeFi protocols which may contribute to some of the usage shifts.
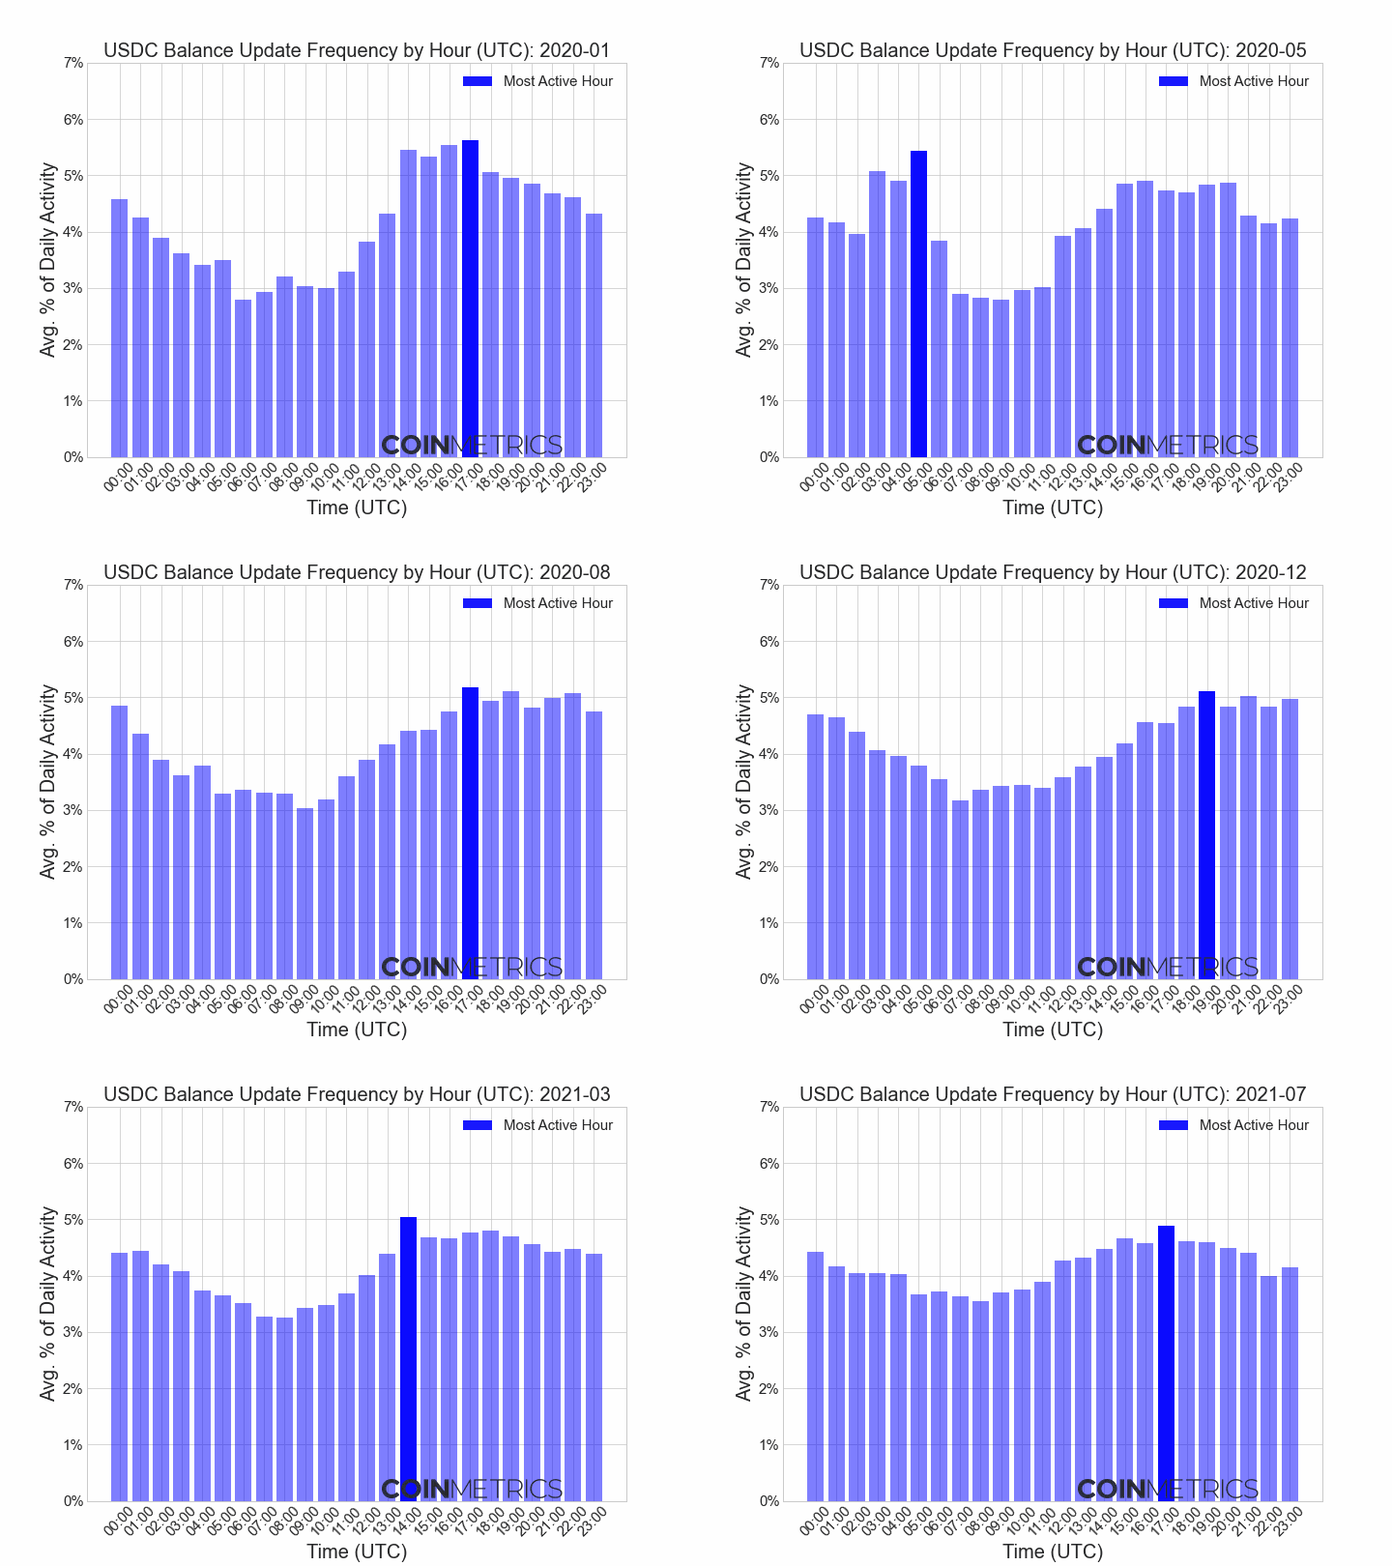
In contrast, USDC activity tends to follow US market hours, though it is slightly more distributed. The majority of daily activity tends to be between 14:00 and 22:00 UTC (for context, US equity markets open at 14:30 UTC and close at 21:00 UTC).
This distribution has also been fairly constant since 2020, suggesting that Tether is still the most dominant stablecoin used in Asian markets, although the overall activity may have decreased. In comparison, Bitcoin and Ethereum use tends to be far more equally distributed by time of day.
USDC and other stablecoins are being adopted for many reasons, but one major benefit of stablecoins over traditional settlement infrastructure (e.g. Fedwire) is that they run on crypto-native payment rails that operate 24/7, 365. The heatmap below breaks down USDC activity by day of week. On-chain data show that USDC is mainly used during weekdays, but has some activity during the weekends when traditional infrastructure is largely unavailable.
As stablecoins become a larger part of the total crypto market they’re also gaining more attention from the outside world. Regulators are turning their attention towards stablecoins at an increasing rate, and the impending rise of CBDCs may also impact stablecoins. It will be crucial to continue to study stablecoin usage patterns moving forward as stablecoins become an even larger part of the crypto ecosystem.
To follow the data used in this piece and explore our other on-chain metrics check out our free charting tool, formula builder, correlation tool, and mobile apps.
Network Data Insights
Summary Metrics
Source: Coin Metrics Network Data Pro
Bitcoin (BTC) and Ethereum (ETH) both had strong weeks with BTC surpassing the $40K mark and ETH clearing $2.5K. Hash rate continued to recover as mining operations start to get back online after migrating out of China. Bitcoin hash rate grew 9.7% week-over-week while Ethereum hash rate grew by 3.8%. On-chain activity has also risen with active addresses growing ~8% and ~9% over the last 7 days for BTC and ETH, respectively.
Network Highlights
EIP-1559, a highly anticipated and deliberated Ethereum Improvement Proposal (EIP), is set to go live this week (at block 12,965,000) as part of the series of London Ethereum upgrades. The current Ethereum transaction fee mechanism has sometimes been a source of confusion and frustration for users, especially after ETH fees hit new all-time highs earlier this year. EIP-1559 brings a fundamental change to how Ethereum fees work.
Source: Coin Metrics Network Data Charts
Breaking Down the Core Features of EIP-1559
The original EIP proposed in April 2019 is summarized as (emphasis added) “A transaction pricing mechanism that includes fixed-per-block network fee that is burned and dynamically expands/contracts block sizes to deal with transient congestion.”
Below we break down each part of this summary to illustrate how EIP-1559 will work.
“Transaction pricing mechanism”
To send a transaction or interact with Ethereum decentralized applications (dapps) users need to pay a fee. Ethereum fees are commonly referred to as “gas.” Similar to how a car needs gas to run, Ethereum applications need gas in order to be executed.
Currently, Ethereum employs what is known as a first-price auction to determine gas prices which can create uncertainty and inefficiency. Imagine being at a busy airport trying to hail a taxi. But instead of waiting in line to get a taxi you blindly bid the highest you would be willing to pay to complete that ride, without knowing what others in line were bidding. The taxi drivers, on the other hand, could see all the incoming bids and maximize their profits by selecting the top bidders.
This is a simplification of Ethereum’s current fee mechanism but ultimately users must think strategically about what other people will bid, which often results in overbidding or underbidding and leads to high fee volatility. For example, the chart below shows the mean and median transaction fee paid in GWEI by block for a sample of ~5,000 blocks on July 25, 2021. Note the large outlier blocks in which the mean (red) is far higher than the median (green). This suggests that some transaction senders were overpaying, since the median fee would be sufficient to get a transaction included in the block.
Source: Coin Metrics Network Data Pro
“Fixed-per-block network fee that is burned”
To improve fee predictability to the Ethereum user experience EIP-1559 introduces a base fee at each block. The base fee is a required payment to be included in a block and is programmatically determined based on the previous block. This in effect automates the gas price bidding system. Under the chosen parameters, the base fee cannot move up or down by more than 12.5% from one block to the next.
This provides something that is more akin to a predetermined list price that a user can reject or accept. However, the user has the option to also add a tip.
Potentially the most discussed component of EIP-1559, the base fee will be burned rather than paid out to miners. This is promising for Ethereum’s supply economics as it will permanently remove some ETH and lower supply inflation. Using some basic assumptions in which 75% of fees are burned, the chart below presents a historical scenario of ETH supply issuance with EIP-1559. Note that in times of high network congestion daily issuance can turn negative.
Source: Coin Metrics Network Data Charts
“Dynamically expands/contracts block sizes”
To determine how the base fee changes from block to block, the protocol needs to have an estimate of demand for block space. EIP-1559 completes this by introducing a target block size. In short, the maximum Ethereum block size will double from its current limit but target 50% capacity. If the preceding block was larger than the target block size (i.e. more than 50% full), the base fee increases and keeps increasing until block size falls back to its target. This escalating base fee eventually makes it too expensive for some users to transact, reducing congestion and causing block fullness to naturally move back towards 50%.
A common misconception of EIP-1559 is that it is intended to address high transaction fees and bring down average fees paid by users on-chain. But high fees are ultimately issues of scalability and are not functions of an inefficient or unpredictable fee mechanism. Scalability is being addressed via layer 2 (L2) solutions and the eventual upgrades planned for Ethereum 2.0. However, fee volatility should decrease on a block-by-block basis as a result of better fee predictability. For a more detailed analysis of Ethereum’s gas fee mechanism see The Ethereum Gas Report.
Coin Metrics Updates
This week’s updates from the Coin Metrics team:
Check out our market-data focused newsletter State of the Market, featuring weekly updates on market conditions.
As always, if you have any feedback or requests please let us know here.
Subscribe and Past Issues
Coin Metrics’ State of the Network, is an unbiased, weekly view of the crypto market informed by our own network (on-chain) and market data.
If you'd like to get State of the Network in your inbox, please subscribe here. You can see previous issues of State of the Network here.
Check out the Coin Metrics Blog for more in depth research and analysis.


