Coin Metrics' State of the Network: Issue 101
Tuesday, May 4th, 2021
Get the best data-driven crypto insights and analysis every week:
Read our latest in-depth research report here: The Crypto Futures Data Primer.
Weekly Research Focus
Ethereum’s Institutional Evolution
By Nate Maddrey and the Coin Metrics Team
Ether (ETH) once again reached new all-time highs this past week. Price climbed to over $3,300 after dropping below $2,100 less than two weeks ago. But although ETH is breaking new highs in terms of USD, it’s still well below its all-time highs when denominated in BTC.
Last month Bitcoin (BTC) reached about 3.2x of its peak price during the previous cycle in December, 2017. But so far in 2021 ETH has only reached about 2.4x of its previous all-time high set in January, 2018.
Source: Coin Metrics Network Data Charts
A lot of ETH’s 2021 success has been driven by retail investors. The NFT explosion has helped bring in new users and mainstream attention for Ethereum. And decentralized finance (DeFi) total value locked continues to reach new heights as more investors enter the ecosystem.
On-chain data provides some evidence for ETH’s retail growth. ETH addresses holding relatively small amounts (between 0.01 and 1 ETH) have increased by about 3.8M since the start of the year, to over 13.6M. For context, on May 4th, 2018 there was a total of 3.8M addresses holding 0.01 - 1 ETH.
Source: Coin Metrics Network Data Charts
ETH’s 2017/2018 cycle was also largely driven by retail investors. But there’s one big difference between the previous cycle and today: institutions. Institutional investors started entering crypto at an unprecedented rate in 2020, and have pushed BTC prices to new all-time highs in 2021.
Institutions Incoming
While institutional investors have been pouring into BTC they have been slower to adopt ETH. But there are signs that ETH is finally starting to gain some momentum with institutions going into the summer.
Chicago Mercantile Exchange (CME) futures are one of the primary ways that institutional investors can get exposure to crypto. Unlike most crypto exchanges, CME is regulated in the US and has a long history with traditional derivatives, which makes it a trusted venue for institutions. Coin Metrics introduced CME market data coverage as part of our recent Market Data Feed updates. For an introduction to crypto futures data see our Crypto Futures Data Primer research report.
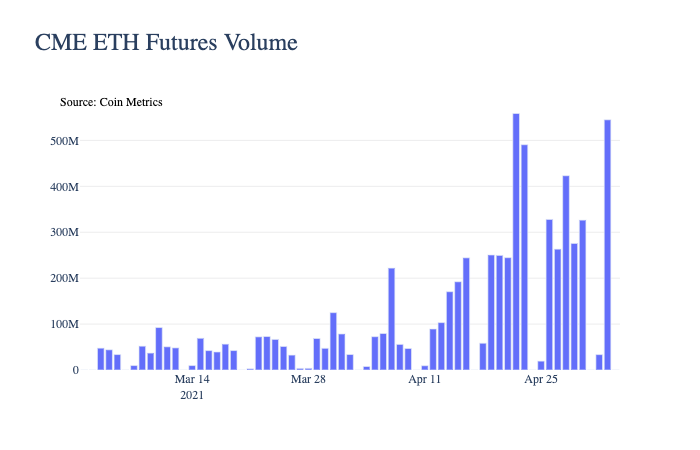
CME first introduced BTC futures in December, 2017. But they just added ETH futures in February, 2021. While CME ETH futures trading volume was relatively low in March, it surged in April, reaching a daily high of over $500M.
Source: Coin Metrics Market Data
Although CME ETH futures trading volume is growing it's still significantly lower than BTC. CME BTC futures have hit a daily high of over $6B so far in 2021. But BTC volume peaked in late February. ETH volume just started to hit new highs in April, and appears to still be ramping up.
Source: Coin Metrics Market Data
Although institutions may still be wading into ETH, ETH should soon get significantly more attractive to institutional investors.
Improving Economics
Up until now, some institutional investors have had concerns about Ethereum’s economic policies and relatively high inflation rate compared to Bitcoin. But some of those concerns will soon start to get addressed with the upcoming release of Ethereum Improvement Proposal (EIP) 1559.
EIP-1559 is set for release in July as part of Ethereum’s upcoming London hard fork. In addition to improving ETH gas UX, EIP-1559 will burn a portion of ETH transaction fees. This will permanently remove a portion of supply from circulation and decrease the daily net issuance of ETH. For an overview of how EIP-1559 will change Ethereum’s gas fee mechanism check out The Ethereum Gas Report.
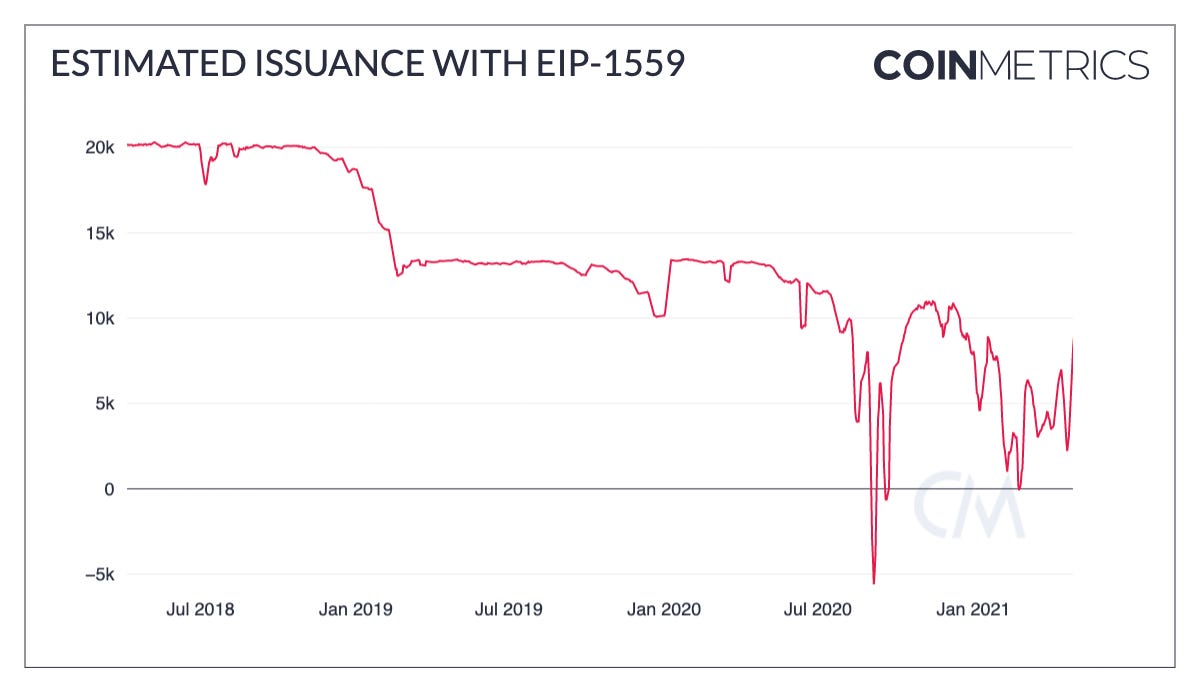
For example, the following chart shows what the net daily issuance of ETH would look like if EIP-1559 results in 75% of fees being burned. This is just a historical estimate calculated by subtracting 75% of daily fees from the amount of ETH issued daily - there’s no way to know exactly what percent of fees will be burned compared to what percent will go towards tips once EIP-1559 goes live. But it shows that issuance will likely be reduced by a significant amount, and may even turn negative during periods of extremely high fees.
Source: Coin Metrics Network Data Charts
This would lead to an estimated annual inflation rate (30-day average) of between 1-2%. Again, this is just an estimation, and it will fluctuate depending on the amount of daily transaction fees as well as the percent that is burned. But overall ETH’s inflation rate should drop significantly.
Source: Coin Metrics Network Data Charts
In addition to EIP-1559, other improvements are in the works. The introduction of Ethereum 2.0 staking will effectively turn ETH into a yield bearing asset. There’s already over 4.1M ETH locked in the Ethereum 2.0 staking contract. And with Coinbase and others starting to introduce Ethereum staking products the number of ETH staked will only increase.
Layer 2 scalability solutions are also already being rolled out. AAVE recently introduced an integration with Polygon (MATIC) which already has over $2B of deposits. And solutions including Immutable X are helping NFT platforms scale, which should help further attract retail investors.
If retail users continue to adopt ETH and more institutions start entering, ETH could be in for a big second half of 2021. To explore the data used in this piece and our other on-chain metrics check out our free charting tool, formula builder, correlation tool, and mobile apps.
Network Data Insights
Summary Metrics
Source: Coin Metrics Network Data Pro
ETH market cap increased by 19.7% week-over-week as price topped $3K for the first time ever. But ETH active addresses declined a little after reaching a new all-time high of over 900K the previous week.
BTC’s market cap remained over $1T after temporarily dropping back into the billions at the end of April. Hash rate grew 8% week-over-week and has recovered after dropping in mid-April due to blackouts in Northwest China.
Network Highlights
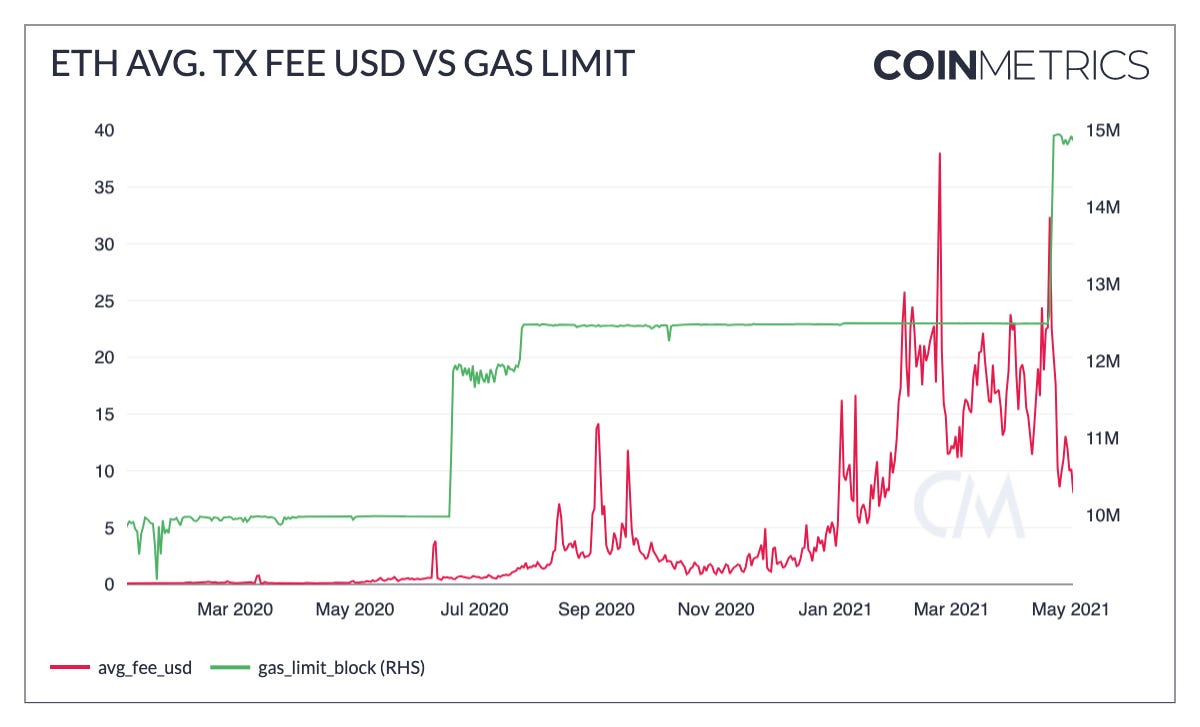
Ethereum transaction fees have soared to new all-time highs in 2021 with the continued rise of DeFi and unprecedented demand for block space. But in May the average Ethereum gas price has dropped down to its lowest level since December 2020, even though network usage remains high.
On April 22nd, Ethereum miners raised the gas limit to about 15M per block. This means that more space is available per block, which has helped push down the average gas price.
Source: Coin Metrics Network Data Pro
Average transactions per block reached 246 on April 22nd, which is the highest it's been since January 2018. Since then the average has stayed above 213, which is equal to the previous high over the last two years.
Source: Coin Metrics Network Data Pro
The average transaction fee paid in terms of USD has also dropped to below $10 despite ETH price hitting new all-time highs.
Source: Coin Metrics Network Data Pro
Coin Metrics Updates
This week’s updates from the Coin Metrics team:
Coin Metrics is pleased to announce the version 2.3 release of our CM Market Data Feed. This release significantly expands the exchanges in our coverage universe including data from CME and Bybit, introduces options data, and contains an upgrade to our candles data.
Check out our new market-data focused newsletter State of the Market, featuring weekly updates on market conditions.
As always, if you have any feedback or requests please let us know here.
Subscribe and Past Issues
Coin Metrics’ State of the Network, is an unbiased, weekly view of the crypto market informed by our own network (on-chain) and market data.
If you'd like to get State of the Network in your inbox, please subscribe here. You can see previous issues of State of the Network here.


