Coin Metrics' State of the Network: Issue 62
Tuesday, August 4th, 2020
Get the best data-driven crypto insights and analysis every week:
Weekly Feature
Derivatives’ Disparities: Surveying the Bitcoin Perpetual Swap Market
by Karim Helmy and the Coin Metrics Team
The following is an excerpt from our research on the crypto derivatives market (truncated due to space limitations). Read the full piece here.
Dissecting Derivatives
The crypto market is still young and the contract structure of derivatives varies across exchanges. Derivatives lack a standard methodology by which to calculate indexes and funding payments, and documentation in this space is generally difficult to follow. While these figures are important for traders to understand, especially during periods of market volatility, there’s a severe shortage of information on the topic.
Derivatives are incredibly influential on the broader market due to their association with levered trading, and bitcoin’s recent price appreciation has led to a surge in perpetual swap volumes. As is the norm in crypto, liquidity in this market is highly fragmented—in the case of derivatives, differing contract terms and API structures make it particularly difficult to harmonize data collected from different exchanges. These differences obscure the amount of risk taken on by users, especially through index composition and funding calculation.
To help us build out our upcoming derivatives data product which will complement our existing market data feed, the Coin Metrics team aggregated information from major derivatives markets on their contract structures. In this issue, we’ll take a close look at the state of the bitcoin perpetuals market and the discrepancies between perpetual swap contracts.
Volatile Volumes
A perpetual swap, also known as a perpetual, is a type of derivative that approximates the price of its underlying asset in close to real time. Perpetual swaps resemble fixed-maturity futures but don’t settle. Instead, these derivatives use a mechanism called funding to keep swap prices in line with those of the underlying asset.
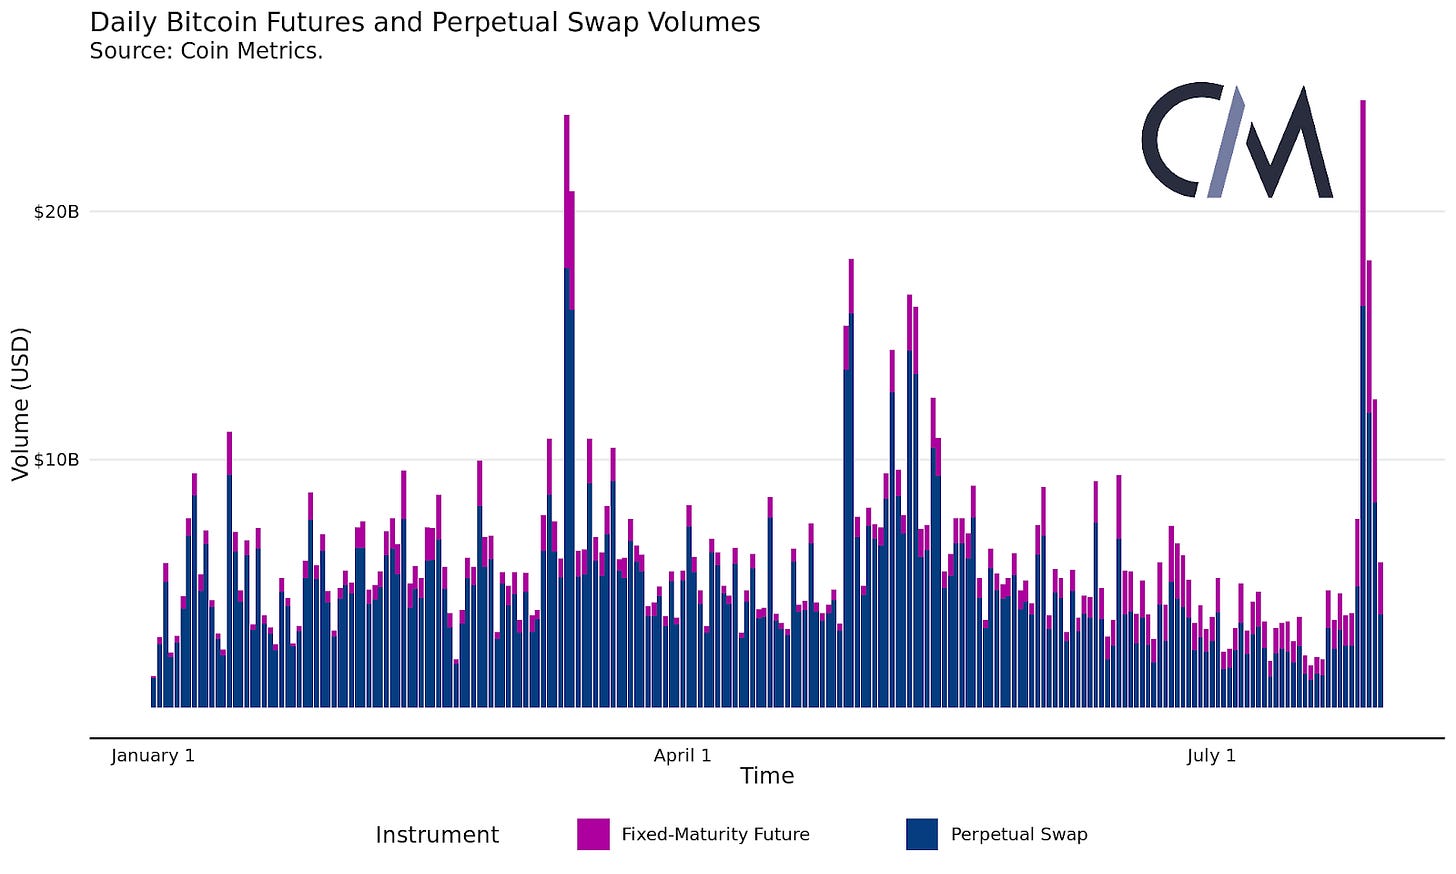
Perpetuals were popularized in the crypto ecosystem by BitMEX, and are rare in traditional financial markets. Perpetual swaps account for a substantial portion of derivatives trading volume, dwarfing fixed-maturity futures volumes across the exchanges tracked by Coin Metrics.
Although perpetuals continue to drive the markets, year-to-date, monthly volumes across the exchanges where Coin Metrics currently has access to historical data have declined significantly. Binance, in particular, has gained a significant amount of market share this year.
A look at daily volumes reveals that trading volumes across exchanges tend to move in tandem with one another. It also shows a resurgence in activity in late July, corresponding to the recent appreciation in Bitcoin’s price. This view also traces the change in market dynamics to the March 12 crash; the role of derivatives exchanges in this crash was the subject of SOTN Issue 43.
Perpetuals are highly influential on crypto markets. Trading volume in the bitcoin perpetuals markets tracked by Coin Metrics is significantly higher than in all crypto spot markets passing Coin Metrics’ Trusted Volume Framework.
Continue reading Derivatives’ Disparities: Surveying the Bitcoin Perpetual Swap Market...
Network Data Insights
Summary Metrics
Source: Coin Metrics Network Data Pro
Bitcoin (BTC) and Ethereum (ETH) market caps both surged to new 2020 highs over the weekend breaking well past pre-March levels. Usage metrics also continue to grow, adding to evidence of a rising bull market.
BTC averaged over 1 million daily active addresses over the past week for the first time since January 2018. ETH had 626K active addresses on August 2nd and is closing in on the all-time high of 735K set on January 16th, 2018.
Transaction fees also continue to rise which signals increasing demand for block space. ETH averaged almost $2M worth of daily fees over the last week, and is still outpacing BTC. But BTC is catching up, as BTC daily transaction fees grew 67.4% week-over-week compared to a 28.7% growth for ETH.
Network Highlights
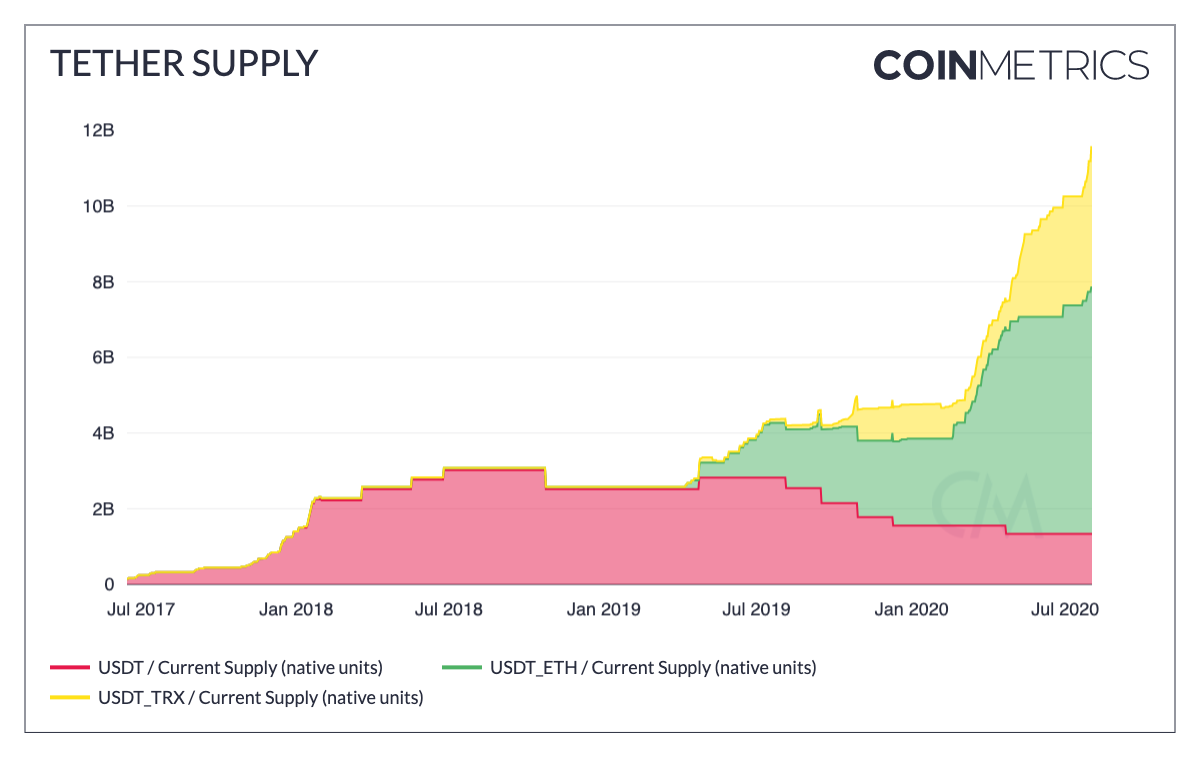
Stablecoins are back on the rise, once again led by Tether. Since the beginning of August the total Tether supply has grown by over 400M to a total of over 11.5B. Much of the growth has come from the Tron version of Tether (USDT-TRX), which has increased by about 250M since July 31st. But the majority of Tether’s supply remains on Ethereum (USDT-ETH). USDT-ETH continues to add to the rise in overall Ethereum usage. For more on what’s driving the recent rise of stablecoins check out our Rise of Stablecoins report.
Source: Coin Metrics Network Data Charts
Tether has also risen back above its price peg to its highest levels since mid-May. Tether’s price has been significantly higher than the other major stablecoins (excluding DAI) so far throughout August.
Source: Coin Metrics Network Data Charts
Stablecoin transfer value reached over $5B on July 27th, led by USDT-ETH, USDC, and DAI. DAI, USDC, and increasingly USDT-ETH are all used extensively in decentralized finance (DeFi) applications such as Compound, Aave, and Curve Finance, which contributed to the large increase in transfer value. The following chart shows adjusted transfer value smoothed using a 7 day rolling average.
Source: Coin Metrics Network Data Charts
Market Data Insights
ETH and BTC Move Higher
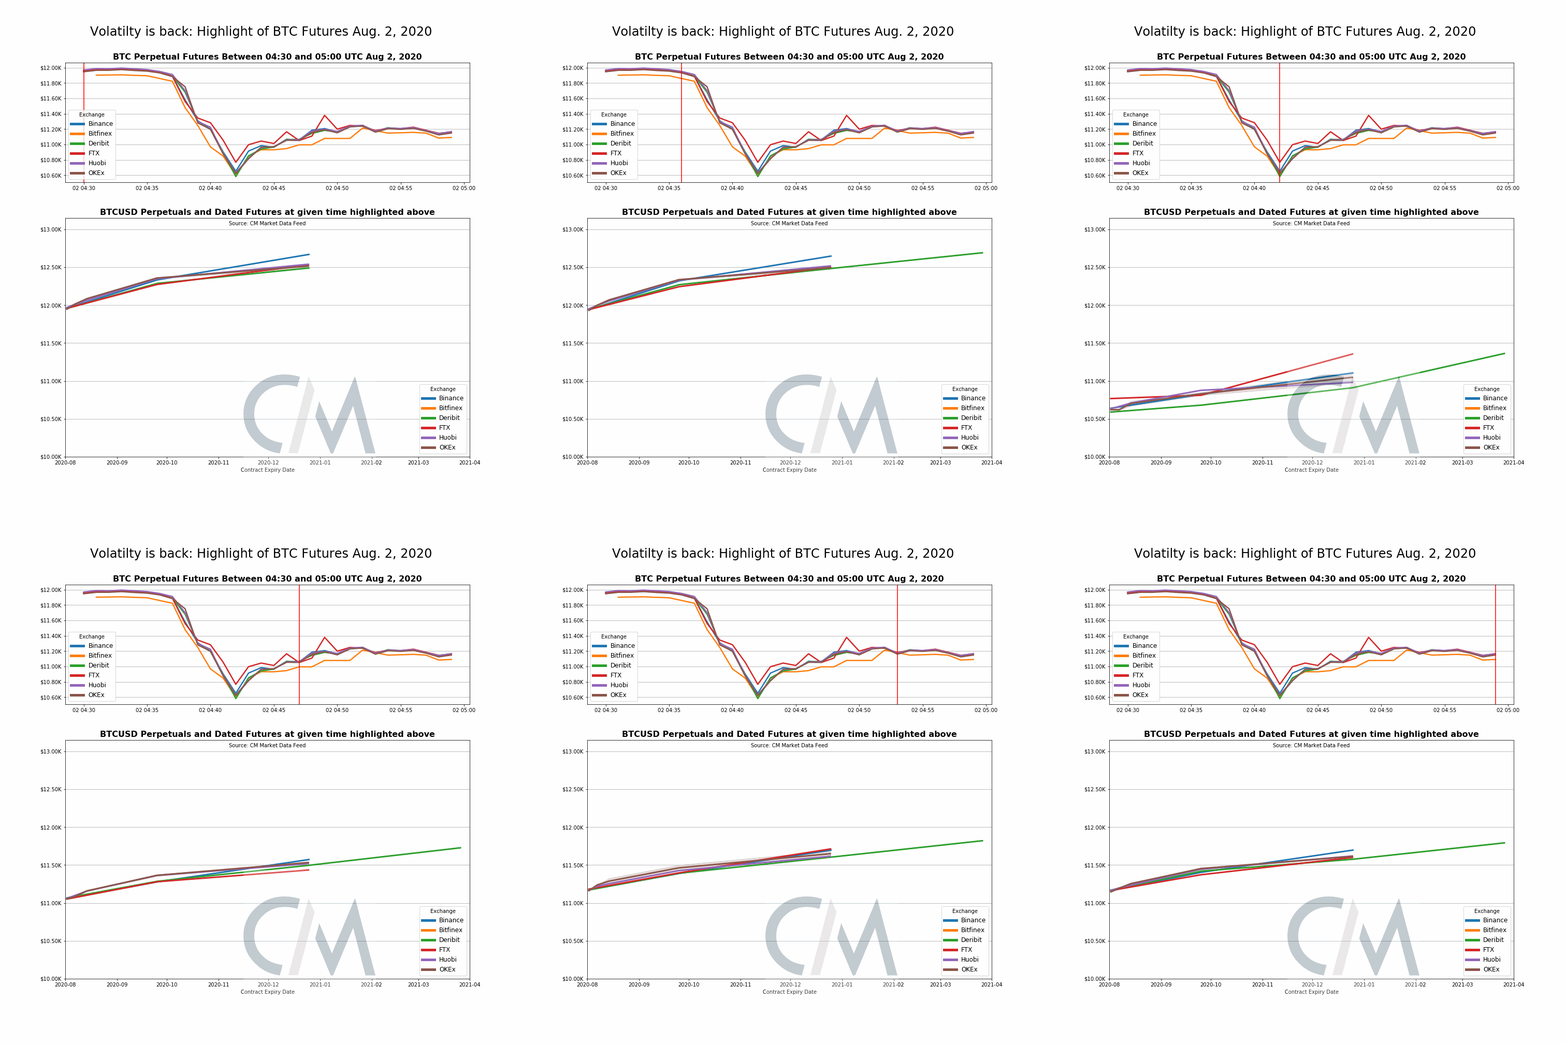
Following July’s break in the low volatility regime, BTC and ETH continue to move higher this past weekend. On the morning of August 2, 2020, ETH broke $400, reaching a high of approximately $415, a level not seen in over a year. BTC also breached a key level of $12,000. However these price levels were not sustained for long, both selling off rapidly.
Above is a view of the BTC perpetual and dated futures during the selloff this weekend, highlighting the brief decoupling the quarterly contracts near the local bottom.
After the brief selloff this weekend, both BTC and ETH resumed climbing in price, with BTC trading in the $11 - 11.5k range and ETH looking to breach $400 again in the $380 - $400 range.
CM Bletchley Indexes (CMBI) Insights
Another fantastic week for large cap crypto assets with the CMBI Ethereum Index leading the Coin Metrics suite of indexes, closing the week at $380.51, up 23.6%. The CMBI Bitcoin Index and Bletchley 10 performed outstandingly during the week as well, returning 13.3% and 14.0% respectively. After the large caps experiencing months of low volatility and <3% weekly returns, they have been playing some impressive catch-up these last two weeks.
The Bletchley 40 (small cap index) which had been enjoying all the returns during the low volatility period of large caps experienced another down week, falling 7.1% against the USD and a staggering 18.1% against Bitcoin. This type of market activity is not unfamiliar to crypto assets, with investors and speculators often cycling profits from large cap to small cap and vice versa as market conditions change.
The CMBI Bitcoin Index closed the month of July at $11,309.56, marking its second highest monthly close after the 31-December 2017 month end $14,150 value print. For more performance information check out the July CMBI Single Asset Index Factsheet.
Coin Metrics Updates
This week’s updates from the Coin Metrics team:
We’re excited to announce the new Coin Metrics mobile app. View real-time cryptoasset pricing and relevant on-chain data in a single app! Download for free here: https://coinmetrics.io/mobile-app/
As always, if you have any feedback or requests, don’t hesitate to reach out at info@coinmetrics.io.
Subscribe and Past Issues
Coin Metrics’ State of the Network, is an unbiased, weekly view of the crypto market informed by our own network (on-chain) and market data.
If you'd like to get State of the Network in your inbox, please subscribe here. You can see previous issues of State of the Network here.
Check out the Coin Metrics Blog for more in depth research and analysis.


