Coin Metrics' State of the Network: Issue 115
Tuesday, August 10th, 2021
Get the best data-driven crypto insights and analysis every week:
Analyzing EIP-1559’s ETH Burn
By Nate Maddrey and Kyle Waters
On Thursday, August 5th EIP-1559 went live as part of Ethereum’s London hard fork. Less than a week after the launch over 18K ETH has been burned, a total of about 32% of the total ETH that’s been issued post EIP-1559.
Source: Coin Metrics Network Data Pro
EIP-1559 represents a complete redesign of Ethereum’s transaction fee mechanism. Fees are now composed of a “base fee”, which is required for a transaction to be included in a block, and a “priority fee,” which is essentially a voluntary tip. While the priority fee is paid to miners the base fee is burned. For more details about how EIP-1559 works see the Network Highlights section of last week’s issue of State of the Network.
This burning mechanism lowers ETH’s net inflation rate. Although the amount of ETH issued per block was not affected by EIP-1559, the burned ETH from base fees is permanently removed from circulating supply, effectively cancelling out some of the new supply and creating a lower net issuance.
The following chart shows the net ETH issuance per block since the release of EIP-1559 where each dot represents an individual block. Most blocks so far have had a net issuance of between 1-2 ETH (there are also some blocks with issuance over 2 ETH due to uncle rewards). But there were also a few instances where net issuance per block turned negative.
Source: Coin Metrics Network Data Pro
Following EIP-1559’s launch several NFT drops have temporarily caused fees to soar, turning net issuance negative. At 17:00 UTC on Thursday, August 5th the COVID Punks NFT launch caused gas prices to spike as users rushed to buy the NFTs before they ran out. The NFT’s smart contract was responsible for over 500 burnt ETH over the span of about an hour. Net issuance plummeted at 17:00 following the NFT launch, reaching deflationary levels as low as -10 ETH per block.
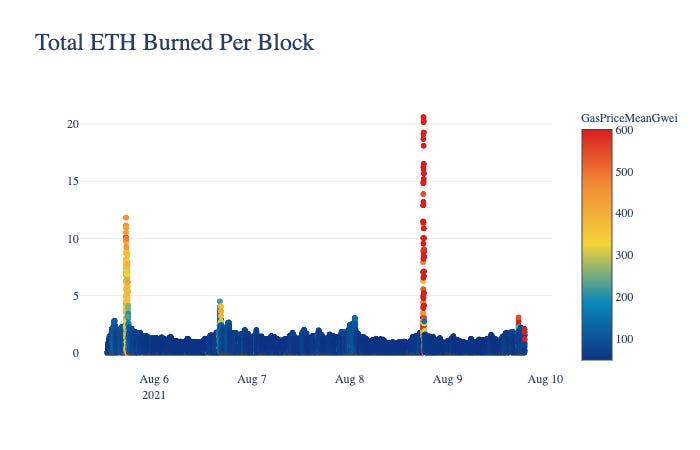
Gas price spiked again at 16:00 UTC on Friday (12:00 EDT) following another NFT launch, this time from Art Blocks. Then on Saturday August 7th the FLUF World NFT launch sent gas prices to over 700 GWEI, burning over 20 ETH in a single block.
The following chart shows ETH burned per block with each individual block represented as a dot. The color of each dot corresponds to the average gas price (in GWEI) of that block.
Source: Coin Metrics Network Data Pro
As of Monday afternoon, NFT marketplace OpenSea was responsible for over 2,100 burnt ETH, more than any other Ethereum dapp including Uniswap. NFT game Axie Infinity is responsible for the third largest amount of ETH burned, following Uniswap V2.
The average priority fee (aka miner tip) also spiked during the NFT launches. This shows that when base fee suddenly escalates transaction senders are more willing to send high tips, which results in extra revenue for miners.
Source: Coin Metrics Network Data Pro
In addition to creating a better UX for transaction fees, EIP-1559 creates a new dynamic for network congestion. While network congestion leads to high gas prices and expensive transactions it also burns a large amount of ETH, which is a positive thing for supply economics. Layer 2 solutions are still being built and rolled out to help with network scalability and will ultimately help relieve some of the network congestion. But in the meantime, with JPEG Summer still in full effect, ETH burns caused by NFT launches are still probably only going to ramp up from here.
To follow the data used in this piece and explore our other on-chain metrics check out our free charting tool, formula builder, correlation tool, and mobile apps.
Network Data Insights
Summary Metrics
Source: Coin Metrics Network Data Pro
The week was highlighted by continued debate in the US Senate over new crypto tax reporting requirements proposed in the major US infrastructure bill. The debate has centered around the broad definition of a crypto “broker” in the legislation that would require new reporting obligations from any party “responsible for and regularly providing any service effectuating transfers of digital assets”. A compromise to the tax provision was proposed to exempt certain entities but was subsequently rejected on Monday afternoon in the Senate. Once the bill is passed in the Senate it will be sent to the House for approval where there is a chance the crypto-related provisions could still be revised.
Despite the news, Bitcoin (BTC) and Ethereum (ETH) continued to rally over the last week with BTC topping $45K and ETH breaking $3K. ETH led the way during the rally, with market cap growing by 17.8% week-over-week.
Network Highlights
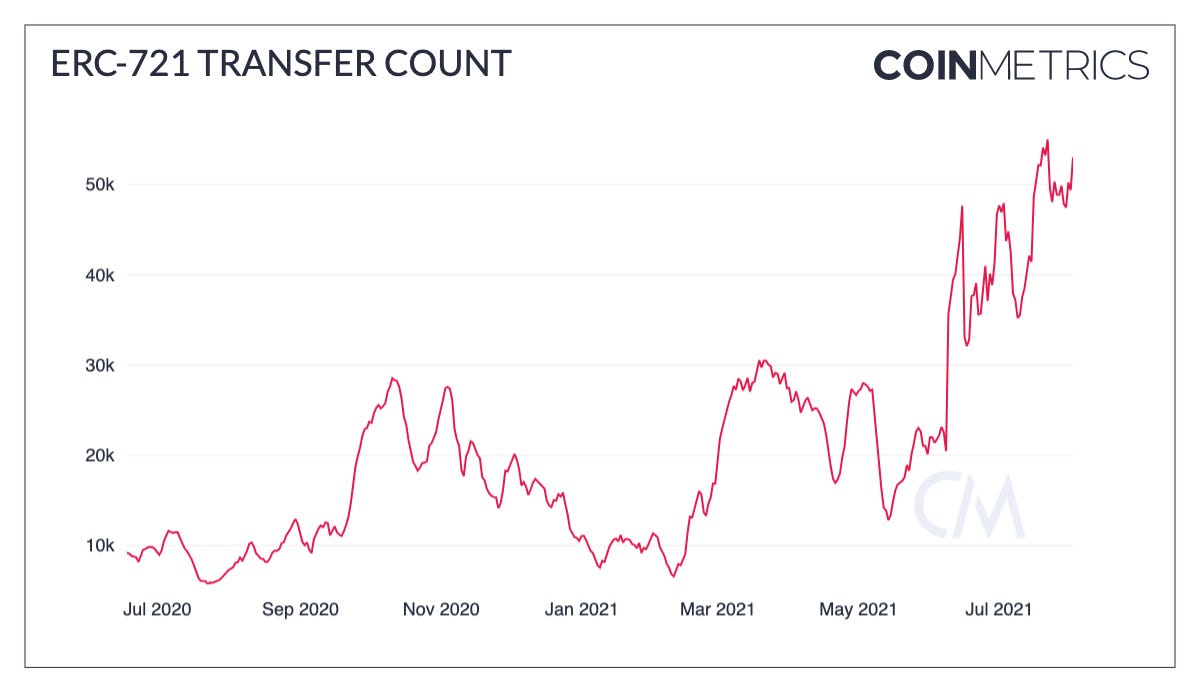
NFTs and digital collectibles have experienced massive growth in 2021. NFT activity retreated somewhat from the peak mania of March/April of this year but has been surging again lately. Daily transfers of ERC-721 tokens (the standard for Ethereum-based NFTs) is near an all-time high.
Source: Coin Metrics Network Data Charts
Pioneering NFT projects such as CryptoPunks have recorded record volume in recent weeks. On July 30, the cheapest 104 CryptoPunks (“floor punks”) were purchased in a single Ethereum block by one address for ~$7M.
Source: Coin Metrics Network Data Pro
Art Blocks, a platform for creating generative NFT art, has also registered all-time high activity in recent weeks after Three Arrows Capital went on an NFT buying spree mostly focused on Art Blocks and CryptoPunks. With NFTs becoming a mainstay of the burgeoning digital economy on Ethereum, institutional players may be taking notice and contributing to this recent rise in volume and activity.
Source: Coin Metrics Network Data Pro
On August 3rd, Coin Metrics identified a 51% attack on the Bitcoin SV network (BSV) using our FARUM network risk management tool. In a 51% attack, an adversary gains control of more than half of the network’s total hashpower to carry out malicious acts such as reorganizing the blockchain. This undermines the security and settlement assurances of the network because transactions can be reverted and multiple versions of the ledger can exist at once. The BSV chain, which is a fork of Bitcoin Cash, experienced a reorganization as deep as 14 blocks.


The graph above shows that at around 11:46AM ET on Tuesday, August 3rd the BSV chain effectively went back in time, as attackers reorganized block structure. The y-axis shows Bitcoin SV block height. Under normal circumstances, block height would increase linearly through time assuring the integrity of the ledger. But after block 698740 the height started moving backwards. The attack led to synchronization conflicts and up to three versions of the chain being mined simultaneously across pools.
Coin Metrics Updates
This week’s updates from the Coin Metrics team:
Coin Metrics is actively hiring for many positions including in engineering and data science. If you are interested in learning more about our open roles please visit our careers page.
As always, if you have any feedback or requests please let us know here.
Subscribe and Past Issues
Coin Metrics’ State of the Network, is an unbiased, weekly view of the crypto market informed by our own network (on-chain) and market data.
If you'd like to get State of the Network in your inbox, please subscribe here. You can see previous issues of State of the Network here.
Check out the Coin Metrics Blog for more in depth research and analysis.


